
Dividend Status: Ex-Date Reached — Eligibility Window Closed
Punjab & Sind Bank's record date for the FY 2025-26 final dividend is Tuesday, 21 July 2026 — which is today. Under India's T+1 settlement cycle, the ex-date is the same day as the record date. That means the last day to buy the share and still qualify for this dividend was Monday, 20 July 2026.
If you buy Punjab & Sind Bank shares today or later, you will not receive this ₹0.39 per share dividend. This article is a post-announcement analysis, not a notice of an open opportunity.
CURRENT STAGE
Payment Pending
The dividend still requires shareholder approval at the 16th Annual General Meeting scheduled for Tuesday, 28 July 2026, to be held via video conferencing. Money moves only after that approval.
WHO GETS PAID
Holders as on 21 July 2026
Shareholders whose names appear in the register of members or in the depository records at end of day on the record date.
Dividend Snapshot
DIVIDEND PER SHARE
₹0.39
Equal to 3.90% of the ₹10 face value. Final dividend for FY 2025-26.
DIVIDEND YIELD (AT CMP)
1.57%
Computed on NSE closing price of ₹24.77 as on 17 July 2026. ShareBazaar Online computation.
| Company Name | Punjab & Sind Bank |
| NSE Symbol | PSB (Series: EQ) |
| BSE Scrip Code / Scrip ID | 533295 / PSB |
| ISIN | INE608A01012 |
| Dividend Type | Final Dividend |
| Dividend Per Share | ₹0.39 |
| Dividend Percentage | 3.90% |
| Face Value | ₹10 per share |
| Financial Year | FY 2025-26 |
| Announcement Date | 27 April 2026 (Board recommendation with Q4 results) |
| Record Date | 21 July 2026 |
| Ex-Date | 21 July 2026 |
| Payment Date | Not Disclosed by Company |
| AGM Date | 28 July 2026 (16th AGM, via VC/OAVM) |
| AGM Approval Required | Yes |
| Shares Outstanding | 709.56 crore |
| Paid-up Equity Share Capital | ₹7,095.59 crore |
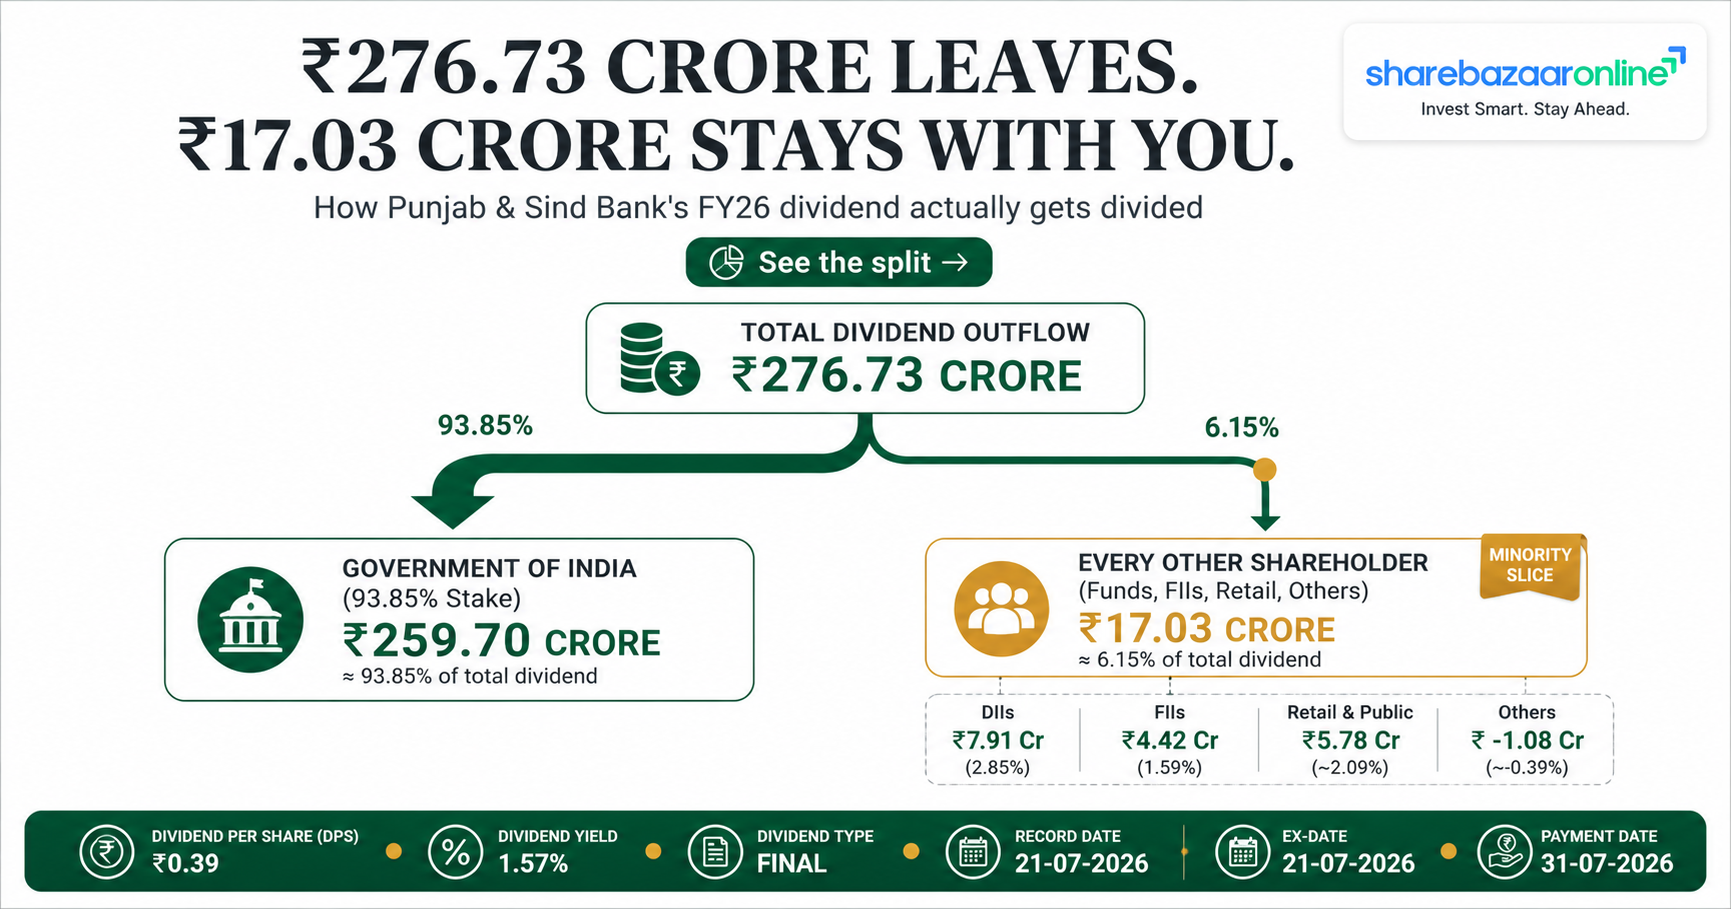
| Total Dividend Outflow | ₹276.73 crore (ShareBazaar computed) |
| Management Commentary on Dividend | Not Disclosed by Company |
Dividend Announcement Summary
Punjab & Sind Bank is a Government of India undertaking headquartered at 21 Rajendra Place, New Delhi, and is among the smallest of India's public sector banks by balance sheet size. On 27 April 2026, alongside its audited results for the year ended 31 March 2026, the Board of Directors recommended a final dividend of ₹0.39 per equity share for FY 2025-26, subject to shareholder approval.
On 2 July 2026, through a filing signed by Company Secretary Saket Mehrotra (Ref: PSB/HO/Shares Cell/25/2026-27), the bank informed BSE and NSE that the record date for this dividend would be Tuesday, 21 July 2026, ahead of the 16th AGM on 28 July 2026.
What the filing actually said
The 2 July intimation is a single-purpose record date notice. It carries no dividend amount, no payment date, no financial commentary and no rationale. Everything beyond the record date in this article has been sourced from the bank's Q4 FY26 results filing, exchange disclosures and market data — each labelled accordingly.
The headline number readers keep missing
₹0.39 looks tiny. But against FY25's ₹0.07 per share, this is a 457% increase — the largest single-year percentage jump in the bank's dividend since it resumed payouts in FY22, and the highest absolute dividend it has declared since FY2015-16.
Key Dates Timeline
| Event | Date | What It Means |
|---|---|---|
| Board Recommendation | 27 April 2026 | Board proposed ₹0.39 per share along with FY26 audited results. |
| Record Date Intimation | 02 July 2026 | Bank filed the record date notice with BSE and NSE. |
| Last Cum-Dividend Day | 20 July 2026 | Final day on which a purchase would settle in time to qualify. |
| Ex-Date | 21 July 2026 | Share trades without dividend entitlement from this day. |
| Record Date | 21 July 2026 | Cut-off for identifying eligible shareholders. |
| Annual General Meeting | 28 July 2026 | Shareholders vote to approve the dividend. Held via VC/OAVM. |
| Payment Date | Not Disclosed by Company | Statutorily payable within 30 days of AGM declaration, i.e. on or before roughly 27 August 2026. In FY25 the bank paid on 4 September 2025 against a 29 July 2025 record date. |
Why the ex-date and record date are the same
Indian equities settle on a T+1 basis — a trade done today is delivered into your demat account the next working day. Because of this, the exchanges set the ex-date on the same calendar day as the record date. You had to already own the share at the start of 21 July 2026 to be counted.
Dividend Yield Analysis
YIELD ON ANNOUNCEMENT DATE
1.52%
₹0.39 ÷ ₹25.65 (BSE price around the 27-28 April 2026 results announcement). ShareBazaar computation.
YIELD ON LATEST CMP
1.57%
₹0.39 ÷ ₹24.77 (NSE close, 17 July 2026). ShareBazaar computation.
Yield reality check: how much of this is the dividend, and how much is the falling price?
A yield jumping from roughly 0.25% last year to 1.57% this year is a six-fold move. Retail investors often read that as pure generosity. It isn't. Two forces are working at the same time, and both need to be separated:
- The dividend genuinely went up 457% — from ₹0.07 to ₹0.39. This is the dominant factor and it is real.
- The share price fell. Punjab & Sind Bank traded at a 52-week high of ₹33.54 and is now at ₹24.77 — a decline of about 26%. Reported one-year returns are in the region of negative 24% to 26%.
Run the arithmetic: had the price stayed at ₹33.54, the same ₹0.39 dividend would have yielded only 1.16%. The price fall therefore contributes roughly 41 basis points of the headline 1.57% yield — about a quarter of it. A meaningful slice of this "improved yield" is compensation for capital that has already been lost, not new income created.
Context: 1.57% is still low
Even after a 457% dividend increase, PSB's yield sits below Union Bank of India (around 2.94% at ₹161.43 on a ₹4.75 dividend) and Bank of Maharashtra (around 3.0%). A one-year bank fixed deposit in India comfortably beats this yield. PSB is not a yield stock. It is a low-payout bank that has just become less stingy.
Dividend History Analysis
| Financial Year | Dividend Per Share | Record Date | Remark |
|---|---|---|---|
| FY 2025-26 | ₹0.39 | 21 Jul 2026 | Current dividend. Highest since FY16. |
| FY 2024-25 | ₹0.07 | 29 Jul 2025 | Lowest ever declared. Paid 4 Sep 2025. |
| FY 2023-24 | ₹0.20 | 17 Jul 2024 | Cut of 58% from prior year. |
| FY 2022-23 | ₹0.48 | 04 Jul 2023 | Declared alongside record FY23 PAT of ₹1,313 crore. |
| FY 2021-22 | ₹0.31 | 05 Jul 2022 | First dividend after a long suspension. |
| FY 2016-17 to FY 2020-21 | Nil | — | Five consecutive years of no dividend through the PSU bank asset-quality crisis. |
| FY 2015-16 | ₹1.65 | 22 Jun 2016 | Last of the "old regime" payouts. |
| FY 2014-15 | ₹0.60 | 22 Jun 2015 | — |
| FY 2013-14 | ₹2.20 | 28 Jan 2014 & 13 Jun 2014 | ₹1.60 interim + ₹0.60 final. Only year with two payouts. |
| FY 2012-13 | ₹2.68 | 07 Jun 2013 | Highest in the last decade and a half. |
| FY 2011-12 | ₹2.00 | 15 Jun 2012 | — |
Dividend history compiled from exchange filings and market data aggregators. Amounts are per equity share of ₹10 face value.
CLASSIFICATION
Irregular Payer
In the 15 years since listing, PSB has skipped the dividend entirely in five straight years and has cut it in two of the last four. There is no reliable pattern a dividend investor can plan around.
THE UNCOMFORTABLE COMPARISON
FY26's ₹0.39 is being reported as a breakout. But in FY13 the bank paid ₹2.68 per share — nearly 7 times today's dividend — on a far smaller equity base. Because the share count has ballooned through repeated government recapitalisation, per-share dividends face a structural headwind that profit growth alone cannot fix.
Financial Performance Analysis
FY 2025-26 Headline Numbers (Standalone)
| Metric | FY26 | FY25 | Change |
|---|---|---|---|
| Net Profit | ₹1,321.93 cr | ₹1,015.83 cr | +30.12% |
| Total Business | ₹2,63,652 cr | ₹2,29,379 cr | +14.94% |
| Advances Growth | +18.29% | +15.87% | Accelerating |
| Gross NPA Ratio | 2.40% | 3.38% | −98 bps |
| Net NPA Ratio | 0.79% | 0.96% | −17 bps |
| Return on Assets | 0.79% | Not Disclosed by Company | — |
| Cost-to-Income Ratio | 60.97% | Not Disclosed by Company | — |
| Capital Adequacy (CRAR) | 17.42% | 17.41% | Flat |
| Debt-Equity Ratio | 0.55 | 0.63 | Improved |
| Earnings Per Share | ₹1.86 | ₹1.43 | +30.1% |
Source: Punjab & Sind Bank audited FY26 results filed with the exchanges on 27 April 2026, and Q4 FY25 results filed 30 April 2025. EPS derived by ShareBazaar Online from PAT ÷ 709.56 crore shares.
Operating leverage analysis: where the 30% profit growth actually came from
This is the part of the FY26 result that headlines skipped. Look at the fourth quarter in isolation:
- Q4 FY26 total income fell to ₹3,457.36 crore from ₹3,835.70 crore in Q4 FY25 — a decline of 9.9% year-on-year.
- Yet Q4 FY26 net profit rose 34.9% to ₹421.83 crore from ₹312.78 crore.
Income down, profit sharply up. That gap is not operating leverage — it is lower provisioning and a favourable base effect. Management itself flagged that the Q4 FY25 net interest income included a one-off resolution benefit of over ₹200 crore; excluding it, underlying NII growth would have been above 8% rather than the optically weaker reported figure.
The same pattern repeats in the very next quarter. In Q1 FY27 (June 2026), net interest income grew a healthy 15.33% to ₹1,038 crore, but operating profit grew only 0.93% — from ₹540 crore to ₹545 crore. Net profit still rose 23.05%. Once again, almost the entire bottom-line growth came from below the operating line, chiefly reduced credit costs as bad loans fell.
Why this matters for the dividend: provision write-backs are finite. Gross NPA has already compressed from 5.43% (FY24) to 2.21% (Q1 FY27). There is far less bad-loan pain left to release. Future profit growth — and therefore future dividend growth — will have to come from net interest margin and cost control, where the bank is visibly weaker. Its cost-to-income ratio of 60.97% is high, and NIM of 2.53% sits below management's own guided range of 2.65–2.70%.
Consolidated vs standalone
Punjab & Sind Bank reports and is analysed on a standalone basis. It does not carry material subsidiaries, associates or joint ventures that would create a meaningful gap between consolidated and standalone numbers. Consolidated FY26 financials: Not Disclosed by Company at the time of writing. All figures in this analysis are standalone.
Cash Flow Analysis
Reading a bank's cash flow honestly
For a manufacturing company, operating cash flow versus net profit is the single best lie-detector. For a bank, it is not. A bank's operating cash flow swings violently with deposit inflows and loan disbursements — a bank that grows its loan book fast will show negative operating cash flow precisely because it is doing well. Applying the standard template here would mislead readers, so we do not.
Full FY26 cash flow statement: Not Disclosed by Company. Punjab & Sind Bank has published audited results but the detailed FY26 annual report and cash flow statement are expected only after the AGM on 28 July 2026. Free Cash Flow: Not Disclosed by Company. Receivables growth is not a meaningful metric for a bank and is therefore not reported.
How this dividend is being funded
On the available evidence, the ₹276.73 crore outflow is funded from current-year earnings. FY26 net profit of ₹1,321.93 crore covers the dividend 4.78 times over. There is no indication of the dividend being funded by asset sales or by fresh borrowing.
But note the borrowing backdrop
The bank has been an active bond issuer, including ₹3,000 crore of long-term infrastructure bonds raised in the December 2024 quarter, with board approvals in place for further Basel III AT-1/Tier-II and infrastructure bond issuance. A bank paying out capital while simultaneously raising capital-adjacent debt is a tension readers should note — even though the sums here are not alarming.
Cash coverage
A meaningful "cash and investments ÷ dividend outflow" ratio cannot be constructed for a bank, because a bank's investment book is funded by depositor money, not shareholder money. Quoting such a ratio would produce an impressively large but entirely fake number. Cash Coverage: Not Disclosed by Company / not meaningful for a banking entity. The relevant substitute is capital adequacy, covered in the next section.
Balance Sheet Strength
CAPITAL ADEQUACY (CRAR)
17.42%
As at 31 March 2026, against a regulatory minimum in the region of 11.5%. Q1 FY27 stood at 17.61%.
NET NPA
0.65%
As at 30 June 2026, down from 0.79% at FY26-end. Gross NPA at 2.21%, down 113 bps year-on-year.
PROVISION COVERAGE RATIO
91.38%
Last disclosed level (FY25). FY26 PCR: Not Disclosed by Company in the summary results.
BOOK VALUE PER SHARE
≈ ₹18.35
Derived from CMP ₹24.77 and reported P/B of 1.35. Stock trades at a 35% premium to book — rich for a bank with 0.79% RoA.
Impact of the dividend on capital
₹276.73 crore leaving the balance sheet reduces Tier-I capital by that amount. Against the bank's risk-weighted asset base, ShareBazaar Online estimates the CRAR impact at roughly 25 to 35 basis points — immaterial against a 17.42% starting point. This is a ShareBazaar estimate; the bank has not disclosed the capital impact.
Net debt for a bank is not a meaningful concept, since deposits are operating liabilities rather than debt. Net Debt: Not Disclosed by Company / not applicable. The debt-equity ratio, which for banks captures borrowings against net worth, improved to 0.55 from 0.63.
Dividend Sustainability Analysis
| Ratio | Value | Working |
|---|---|---|
| Total Dividend Outflow | ₹276.73 crore | ₹0.39 × 709.56 crore shares |
| Dividend Payout Ratio | 20.94% | ₹276.73 cr ÷ ₹1,321.93 cr PAT |
| Dividend Coverage Ratio | 4.78 times | EPS ₹1.86 ÷ DPS ₹0.39 |
| Prior-Year Payout Ratio | 4.89% | FY25: ₹49.67 cr ÷ ₹1,015.83 cr |
| Outflow as % of Market Cap | 1.57% | ₹276.73 cr ÷ ₹17,576 cr |
| Free Cash Flow Coverage | Not Disclosed by Company | FY26 cash flow statement pending |
All ratios computed by ShareBazaar Online from reported figures.
Arguments for sustainability
- Payout ratio of 20.94% leaves nearly four-fifths of profit retained.
- Earnings covered the dividend 4.78 times.
- CRAR at 17.42% is far above regulatory requirement.
- Asset quality is improving sharply — GNPA down to 2.21% by Q1 FY27.
- Business growth of 14.94% is funding itself without capital stress.
Arguments against sustainability
- Payout ratio quadrupled in one year — from 4.89% to 20.94%. That is a policy jump, not a trend.
- Profit growth is provision-led, not operations-led. Operating profit grew just 0.93% in Q1 FY27.
- NIM of 2.53% is below management's own 2.65–2.70% guidance.
- Cost-to-income at 60.97% is among the weaker readings in the PSU bank pack.
- New RBI expected credit loss norms carry an estimated ₹600–800 crore impact over five years — more than two full years of the current dividend.
- The bank cut its dividend in FY24 and again in FY25. It has done so before.
SHAREBAZAAR CLASSIFICATION
Moderately Sustainable
The current ₹0.39 dividend is comfortably affordable — that much is not in doubt. What is in doubt is whether it repeats. The payout ratio has moved to a level PSB has not sustained before, on profits that were flattered by falling credit costs, at a bank whose core operating profit is close to flat. Treat ₹0.39 as a level to be re-tested next year, not a new floor.
Peer Comparison
| Bank | FY26 Dividend | Approx. Yield | Note |
|---|---|---|---|
| Punjab & Sind Bank | ₹0.39 | 1.57% | Payout 20.94%. FV ₹10. |
| State Bank of India | ₹17.35 | Not Disclosed by Company | Announced 8 May 2026, record date 16 May 2026. |
| Bank of Baroda | ₹8.50 | Not Disclosed by Company | Part of ₹7,023 cr paid to government with Canara and Indian Bank. |
| Canara Bank | ₹4.20 | Not Disclosed by Company | 210% of ₹2 face value. ₹2,397 cr paid to government. |
| Union Bank of India | ₹4.75 | 2.94% | At a market price of ₹161.43. |
| Punjab National Bank | ₹3.00 | Not Disclosed by Company | Record date 13 June 2026. |
| Bank of Maharashtra | ₹1.50 | ≈3.0% | Payout ratio around 30%. |
| Central Bank of India | 12% (interim, in four tranches) | Not Disclosed by Company | ₹969.64 cr paid to the government for FY26. |
Peer dividends sourced from exchange announcements and press reports. Yields shown only where a reliable matching price was available; others marked as not disclosed rather than estimated.
Where PSB sits
Even after quadrupling its payout ratio, PSB's 1.57% yield trails Union Bank (2.94%) and Bank of Maharashtra (≈3.0%). Its payout ratio of 20.94% is below Bank of Maharashtra's 30% and roughly in line with PNB's 21.19% historical payout.
The profitability gap explains the yield gap
PSB's RoA of 0.79% compares with PNB's 1.06% for FY26. Its NIM of 2.53% is below PNB's 2.57%, and its cost-to-income at 60.97% is materially worse than PNB's 50.31%. PSB pays less because it earns less per rupee of balance sheet — this is a profitability story, not a policy quirk. Peer ROE and ROCE: Not Disclosed by Company on a comparable FY26 basis.
Promoter Impact Analysis
GOVERNMENT OF INDIA HOLDING
93.85%
The President of India is the promoter. FII holding is 0.14–0.16%, DII holding 3.90–4.00%, and public/retail roughly 2.09%.
GOVERNMENT'S SHARE OF THE DIVIDEND
₹259.70 cr
93.85% × ₹276.73 crore. ShareBazaar computation.
What is left for everyone else
Non-promoter shareholders — every mutual fund, foreign investor and retail holder combined — will share approximately ₹17.03 crore. The retail float alone, at about 2.09% of equity, receives roughly ₹5.78 crore.
This concentration matters for a reason retail investors rarely consider. The dividend decision at a 93.85%-owned PSU bank is functionally a decision about the government's non-tax revenue, not about minority shareholder returns. The Centre collected a record ₹78,438 crore in dividends from central public sector enterprises in FY26, comfortably above its ₹71,000 crore budget target. When the fiscal calendar wants cash, PSU bank payout ratios move. When the government prioritises recapitalisation instead, they move the other way — which is exactly what PSB's own history from FY17 to FY21 shows.
The practical implication: a minority holder in PSB is a passenger on a dividend policy set by the majority owner's budget needs. That is not a criticism, but it is the single most important thing to understand about forecasting this bank's future payouts.
Taxation Analysis
How dividends are taxed in India today
- Since April 2020, Dividend Distribution Tax has been abolished. The company no longer pays tax on your behalf.
- Dividend income is added to your total income under "Income from Other Sources" and taxed at your applicable slab rate. A 5% slab taxpayer pays 5%; a 30% slab taxpayer pays 30%.
- Under Section 194, the company deducts TDS at 10% if your total dividend from that company in a financial year exceeds ₹10,000 (the threshold was raised from ₹5,000 with effect from 1 April 2025).
- If your PAN is not updated with the company or depository, TDS rises to 20%.
- TDS is not the final tax. It is a credit you claim when filing your return, against the slab-rate liability.
- You may deduct interest expense of up to 20% of dividend income if you borrowed to buy the shares. No other expenses are allowed.
- Resident individuals whose total income is below the taxable threshold can file Form 15G (or Form 15H for senior citizens) to avoid TDS.
Standard worked example
1,000 shares · dividend ₹10 per share · 30% tax slab
| Gross Dividend | ₹10,000 |
| TDS at 10% (exceeds ₹10,000? No — exactly at threshold, so nil) | ₹0 |
| Tax at 30% slab | ₹3,000 |
| Health & Education Cess at 4% on tax | ₹120 |
| Net Dividend In Hand | ₹6,880 |
If the share was bought at ₹200, the pre-tax yield of 5.00% becomes an effective post-tax yield of 3.44% — a reduction of nearly a third.
The same maths on Punjab & Sind Bank
1,000 shares · dividend ₹0.39 per share · 30% tax slab · cost ₹24.77
| Investment Value | ₹24,770 |
| Gross Dividend | ₹390 |
| TDS (below ₹10,000 threshold) | ₹0 |
| Tax at 30% plus 4% cess | ₹121.68 |
| Net Dividend In Hand | ₹268.32 |
| Effective Post-Tax Yield | 1.08% |
The headline 1.57% yield becomes 1.08% after tax for a top-slab investor. To breach the ₹10,000 TDS threshold on this stock you would need to hold over 25,641 shares — an investment of roughly ₹6.35 lakh.
Tax rules change and individual circumstances differ, particularly for non-residents, HUFs, trusts and those choosing between the old and new tax regimes. Please consult a qualified chartered accountant or tax adviser before acting on any of the above.
Key Risks
1. Profit growth is running on a fuel that is nearly exhausted
Gross NPA has fallen from 5.43% in FY24 to 2.21% by June 2026. Most of the profit uplift has come from lower provisions. With operating profit growing just 0.93% in Q1 FY27, once credit costs normalise there is very little underlying momentum left to carry earnings — and therefore dividends.
2. Margin pressure against management's own guidance
NIM stood at 2.53% in Q1 FY27, below the guided 2.65–2.70% band. Advances are growing at 19% while deposits lag — funding that gap through costlier bulk deposits or bonds would squeeze margins further.
3. Expected Credit Loss transition
The bank has itself estimated an impact of ₹600–800 crore over five years from new RBI ECL provisioning norms. That is between 2.2 and 2.9 times the entire FY26 dividend outflow, and it will compete directly with payouts for capital.
4. High cost structure
A cost-to-income ratio of 60.97% means nearly 61 paise of every rupee of income is consumed by operating costs, against roughly 50% at PNB. Branch expansion and wage revisions can push this higher before efficiency gains arrive.
5. Extreme ownership concentration and free float
With the government at 93.85%, the tradable float is roughly 6%. Any future stake sale to meet minimum public shareholding norms would add supply, and thin liquidity amplifies price swings in both directions. FII holding at 0.14% signals near-total institutional foreign disinterest.
6. Residual stress in MSME and agriculture books
Management has flagged remaining stress in MSME and agricultural lending. These are the segments most sensitive to monsoon outcomes, commodity cycles and policy relief measures — and PSB's north Indian, agriculture-heavy footprint concentrates that exposure.
7. Regulatory compliance track record
The RBI imposed a penalty of ₹68.20 lakh in March 2025 for non-compliance relating to large exposure reporting and financial inclusion directives. The rupee amount is small; the signal about internal controls at a rapidly growing loan book is not.
8. Valuation offers little cushion
At ₹24.77 the stock trades at roughly 1.35 times book and 13.3 times earnings, despite an RoA of only 0.79%. Several larger, more profitable PSU banks trade at comparable or lower multiples. The stock has already fallen about 26% over one year.
What To Monitor
1. Operating profit growth, not net profit growth
This is the single most useful number for PSB right now. If operating profit stays near 0.93% growth while net profit posts 20%+, the quality of earnings is deteriorating even as headlines improve. Watch for operating profit growth crossing 10%.
2. Whether NIM reaches the guided 2.65–2.70%
Management has publicly committed to this range. Each quarter it stays at 2.53% is a quarter of missed guidance and a direct constraint on future payout capacity.
3. Gross NPA breaking below 2%
Management has targeted sub-2% GNPA. At 2.21% as of June 2026 it is close. Achieving it would confirm the clean-up; stalling above 2% would suggest the easy recoveries are done.
4. The deposit-advances growth gap
Advances grew 18.29% in FY26 and 19% in Q1 FY27 while total business grew about 15% — meaning deposits are lagging. Watch the CASA ratio and credit-deposit ratio each quarter; a widening gap forces expensive funding.
5. Cost-to-income trajectory
Track whether the 60.97% ratio falls as new branches and digital account-opening initiatives mature. Digital origination of savings, current and non-individual accounts has been moved to back-end activation — the payoff should show up here or nowhere.
6. Next year's payout ratio
FY26's payout of 20.94% is the real news, not the ₹0.39. If FY27's board recommendation holds the payout ratio near 20%, this becomes a policy. If it slides back toward single digits as in FY25, FY26 was an outlier driven by the Centre's fiscal calendar.
7. ECL provisioning disclosures
Watch quarterly commentary for how the ₹600–800 crore five-year ECL impact is being phased in, and whether the bank front-loads or back-loads it. Front-loading would pressure near-term dividends.
8. Any move on minimum public shareholding
Government holding at 93.85% remains far above the 75% cap that applies to most listed companies. Announcements on OFS, QIP or divestment timelines would materially change both the float and the share count against which future dividends are spread.
Conclusion
The positives
- Dividend up 457% year-on-year, the highest absolute payout since FY16.
- Payout ratio raised from 4.89% to 20.94% — a genuine shift in distribution policy.
- FY26 net profit of ₹1,321.93 crore, up 30.12%, a record for the bank.
- Asset quality transformed: GNPA from 5.43% (FY24) to 2.21% (June 2026).
- Capital adequacy of 17.61% leaves ample headroom above regulatory minimums.
- Business growth of 14.94% with advances up 18.29%.
- Dividend covered 4.78 times by earnings — affordability is not in question.
The negatives
- Operating profit grew only 0.93% in Q1 FY27 — the core business is close to flat.
- Q4 FY26 total income fell 9.9% year-on-year even as profit rose 34.9%.
- Profit growth is provision-led, and provisions cannot fall much further.
- NIM of 2.53% is below management's own guidance.
- Cost-to-income at 60.97% versus roughly 50% at PNB.
- Roughly 41 bps of the 1.57% yield comes from a 26% share price fall, not from generosity.
- Dividend history is irregular: five blank years, and cuts in FY24 and FY25.
- ₹259.70 crore of the ₹276.73 crore goes to the government. Minority holders share ₹17.03 crore.
- Post-tax yield for a 30%-slab investor falls to 1.08%.
The one-line summary
Punjab & Sind Bank has quadrupled its dividend payout ratio on record profits that were driven mainly by falling bad-loan provisions rather than improving core operations, and the resulting 1.57% yield is still below most PSU banking peers — with 93.85% of the cash going to a single shareholder. All the facts, computations and risks are set out above so that readers can form their own judgement. ShareBazaar Online does not issue buy, sell or hold recommendations.
Frequently Asked Questions
What dividend has Punjab & Sind Bank announced for FY 2025-26?
What is the Punjab & Sind Bank dividend yield?
What is the record date for the Punjab & Sind Bank dividend?
What is the ex-dividend date, and can I still buy the share to get the dividend?
When will the Punjab & Sind Bank dividend be paid?
Who is eligible to receive this dividend?
How is this dividend taxed in my hands?
Is the Punjab & Sind Bank dividend sustainable?
What is the Punjab & Sind Bank dividend history?
How much of this dividend goes to the Government of India?
How does Punjab & Sind Bank's dividend compare with other PSU banks?
What should investors monitor from here?
Disclaimer
This article has been prepared by ShareBazaar Online for informational and educational purposes only. It is not investment advice, and it does not contain any buy, sell or hold recommendation. Dividend details are sourced from Punjab & Sind Bank's own filings with BSE Limited and the National Stock Exchange of India Limited; market prices, shareholding data, peer figures and historical dividend records are sourced from stock exchanges and recognised market data providers, and are stated as at the dates mentioned. All derived ratios are computed by ShareBazaar Online and are labelled as such. Figures may be revised by the company in its annual report.
Share prices move, dividends are subject to shareholder approval and may be reduced or withdrawn, and past dividend records are not a reliable guide to future payouts. Investments in securities are subject to market risk. Readers should read all scheme-related and company documents carefully and consult a SEBI-registered investment adviser and a qualified tax professional before making any investment or tax decision. ShareBazaar Online and its authors accept no liability for any loss arising from the use of this information.