
Dividend Status — Completed
STATUS: COMPLETED — THIS DIVIDEND IS NO LONGER AVAILABLE
The record date for Angel One Limited's 2nd Interim Dividend of ₹1.75 per share was 27 March 2026. That date has passed. The payment window closed on 18 April 2026. As of today, 20 July 2026, this dividend has already been declared, recorded and paid.
Buying Angel One shares today does not make you eligible for this payout. This page is an archival analysis record, not a live dividend opportunity.
What has happened since
Angel One's Board declared a fresh 1st Interim Dividend for FY 2026-27 of ₹1.00 per share on 15 July 2026, alongside Q1 FY27 results, with a record date of 21 July 2026. That is a separate corporate action and is covered in a separate report. (Source: BSE corporate announcements dated 15 July 2026; Screener.in company announcements.)
Dividend Snapshot
Company Identifiers
Dividend Terms
Yield & Outflow (Computed)
Market Data
Data note: Company identifiers, dividend rate, face value, record date and payment date are taken directly from Angel One's exchange filing dated 20 March 2026. Prices, market cap, shares outstanding, financials and shareholding are sourced from NSE/BSE data as published by Goodreturns (20 March 2026), INDmoney and Screener.in (17 July 2026). All yields, outflows and coverage ratios on this page are computed by ShareBazaar Online, not quoted.
Dividend Announcement Summary
On 20 March 2026, the Board of Directors of Angel One Limited approved a 2nd Interim Dividend of ₹1.75 per equity share of face value ₹1 each for the financial year 2025-26.
The decision was not taken in a physical or video board meeting. It was passed by circular resolution — a written approval circulated to directors and signed off individually. The company disclosed that the approval came through at exactly 12:05 p.m. The intimation was filed with both exchanges under Regulations 30 and 42 of SEBI (LODR) Regulations, 2015, and signed by Company Secretary and Compliance Officer Naheed Patel (ACS: 22506).
Why a circular resolution matters
A circular resolution is used when a decision is routine and already pre-agreed. Angel One had flagged its intent on 16 March 2026, four days ahead. There was no surprise element, no separate results announcement bundled with it, and no fresh strategy disclosure. In plain terms: this was an administrative sign-off on a payout that had already been decided in principle.
What the filing did NOT say
- Total dividend outflow — Not Disclosed by Company
- Shares outstanding on record date — Not Disclosed by Company
- Management commentary or rationale — Not Disclosed by Company
- Dividend payout policy reference — Not Disclosed by Company
- Funding source for the dividend — Not Disclosed by Company
The stock-split context most reports skipped
Just weeks before this dividend, Angel One completed a 1:10 stock split — each ₹10 face-value share became ten ₹1 face-value shares, with a record date of 26 February 2026. This is critical for anyone comparing dividend numbers across years. A ₹1.75 dividend in March 2026 is not smaller than the ₹23 dividend of January 2026. On a like-for-like basis, ₹1.75 post-split equals ₹17.50 pre-split. Any dividend history table that mixes pre-split and post-split figures without adjustment will produce nonsense. We adjust throughout this report. (Split details per company filings reported by Multibagg and ScanX, January–February 2026.)
Key Dates Timeline
| Event | Date | Day | Status |
|---|---|---|---|
| Board intimation of intent | 16-03-2026 | Monday | Passed |
| Announcement / Board approval | 20-03-2026 | Friday | Passed |
| Trading window reopened | 22-03-2026 | Sunday | Passed |
| Ex-Dividend Date | 27-03-2026 | Friday | Passed |
| Record Date | 27-03-2026 | Friday | Passed |
| Payment Deadline | 18-04-2026 | Saturday | Passed |
Understanding ex-date and record date
The record date is the cut-off day on which the company freezes its shareholder register. The ex-date is the first day the share trades without the dividend right attached. Under India's T+1 settlement cycle, both dates now typically fall on the same day, as they did here. The practical rule: you had to buy on or before Thursday, 26 March 2026 for the shares to be credited to your demat account by the record date. Anyone buying on 27 March 2026 or later got the shares but not the ₹1.75.
A short payment cycle
Angel One committed to paying within 22 days of the record date. SEBI's outer limit for interim dividends is 30 days from declaration. The company built in a buffer rather than using the full window — consistent with its behaviour on the first interim dividend, where the gap between record date (21 January 2026) and payment (13 February 2026) was 23 days.
Dividend Yield Analysis
Yield on this dividend alone
Formula: (Dividend Per Share ÷ CMP) × 100
At announcement close of ₹230.20 → (1.75 ÷ 230.20) × 100 = 0.76%
At latest CMP of ₹328.95 → (1.75 ÷ 328.95) × 100 = 0.53%
Yield on full-year FY26 dividend
FY26 total (split-adjusted) = ₹2.30 + ₹1.75 = ₹4.05
At announcement close of ₹230.20 → 1.76%
At latest CMP of ₹328.95 → 1.23%
Yield reality check — read this before you quote any number
Several data portals were showing an Angel One dividend yield of 21.18% around the March 2026 record date. That figure is arithmetically real and analytically meaningless. It comes from adding up twelve months of dividends declared at ₹10 face value (₹26 + ₹23 = ₹49) and dividing by a share price that had already been divided by ten in the February 2026 stock split. Comparing pre-split rupees to post-split rupees inflates the yield by a factor of about ten.
The correct split-adjusted trailing yield is approximately 1.23%. Goodreturns itself carried both numbers side by side and flagged the adjusted figure at 2.12% on 20 March 2026 pricing. Screener.in reports 1.23% at the 17 July 2026 price. Treat any Angel One dividend yield above roughly 2.5% as a split-adjustment error until proven otherwise.
Why the yield fell between March and July
The yield on this specific dividend dropped from 0.76% to 0.53% — a 30% decline — without the dividend changing at all. The entire move came from the share price rising 42.9% from ₹230.20 to ₹328.95 between 20 March and 17 July 2026. This is the healthy version of a yield decline: yield fell because the price rose, not because the payout shrank. The unhealthy version — yield rising because the price is collapsing — is not what happened here.
Yield versus the sector
Angel One's trailing yield of 1.23% sits marginally above the Capital Markets industry average of roughly 1.1% (Simply Wall St industry data, 2026) and above the Indian market's top-quartile threshold of about 1.3% only when measured at March pricing. In short: Angel One is a modest-yield stock, not a high-yield stock. Anyone buying it primarily for dividend income at current prices is accepting a yield below most fixed-deposit rates in exchange for equity risk in one of India's most cyclical sectors.
Dividend History Analysis
Dividend history (all figures adjusted to post-split ₹1 face value)
| Ex-Date | Type | As Declared | Split-Adjusted | FY |
|---|---|---|---|---|
| 27-03-2026 | 2nd Interim | ₹1.75 | ₹1.75 | FY26 |
| 21-01-2026 | 1st Interim | ₹23.00 | ₹2.30 | FY26 |
| 30-05-2025 | Final | ₹26.00 | ₹2.60 | FY25 |
| 20-03-2025 | 2nd Interim | ₹11.00 | ₹1.10 | FY25 |
| 21-01-2025 | 1st Interim | ₹11.00 | ₹1.10 | FY25 |
| 23-01-2024 | Interim | ₹12.70 | ₹1.27 | FY24 |
| 20-10-2023 | Interim | ₹12.70 | ₹1.27 | FY24 |
| 21-07-2023 | Interim | ₹9.25 | ₹0.93 | FY24 |
| 16-06-2023 | Final | ₹4.00 | ₹0.40 | FY23 |
| 31-03-2023 | Interim | ₹9.60 | ₹0.96 | FY23 |
| 24-01-2023 | Interim | ₹9.60 | ₹0.96 | FY23 |
| 20-10-2022 | Interim | ₹9.00 | ₹0.90 | FY23 |
Source: TipRanks dividend history, ICICI Direct and JM Financial corporate action feeds, company exchange filings. Split adjustment (÷10) applied by ShareBazaar Online to all pre-26-February-2026 records. Angel One has declared 20 dividends since listing in October 2020 (Trendlyne, March 2026); the table shows the most recent twelve.
Full-year dividend trend (split-adjusted)
| FY | DPS | YoY |
|---|---|---|
| FY23 | ₹2.82 | — |
| FY24 | ₹3.87 | +37.2% |
| FY25 | ₹4.80 | +24.0% |
| FY26 | ₹4.05 | -15.6% |
FY totals assembled from ex-date records above. FY26 excludes any final dividend that may yet be declared for that year.
Classification: Consistent Payer with Cyclical Amounts
- Consistency: Strong. Angel One has paid a dividend in every financial year since listing — 20 declarations since November 2020. No suspensions.
- Growth trend: Broken. Three years of growth (FY23 → FY25) ended with a 15.6% cut in FY26, the first annual decline in the company's listed history.
- Special dividends: None declared. All payouts have been interim or final.
- Dividend cuts: One — FY26, tracking a 21.9% fall in profit.
- Suspensions: None.
The pattern that actually matters
Angel One's dividend moves with its profit, not against it. FY26 profit fell 21.9% and the dividend fell 15.6% — the board cushioned the drop slightly but did not defend the payout at all costs. Retail investors sometimes assume a listed broker's dividend is a fixed income stream. Angel One's own record says the opposite: the payout is a share of whatever the market cycle delivers that year. In a strong bull market you get more; in a weak derivatives year you get less.
Financial Performance Analysis
Consolidated Profit & Loss (₹ Crore)
| Particulars | FY24 | FY25 | FY26 | FY26 YoY |
|---|---|---|---|---|
| Revenue | 4,272 | 5,239 | 5,138 | -1.9% |
| Operating Profit | 1,693 | 1,983 | 1,820 | -8.2% |
| Operating Margin | 40% | 38% | 35% | -300 bps |
| Finance Cost | 137 | 296 | 438 | +48.0% |
| Depreciation | 50 | 103 | 125 | +21.4% |
| Profit Before Tax | 1,514 | 1,592 | 1,272 | -20.1% |
| Net Profit (PAT) | 1,126 | 1,172 | 915 | -21.9% |
| EPS (₹, split-adjusted) | 13.40 | 12.98 | 10.05 | -22.6% |
Source: Screener.in consolidated financials for Angel One Ltd, accessed 20 July 2026.
Operating leverage analysis — the reverse gear
FY26 is a textbook case of negative operating leverage. Revenue slipped only 1.9%, but profit fell 21.9% — an 11-times amplification. Here is exactly where the money went, in rupees:
- Margin compression: ₹163 crore hit. Operating margin fell from 38% to 35% as expenses rose from ₹3,256 crore to ₹3,318 crore (+1.9%) while revenue fell. Costs did not shrink with revenue because a broker's technology, compliance and people costs are largely fixed.
- Finance cost: ₹142 crore hit. Interest expense jumped from ₹296 crore to ₹438 crore, up 48%. This is the single largest drag and it is a direct consequence of the borrowing programme discussed in the balance sheet section below.
- Depreciation: ₹22 crore hit. Up 21.4% to ₹125 crore, reflecting the heavy technology and platform capex of the previous two years now flowing through the P&L.
- Higher tax rate: roughly ₹25 crore hit. The effective tax rate rose from 26% to 28%.
Put simply: Angel One earned almost the same revenue as last year, but interest and fixed costs ate a fifth of the profit. This is the mechanism that made the FY26 dividend cut necessary.
Five-year growth record
The deceleration is stark. A business compounding profit at 25% over five years has compounded at just 1% over three years. The growth story is in the rear-view mirror; the last three years have been flat.
Return ratios
ROCE has collapsed from a 44% peak in FY23 to 14.8% in FY26 — a two-thirds reduction in three years. The equity base grew (helped by a capital raise reflected in the FY25 reserves jump from ₹2,955 crore to ₹5,531 crore) while profits shrank. More capital, less return.
The most recent quarter (declared after this dividend)
Q1 FY27 (quarter ended June 2026), reported on 15 July 2026: revenue ₹1,430 crore, PAT ₹231 crore. Against the weak base of Q1 FY26 (PAT ₹114 crore), that is roughly a doubling year-on-year. But sequentially it is a 27.7% fall from the ₹320 crore posted in Q4 FY26, and the operating margin slipped from 41% to 34%. The recovery is real but uneven. Angel One's client base grew to 38.6 million users. (Source: Angel One press release and investor presentation, 15 July 2026; Screener.in quarterly data.)
Cash Flow Analysis
Consolidated Cash Flow (₹ Crore)
| Particulars | FY23 | FY24 | FY25 | FY26 |
|---|---|---|---|---|
| Net Profit | 890 | 1,126 | 1,172 | 915 |
| Operating Cash Flow | 804 | -330 | -1,860 | -4,142 |
| Investing Cash Flow | -185 | -91 | -341 | -111 |
| Financing Cash Flow | -908 | 1,331 | 1,917 | 3,656 |
| Free Cash Flow | 704 | -537 | -2,023 | -4,222 |
| OCF ÷ Operating Profit | 84% | 3% | -73% | -209% |
Source: Screener.in consolidated cash flow statement, accessed 20 July 2026.
Reported profit is an opinion. Cash is a fact.
Angel One reported a profit of ₹915 crore in FY26. In the same year, operating activities consumed ₹4,142 crore of cash. The gap between the two is ₹5,057 crore. That is not a rounding difference — it is the single most important number in this entire report, and almost no dividend coverage of this announcement mentioned it.
Operating cash flow has now been negative for three consecutive years and the deficit is widening each year: -₹330 crore, then -₹1,860 crore, then -₹4,142 crore. The OCF-to-operating-profit conversion ratio has fallen from a healthy 84% in FY23 to -209%.
The fair reading — this is not straightforward accounting fraud
Angel One is a broker with a lending arm. When it extends margin trading facility (MTF) loans to clients, that cash outflow is classified as an operating activity under Ind AS for financial services companies, while the borrowings funding it are classified as financing. So a rapidly growing client-funding book mechanically produces deeply negative operating cash flow even in a perfectly healthy business. The pattern here mirrors an NBFC, not a manufacturer.
The evidence supports this reading: financing inflows of ₹3,656 crore in FY26 almost exactly offset the operating outflow, and borrowings rose by ₹4,537 crore. The company is borrowing to lend, and earning a spread on that lending. That is the business model, not a crisis.
But the dividend question does not go away
Whatever the accounting classification, one fact remains: in FY26 Angel One did not generate surplus cash. It generated a cash deficit and filled it by borrowing ₹4,537 crore. Against that backdrop it also paid out roughly ₹370 crore in dividends across the two interim payouts.
Funding source verdict: The dividend was funded from accounting earnings and the balance sheet, not from free cash flow. With FCF at -₹4,222 crore, the FCF coverage of the ₹160 crore second interim dividend is negative — 0.00 times. Every rupee of dividend paid in FY26 was, at the margin, a rupee that either stayed off the lending book or was replaced by borrowed money. Retail investors should understand that distinction clearly: this dividend was earnings-backed, not cash-backed.
Receivables versus revenue
Debtor days rose from 21 days in FY25 to 31 days in FY26 — a 48% increase — while revenue fell 1.9%. Receivables growing faster than revenue is a mild negative signal: collections are slowing slightly. In absolute terms 31 days is still comfortable for a broker, and well below the 42–45 day levels of FY23–FY24. This is a watch item, not an alarm.
Cash and investments
The Investments line on the consolidated balance sheet stood at ₹257 crore at March 2026, up from ₹202 crore. A broker's own cash cannot be cleanly separated from client funds in summary data, so a reliable standalone free-cash figure is Not Disclosed by Company in the dividend filing. Cash coverage of the ₹160 crore payout cannot be computed with confidence from public summary data and is therefore reported as Not Disclosed by Company.
Balance Sheet Strength
Consolidated Balance Sheet (₹ Crore)
| Particulars | FY24 | FY25 | FY26 | FY26 YoY |
|---|---|---|---|---|
| Equity Capital | 84 | 90 | 91 | +1.1% |
| Reserves | 2,955 | 5,531 | 6,027 | +9.0% |
| Net Worth | 3,039 | 5,621 | 6,118 | +8.8% |
| Borrowings | 2,541 | 3,414 | 7,951 | +132.9% |
| Other Liabilities | 7,674 | 7,853 | 9,835 | +25.2% |
| Total Assets | 13,254 | 16,889 | 23,904 | +41.5% |
| Debt / Equity | 0.84x | 0.61x | 1.30x | +0.69x |
Source: Screener.in consolidated balance sheet. Net worth and debt/equity computed by ShareBazaar Online.
The borrowing story is the FY26 story
Borrowings more than doubled in a single year — from ₹3,414 crore to ₹7,951 crore, an increase of ₹4,537 crore or 133%. Debt-to-equity moved from a conservative 0.61x to 1.30x. Angel One now carries ₹1.30 of debt for every ₹1.00 of shareholder equity, more than double the previous year's leverage.
The consequence showed up immediately in the P&L: finance costs rose 48% to ₹438 crore, which alone accounts for over half of the ₹257 crore decline in net profit. Leverage that funds a profitable lending book is a legitimate strategy. Leverage that rises 133% while profit falls 22% deserves scrutiny.
What supports the balance sheet
- Net worth grew 8.8% to ₹6,118 crore despite the profit decline — reserves are still building.
- Book value per share of ₹67.20 against a market price of ₹328.95 implies a price-to-book of about 4.9x.
- Total assets grew 41.5%, indicating the lending and client book is expanding, not contracting.
- The company retains active credit ratings from ICRA, CARE and CRISIL, with updates published as recently as July 2026.
What pressures it
- Debt/equity doubled to 1.30x in twelve months.
- Interest cost of ₹438 crore now consumes 24% of operating profit, versus 15% in FY25 and 8% in FY24.
- Net debt position: borrowings of ₹7,951 crore against disclosed Investments of ₹257 crore. A precise net debt figure requires the full annual report cash breakdown — Not Disclosed by Company in the dividend filing.
- Working capital days at -592 reflect the negative-working-capital nature of broking, which is structurally favourable but hides how dependent the model is on continuous funding access.
Dividend Sustainability Analysis
Computed coverage metrics — all figures calculated, not quoted
| Metric | Calculation | Result |
|---|---|---|
| This dividend outflow | ₹1.75 × 91.3 crore shares | ₹160 Cr |
| FY26 total dividend outflow | ₹4.05 × 91.3 crore shares | ₹370 Cr |
| Dividend Payout Ratio FY26 | ₹370 Cr ÷ ₹915 Cr PAT | 40.4% |
| Payout Ratio FY25 (comparison) | ₹4.80 ÷ ₹12.98 EPS | 37.0% |
| Dividend Coverage (this payout) | ₹10.05 EPS ÷ ₹1.75 DPS | 5.74x |
| Dividend Coverage (full FY26) | ₹10.05 EPS ÷ ₹4.05 DPS | 2.48x |
| FCF Coverage | -₹4,222 Cr FCF ÷ ₹160 Cr | Negative (0.00x) |
| Cash Coverage | Free cash not separable | Not Disclosed by Company |
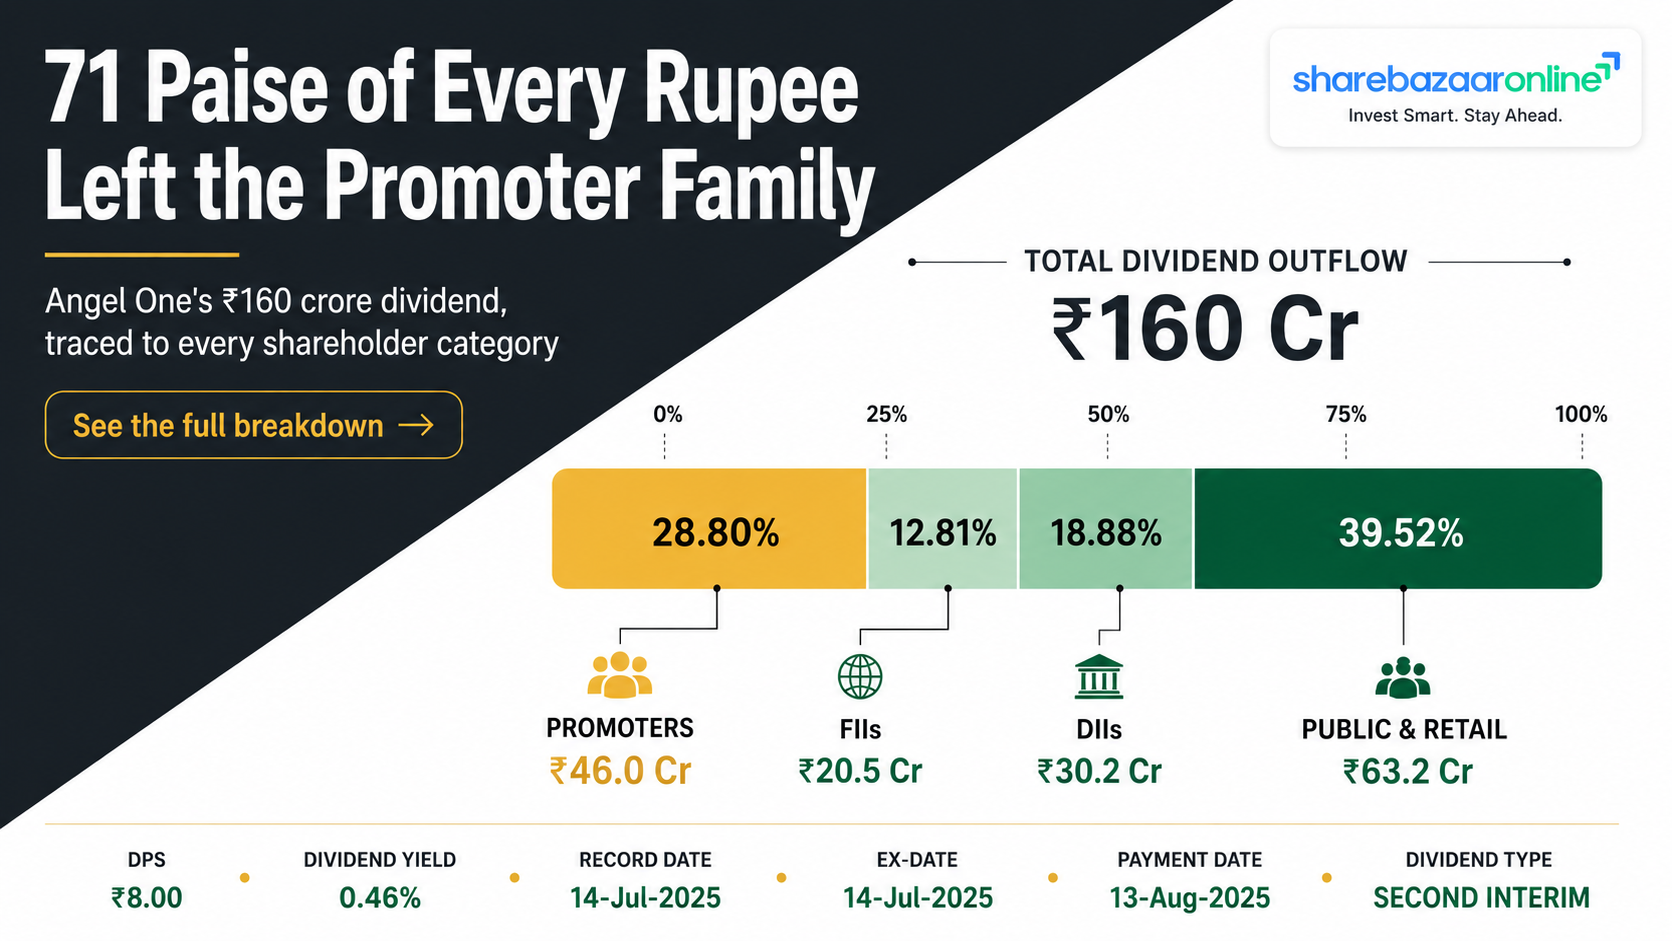
| Promoter Dividend Income | 28.80% × ₹160 Cr | ₹46.0 Cr |
Correcting a widely circulated error: the "246% payout ratio"
Screening platforms currently display Angel One's FY26 dividend payout ratio as 246%, and one popular site lists a "healthy dividend payout of 103%" among the company's positives. Both figures are artefacts of the February 2026 stock split. They divide dividends declared partly at ₹10 face value (₹23 + ₹1.75 = ₹24.75) by an EPS restated at ₹1 face value (₹10.05). That is a like-for-unlike comparison.
The correct FY26 payout ratio is 40.4%, computed on split-adjusted dividends of ₹4.05 against split-adjusted EPS of ₹10.05. That is a normal, conservative payout — up modestly from 37.0% in FY25, which is exactly what you would expect when profit falls faster than the dividend.
Sustainability verdict: MODERATELY SUSTAINABLE
Supporting the dividend
- Earnings cover the full-year dividend 2.48 times — comfortable headroom.
- Payout ratio of 40.4% is well within prudent limits.
- Unbroken payment record across 20 dividends since 2020.
- Net worth still growing (+8.8% in FY26) despite the profit dip.
- The board demonstrated willingness to cut the dividend 15.6% rather than over-distribute — a sign of discipline, not weakness.
- Q1 FY27 PAT of ₹231 crore doubled year-on-year, and a fresh ₹1.00 dividend was declared in July 2026.
Pressuring the dividend
- Free cash flow of -₹4,222 crore means zero FCF coverage.
- Three consecutive years of negative operating cash flow, widening each year.
- Debt up 133% while dividends were being paid.
- Finance cost up 48%, absorbing 24% of operating profit.
- Profit down 21.9%; three-year profit CAGR of just 1%.
- ROCE collapsed from 44% to 14.8% in three years.
- Revenue is cyclical and derivatives-dependent, exposed to SEBI regulation.
Why "moderately" and not "sustainable": On an earnings basis this dividend is very comfortably covered and the company has clear capacity to keep paying. On a cash basis it is not covered at all, and the company is simultaneously doubling its debt. Both statements are true. The dividend is sustainable as long as the broking cycle stays reasonably supportive and funding access remains cheap. If either changes, this is a payout that flexes downward — as FY26 already demonstrated.
Peer Comparison
Broking and capital markets peers
| Company | Div. Yield | Payout | ROE | Promoter |
|---|---|---|---|---|
| Angel One | 1.23% | 40.4% | 15.6% | 28.59% |
| Nuvama Wealth | ~3.06% | ~49% | Not verified | Not verified |
| Motilal Oswal Financial | ~1.16% | ~11.9% | Not verified | 67.5% |
| Geojit Financial | Not verified | ~25.1% | Not verified | 38.5% |
| Capital Markets industry avg. | ~1.10% | — | — | — |
| Indian market top quartile | ~1.30% | — | — | — |
Sources: Angel One figures computed by ShareBazaar Online from Screener.in data. Nuvama yield and payout per Simply Wall St. Motilal Oswal yield per INDmoney (January 2026 dividend); Motilal Oswal and Geojit payout and promoter holding per Equitymaster comparison data. Industry and market averages per Simply Wall St Capital Markets industry benchmarks. Peer figures are drawn from different reporting dates and are directional only. Fields we could not verify to a primary or reputable secondary source are marked "Not verified" rather than estimated.
Where Angel One stands out
- Middle of the pack on yield. At 1.23%, Angel One yields slightly above the industry average of ~1.1% and close to Motilal Oswal, but well below Nuvama's ~3.06%.
- Higher payout than Motilal Oswal. Angel One's 40.4% payout is more than triple Motilal Oswal's ~11.9%, meaning Angel One returns a much larger share of profits to shareholders rather than retaining them.
- Lowest promoter holding in the peer set. At 28.59%, Angel One's promoters hold less than half of Motilal Oswal's 67.5%. This has a direct bearing on who captures the dividend — see the next section.
Sector context for FY26
FY26 was a difficult year across Indian broking. Industry commentary points to three shared pressures: regulatory friction in the futures-and-options segment around charges and participation frameworks, heightened P&L volatility from treasury and investment books during market corrections, and a growing market preference for annuity-style revenue over transaction-driven models. Motilal Oswal, for context, reported a net loss of ₹221 crore in Q4 FY26. Angel One's 21.9% profit decline, while poor, occurred in a sector where at least one large peer swung to a loss.
Promoter Impact Analysis
Shareholding pattern and dividend distribution
| Category | Mar 2025 | Mar 2026 | Jun 2026 | Share of ₹160 Cr |
|---|---|---|---|---|
| Promoters | 35.55% | 28.80% | 28.59% | ₹46.0 Cr |
| FIIs | 13.05% | 12.81% | 13.76% | ₹20.5 Cr |
| DIIs | 14.27% | 18.88% | 20.34% | ₹30.2 Cr |
| Public & Retail | 37.12% | 39.52% | 37.30% | ₹63.2 Cr |
| No. of shareholders | 4,02,193 | 3,59,235 | 3,56,468 | — |
Shareholding source: Screener.in quarterly shareholding pattern. Rupee allocations computed by ShareBazaar Online by applying March 2026 holdings (the quarter containing the record date) to the estimated ₹160 crore outflow.
Promoter benefit
At 28.80% holding, Angel One's promoter group received an estimated ₹46.0 crore from this single interim dividend, and roughly ₹107 crore from the full FY26 payout of ₹370 crore. In percentage terms the promoters captured under 29 paise of every rupee distributed.
Minority shareholder benefit — and why this payout is unusually retail-friendly
More than 71% of this dividend went to non-promoter shareholders — approximately ₹114 crore across institutions and the public. Public and retail shareholders alone took an estimated ₹63.2 crore, more than the promoter group.
This is materially different from the typical Indian mid-cap dividend, where a 50–70% promoter holding means most of the cash flows back to the founding family. Compare Motilal Oswal at 67.5% promoter holding: a rupee of dividend there sends about 68 paise to promoters. Angel One sends 29 paise. On distribution fairness, Angel One's structure genuinely favours minority holders.
The trend behind the number
Promoter holding has fallen from 44.55% in March 2021 to 28.59% in June 2026 — a decline of nearly 16 percentage points in five years, including a sharp drop from 35.55% to 28.97% during the June 2025 quarter. Screening platforms flag this as the company's principal negative.
The offsetting signal is who bought. DII holding rose from 14.27% to 20.34% over the same period — domestic mutual funds and insurers have been steadily accumulating what promoters sold. FII holding, at 13.76%, is roughly flat. Falling promoter stake is worth monitoring; falling promoter stake with rising institutional stake is a different picture from a promoter exit into retail hands.
One further note: the number of shareholders fell from 4.02 lakh in March 2025 to 3.56 lakh in June 2026, an 11% reduction, even as the stock rose 43% in six months. Retail participation in the shareholder register is thinning, not broadening.
Taxation Analysis
How dividends are taxed in India
Since April 2020, India follows a classical dividend tax system. The company no longer pays Dividend Distribution Tax. Instead, the dividend is added to your total income under the head "Income from Other Sources" and taxed at your applicable income tax slab rate.
This means the same ₹1.75 per share is worth different amounts to different investors. Someone in the 5% slab keeps far more of it than someone in the 30% slab. Dividend income is not taxed at a flat concessional rate the way long-term capital gains are.
TDS rules
- TDS under Section 194 applies at 10% for resident individuals.
- The threshold was raised in Budget 2025: no TDS unless total dividend from a single company in a financial year exceeds ₹10,000 (previously ₹5,000).
- If your PAN is not linked or updated, TDS is deducted at 20%.
- You can file Form 15G (under 60) or Form 15H (60 and above) to avoid TDS if your total income is below the taxable limit.
- TDS is not the final tax. It is a credit against your total liability, adjusted when you file your return.
- Non-resident shareholders face TDS at 20% plus surcharge and cess, subject to relief under an applicable tax treaty.
What this meant for Angel One holders
At ₹1.75 per share, you needed to hold more than 5,714 shares of Angel One for this single dividend to cross the ₹10,000 TDS threshold. At the March 2026 price of ₹230.20, that is an investment of roughly ₹13.15 lakh.
The overwhelming majority of retail holders would have received the full ₹1.75 per share into their bank account with no TDS deducted — and would still owe tax on it at their slab rate when filing their return. This is a common and expensive misunderstanding: no TDS does not mean no tax.
Worked example A — standard illustration (₹10 per share)
| Particulars | Amount |
|---|---|
| Shares held | 1,000 |
| Dividend per share | ₹10.00 |
| Gross Dividend | ₹10,000 |
| TDS deducted (does not exceed ₹10,000 threshold) | ₹0 |
| Amount credited to bank | ₹10,000 |
| Tax at 30% slab | ₹3,000 |
| Health & Education Cess at 4% | ₹120 |
| Total Tax Payable | ₹3,120 |
| Net Dividend After Tax | ₹6,880 |
Effective tax rate: 31.2%. The investor keeps 68.8% of the headline dividend. If the gross yield on this holding were 2.00%, the effective post-tax yield is 1.38%. Surcharge would apply on top for incomes above ₹50 lakh, pushing the effective rate higher still.
Worked example B — actual Angel One dividend (₹1.75 per share)
| Particulars | 5% Slab | 20% Slab | 30% Slab |
|---|---|---|---|
| Shares held | 1,000 | 1,000 | 1,000 |
| Gross Dividend | ₹1,750 | ₹1,750 | ₹1,750 |
| TDS deducted | ₹0 | ₹0 | ₹0 |
| Tax + 4% cess | ₹91 | ₹364 | ₹546 |
| Net Dividend | ₹1,659 | ₹1,386 | ₹1,204 |
| Effective yield on ₹230.20 cost | 0.72% | 0.60% | 0.52% |
The headline 0.76% yield becomes an effective 0.52% for a top-slab investor after tax. Against a savings account paying 3% and a fixed deposit paying more, this dividend is not an income proposition on its own. It is a small cash return attached to an equity position whose primary return driver is the share price — which, in this case, rose 42.9% over the same four months.
Note: Tax rules described here reflect provisions applicable to Indian resident individual shareholders for FY 2026-27 as commonly understood at the time of writing. Slab rates, surcharge, cess and TDS thresholds change with each Union Budget. ShareBazaar Online is not a tax advisor. Please confirm your position with a qualified chartered accountant before filing.
Key Risks
1. Regulatory risk in derivatives
Angel One's revenue is heavily weighted toward futures and options broking. SEBI has repeatedly tightened this segment — through STT increases, true-to-label charge rules, and participation frameworks. Each intervention has directly reduced industry volumes. Revenue fell 1.9% in FY26 partly as a result. Further regulatory action on retail F&O participation would hit revenue faster than costs can be cut.
2. Leverage and funding cost risk
Borrowings rose 133% to ₹7,951 crore and debt/equity doubled to 1.30x in one year. Finance costs rose 48% to ₹438 crore. The margin funding model depends on borrowing cheaply and lending at a spread. Any tightening of bank funding norms for brokers, a credit rating downgrade, or a rise in wholesale rates would compress that spread directly.
3. Client credit risk on the margin book
A margin trading facility book funded by ₹7,951 crore of borrowings is lending against client securities. In a sharp market correction, collateral values fall exactly when client ability to meet margin calls weakens. Angel One does not separately disclose MTF book stress metrics in its dividend filings — Not Disclosed by Company. This is the most under-examined risk in the business.
4. Cyclicality and earnings volatility
Quarterly PAT over the last eight quarters has swung between ₹114 crore and ₹423 crore — a range of nearly 4x. Three-year profit CAGR is just 1% against a five-year figure of 25%. Broking earnings track market activity, and market activity is not stable. Any dividend built on these earnings inherits the same volatility.
5. Declining promoter stake
Promoter holding fell from 44.55% (March 2021) to 28.59% (June 2026), a 16-percentage-point decline. Screening platforms list this as the company's primary negative. While DII holding rose over the same period, a continued reduction would raise questions about promoter conviction and, at the extreme, about control stability.
6. Return ratio erosion
ROCE fell from 44% in FY23 to 14.8% in FY26; ROE from a 5-year average of 29% to 15.6%. The equity base grew materially in FY25 while profits did not follow. If incremental capital continues to earn mid-teens returns rather than the 25–40% of prior years, the valuation premium the stock carries at 4.9x book becomes harder to justify.
7. Competitive pressure from discount and neo-brokers
Angel One competes against Groww, Zerodha and other zero-or-low-brokerage platforms in a market where switching costs for retail clients are minimal. Client base growth (to 38.6 million users) has not translated proportionately into profit growth — revenue per client is under structural pressure across the industry.
8. Compliance and enforcement risk
In March 2026, Angel One settled SEBI proceedings relating to its association with algorithmic trading platforms offering assured returns, paying ₹1,00,000 under a settlement scheme. The company was one of 122 brokers examined and stated there was no material financial impact. The amount is trivial; the pattern of regulatory scrutiny across the sector is not.
What To Monitor
1. Operating cash flow direction in FY27
OCF has been negative for three years and worsening: -₹330 crore, -₹1,860 crore, -₹4,142 crore. The key question is whether FY27 shows the deficit stabilising or narrowing. If the MTF book growth slows and OCF turns less negative while profit holds, the cash-versus-earnings gap closes. If the deficit widens again toward ₹6,000 crore, the funding model is running faster than the profit engine.
2. Borrowings and debt/equity trajectory
Watch the half-yearly borrowings figure against the ₹7,951 crore March 2026 base. Debt/equity crossing 1.5x would be a meaningful escalation. Equally, watch finance cost as a share of operating profit — it has moved from 8% (FY24) to 15% (FY25) to 24% (FY26). Another jump toward 30% would materially cap profit recovery.
3. Operating margin recovery
OPM ran 40% (FY24), 38% (FY25), 35% (FY26). Quarterly it hit 41% in Q4 FY26 then fell back to 34% in Q1 FY27. A sustained return above 38% would signal costs are being brought back into line with revenue. Continued sub-35% margins would confirm that the cost base has permanently reset higher.
4. Revenue per client, not client count
Angel One's client base reached 38.6 million in June 2026, growing 19% year-on-year. But revenue fell 1.9% in FY26. The metric that matters is revenue divided by active client, and specifically the mix shift from F&O broking toward annuity streams like mutual fund distribution, wealth management and MTF interest income. Track this in the quarterly investor presentation.
5. Promoter holding at each quarterly disclosure
The stake moved 35.55% → 28.97% → 28.59% across recent quarters. Watch whether the June 2026 level of 28.59% stabilises or continues drifting down. Any move below 26% would be a distinct change in trend. Cross-check against DII holding — currently 20.34% and rising — to see who is absorbing the supply.
6. SEBI policy on retail derivatives participation
Any new SEBI consultation paper or circular affecting F&O lot sizes, expiry structures, margin requirements or retail eligibility is a direct revenue event for Angel One. Historically these have arrived with limited notice and immediate volume impact. Monitor SEBI board meeting outcomes and consultation papers, not just the company's own filings.
7. Credit rating actions
ICRA, CARE and CRISIL all rate Angel One, with updates published in July 2026, April 2026 and December 2025. With borrowings having doubled, rating rationale commentary is now the cheapest available third-party read on the company's funding health. Any outlook change from Stable would precede a change in funding cost.
8. FY27 dividend cadence versus FY26
FY27's first interim dividend was declared at ₹1.00 per share on 15 July 2026 — against ₹2.30 (split-adjusted) for the first interim of FY26. If subsequent FY27 payouts do not make up the gap, the full-year dividend will decline for a second consecutive year. Track the cumulative FY27 total against the ₹4.05 FY26 base.
Conclusion
Angel One's 2nd Interim Dividend of ₹1.75 per share for FY 2025-26 was a small, routine, earnings-covered payout that has already been recorded and paid. On its own terms it was unremarkable: a 0.76% yield at the announcement price, covered 5.74 times by earnings, and administratively approved by circular resolution rather than a full board meeting.
What makes it worth analysing is the context around it, which most coverage missed entirely.
Positives
- Unbroken dividend record — 20 declarations since 2020, no suspensions.
- Correct payout ratio of 40.4% is conservative; earnings cover the full-year dividend 2.48x.
- Over 71% of the payout went to non-promoter shareholders — unusually retail-friendly for an Indian mid-cap.
- Fast payment cycle: 22 days from record date, comfortably inside SEBI's 30-day limit.
- Net worth grew 8.8% to ₹6,118 crore even in a down year.
- DII holding rose to 20.34% — institutional absorption of promoter selling.
- Q1 FY27 PAT of ₹231 crore roughly doubled year-on-year, and a fresh dividend followed in July 2026.
- The board cut the dividend rather than over-distribute — capital discipline, not cosmetics.
Negatives
- Free cash flow of -₹4,222 crore — the dividend had zero FCF coverage.
- Operating cash flow negative for three straight years, deficit widening each year.
- Borrowings up 133% to ₹7,951 crore; debt/equity doubled to 1.30x.
- PAT down 21.9%; three-year profit CAGR of just 1%.
- First-ever full-year dividend cut: FY26 DPS down 15.6%.
- ROCE collapsed from 44% to 14.8% in three years.
- Promoter holding down 16 percentage points in five years.
- Post-tax effective yield of just 0.52% for a 30%-slab investor.
The honest summary
Angel One paid a dividend it could afford on paper, in a year when it generated no surplus cash and doubled its debt. Both facts are true at once, and neither one cancels the other. A significant part of the cash outflow is structural to a broker running a growing margin-lending book — that is a business model choice, not an accounting red flag. But it means this dividend was funded by earnings and balance-sheet capacity, not by cash the business threw off.
Investors treating Angel One as a dividend stock should recognise three things: the yield is modest (1.23% trailing), the post-tax yield is much lower, and the payout has already been cut once. Investors holding it for growth should note that the last three years delivered 1% profit CAGR and a two-thirds collapse in ROCE, even as the share price rose 43% in six months.
ShareBazaar Online does not issue buy, sell or hold recommendations. The numbers above are presented so you can reach your own conclusion.
Frequently Asked Questions
What dividend has Angel One announced for FY 2025-26?
What is the Angel One dividend yield?
What was the record date for the Angel One dividend?
What was the ex-date for this dividend?
When was the dividend paid?
Who was eligible to receive this dividend?
How is this dividend taxed in my hands?
Is the Angel One dividend sustainable?
What is Angel One's dividend history?
What should investors monitor going forward?
Why did Angel One's dividend fall from ₹23 to ₹1.75?
How much did this dividend cost Angel One in total?
How much of the dividend went to Angel One's promoters?
Did this dividend need AGM approval?
Has Angel One declared any dividend since this one?
Disclaimer
This article is published by ShareBazaar Online for informational and educational purposes only. It does not constitute investment advice, a research report under SEBI (Research Analysts) Regulations, 2014, or an offer or solicitation to buy or sell any security. ShareBazaar Online does not issue buy, sell or hold recommendations.
Dividend terms, record date, payment date, face value and company identifiers are reproduced from Angel One Limited's exchange intimation dated 20 March 2026, filed with NSE and BSE under Regulations 30 and 42 of SEBI (LODR) Regulations, 2015. Market prices, financial statements, cash flow data, shareholding patterns and peer information are sourced from Screener.in, NSE/BSE data as published by Goodreturns, INDmoney, Upstox, TipRanks, ICICI Direct, JM Financial, Simply Wall St and Equitymaster, accessed on 20 July 2026. All yields, payout ratios, coverage ratios, outflow estimates and promoter income figures are computed by ShareBazaar Online and are clearly identified as such. Where information was not available in the company's disclosure, we have written "Not Disclosed by Company" rather than estimating.
Share prices, financial data and shareholding patterns change continuously and figures quoted here may be out of date by the time you read them. Taxation commentary reflects our understanding of provisions applicable to resident individual shareholders and is not tax advice; rules change with each Union Budget. Past dividend payments are not a guarantee of future payments.
Investments in securities markets are subject to market risks. Read all related documents carefully before investing. Please consult a SEBI-registered investment adviser and a qualified chartered accountant before making any investment or tax decision. ShareBazaar Online, its authors and its affiliates accept no liability for any loss arising from the use of this information.