
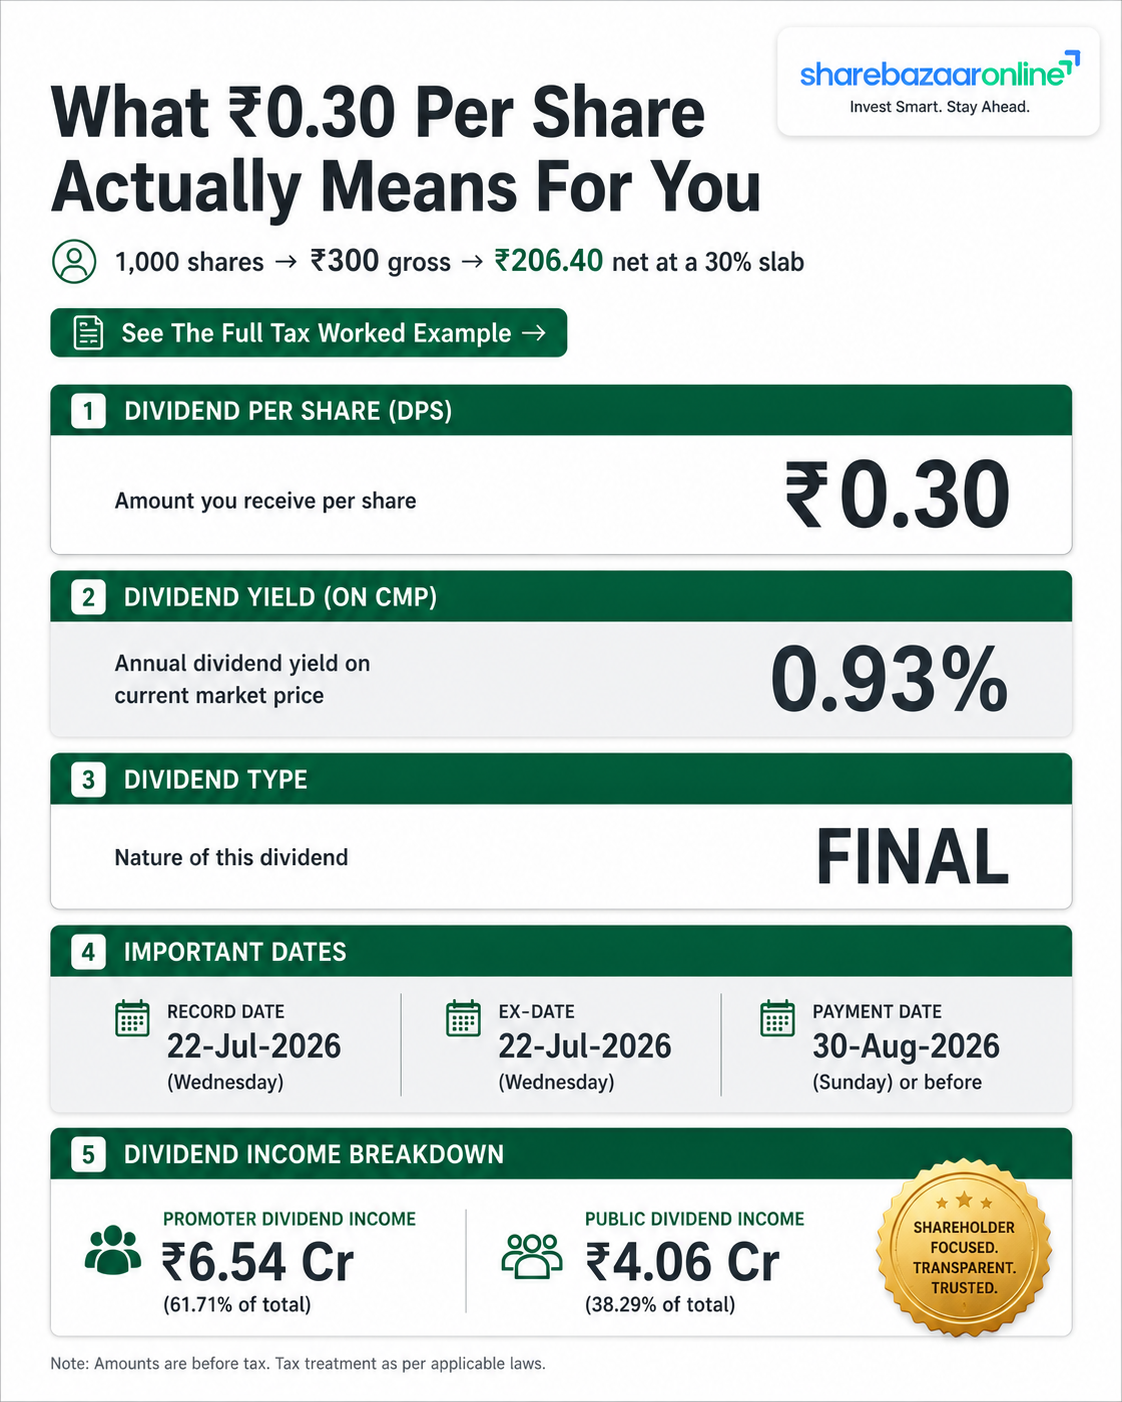
Dividend Status Banner
Laxmi Organic Industries Final Dividend 2026: ₹0.30 Per Share, Record Date 21 July 2026
Laxmi Organic Industries Limited (NSE: LXCHEM | BSE: 543277) has fixed Tuesday, 21 July 2026 as the record date for its final dividend for FY 2025-26. The Board has recommended ₹0.30 per equity share on a face value of ₹2 — a payout of 15% of face value.
The number that matters more than the dividend itself: this is 40% lower than the ₹0.50 per share paid for FY 2024-25, and the third different dividend amount in three years. At the current market price of roughly ₹158.66, the dividend yield works out to just 0.19% — meaning ₹1 lakh invested in LXCHEM today earns approximately ₹189 in dividend income before tax.
Important note on the source document: The exchange filing dated 21 May 2026 that intimates this record date does not disclose the dividend amount, dividend percentage, payment date or outflow. Those figures come from the company's separate board-meeting outcome and 37th AGM notice, and are cited accordingly throughout this analysis.
Dividend Snapshot
Company Identity
Dividend Particulars
Capital & Outflow
Coverage Ratios
Dividend Announcement Summary
What The Board Actually Decided
At its board meeting on 21 May 2026, the Board of Laxmi Organic Industries approved the audited standalone and consolidated financial statements for FY 2025-26 with an unmodified auditor's opinion, and recommended a final dividend of ₹0.30 per equity share.
The word "recommended" matters. Under the Companies Act, 2013, a final dividend is only a proposal until shareholders approve it. Nothing is payable until the 37th Annual General Meeting on 5 August 2026, to be held via video conferencing, formally declares it. The record-date filing itself is explicit on this point — it says the dividend is payable "if declared" at the forthcoming AGM.
Separately, the same board meeting appointed Mr. Amit Jain as Chief Financial Officer effective 16 June 2026, taking over from Executive Director Mr. Harshvardhan Goenka who had been holding interim CFO charge. A CFO transition in the same meeting that cuts the dividend by 40% is a combination worth noting.
What The Uploaded Filing Discloses
- ✓Record date fixed as Tuesday, 21 July 2026
- ✓Purpose: final dividend for FY 2025-26
- ✓Filed under Regulation 42 of SEBI LODR, 2015
- ✓37th AGM scheduled for 5 August 2026
- ✓Signed by Aniket Hirpara, Company Secretary
What The Filing Does NOT Disclose
- ✕Dividend per share — Not Disclosed by Company
- ✕Dividend percentage — Not Disclosed by Company
- ✕Payment date — Not Disclosed by Company
- ✕Total dividend outflow — Not Disclosed by Company
- ✕Management commentary — Not Disclosed by Company
Key Dates Timeline
| Event | Date | What It Means For You |
|---|---|---|
| Board Meeting / Announcement | 21-05-2026 | Board recommended ₹0.30 final dividend |
| Record Date Intimation | 21-05-2026 | Regulation 42 filing to BSE and NSE |
| Ex-Dividend Date | 21-07-2026 | Buy before this day to qualify |
| Record Date | 21-07-2026 | Register of members frozen for eligibility |
| 37th AGM (Declaration) | 05-08-2026 | Shareholders vote; dividend becomes legally payable |
| Payment Date | On or after 10-08-2026 | Credit to bank account linked to demat |
Why Ex-Date and Record Date Are The Same Day
Indian equity markets settle on a T+1 basis — a trade placed today is settled tomorrow. Because of this, the ex-date and record date now fall on the same calendar day for most Indian corporate actions. In practice this means you needed to have bought the share on or before 20 July 2026 (the previous trading day) so that it settled into your demat account by 21 July. Buying on 21 July itself does not qualify you.
A Note On The Payment Date
The company's AGM notice indicates payment on or after 10 August 2026. Some third-party data vendors are separately displaying 4 September 2026. Under Section 127 of the Companies Act, the company must pay within 30 days of declaration, i.e. by 4 September 2026 — which explains the second date as an outer limit rather than a scheduled credit. Treat 10 August as the earliest and 4 September as the statutory deadline.
Dividend Yield Analysis
The Arithmetic
Dividend yield tells you what percentage of your invested money comes back to you as cash each year. The formula is simple: dividend per share divided by the share price, multiplied by 100.
Yield On Announcement Date
₹0.30 ÷ ≈₹159.00 × 100
0.19%
LXCHEM closed at ₹151.85 on 22 May 2026, down 4.50% that session, implying a 21 May close of approximately ₹159.
Yield At Current Market Price
₹0.30 ÷ ₹158.66 × 100
0.19%
Based on last reported close of ₹158.66; the stock traded around ₹155 in early July 2026.
Yield Reality Check — Why This Number Is So Low
A high dividend yield can be flattering for the wrong reasons, and a low one can be misleading in the other direction. Here is what is actually driving LXCHEM's 0.19%:
Reason 1: The dividend was cut, not the price rallied
The share price has fallen — LXCHEM's 52-week range is ₹107.60 to ₹241.00 and the stock is well below its highs. Normally a falling price raises yield. Here, yield still fell because the dividend was cut harder than the price. That is the more negative of the two possible explanations.
Reason 2: Weak business performance
Consolidated PAT fell 30.08% in FY26 to ₹79.36 Cr from ₹113.50 Cr. A smaller profit pool naturally supports a smaller dividend.
Reason 3: The stock is expensive relative to earnings
At a P/E of roughly 54x, the market is paying a high multiple for depressed earnings. High P/E mechanically compresses dividend yield even when payout policy is unchanged.
Reason 4: This is a growth-capex company, not an income stock
With a payout ratio of only 10.48%, roughly 89.5% of profits are retained in the business. LXCHEM has never positioned itself as a yield stock — its highest-ever dividend, ₹0.70 in FY22, would still have yielded well under 1% at most price points.
Blunt take: At 0.19%, a savings bank account pays roughly 15 to 20 times more. Nobody should be buying LXCHEM for the dividend. The dividend is a signal about management's confidence, not a source of income.
Dividend History Analysis
Six Years Of Dividends Since Listing
Laxmi Organic listed on the exchanges in March 2021, so its public dividend record spans six payouts. It is a short history — but it is long enough to show a pattern.
| Financial Year | Dividend/Share | % of FV | Ex-Date | Payment Date | YoY Change |
|---|---|---|---|---|---|
| FY 2025-26 | ₹0.30 | 15% | 21-07-2026 | On/after 10-08-2026 | −40.0% |
| FY 2024-25 | ₹0.50 | 25% | 18-07-2025 | 30-08-2025 | −16.7% |
| FY 2023-24 | ₹0.60 | 30% | 19-07-2024 | 29-08-2024 | +20.0% |
| FY 2022-23 | ₹0.50 | 25% | 21-07-2023 | 02-09-2023 | −28.6% |
| FY 2021-22 | ₹0.70 | 35% | 18-07-2022 | 28-08-2022 | +40.0% |
| FY 2020-21 | ₹0.50 | 25% | 14-07-2021 | 25-08-2021 | First post-IPO |
Dividend history compiled from exchange corporate-action records. FY 2020-21 to FY 2024-25 amounts per TipRanks dividend history; FY 2025-26 per company board outcome dated 21 May 2026.
Classification: Irregular Payer
Across six payouts the sequence reads ₹0.50 → ₹0.70 → ₹0.50 → ₹0.60 → ₹0.50 → ₹0.30. That is three cuts and two increases in five transitions. There is no progressive dividend policy here, no stated minimum payout, and no visible smoothing.
The compound annual change from ₹0.50 in FY21 to ₹0.30 in FY26 is approximately −9.7% per year. Investors who bought the FY24 increase to ₹0.60 as evidence of a rising dividend have since seen it fall by 50% over two years.
What The Pattern Tells You
- •No suspensions: The company has paid a dividend every single year since listing, including through the FY26 earnings collapse. Continuity has been maintained.
- •No special dividends: Every payout has been an annual final dividend. There have been no interim or special dividends, which makes the record easier to read.
- •Dividend tracks profit, not policy: The dividend moves broadly with earnings. In FY26 PAT fell 30% and the dividend fell 40% — management appears to size the dividend after the fact rather than to a target.
- •Lowest payout since listing: ₹0.30 is the smallest dividend LXCHEM has declared as a listed company.
Financial Performance Analysis
FY 2025-26 Consolidated Results
| Particulars (₹ Cr) | FY 2025-26 | FY 2024-25 | Change |
|---|---|---|---|
| Revenue from Operations | 2,846.67 | 2,985.44 | −4.65% |
| Profit After Tax (Consolidated) | 79.36 | 113.50 | −30.08% |
| Profit After Tax (Standalone) | 79.26 | 118.02 | −32.84% |
| Standalone Revenue | 2,808.53 | Not Disclosed by Company | — |
| EPS (Consolidated) | 2.86 | 4.10 | −30.24% |
| Net Profit Margin | 2.79% | 3.80% | −101 bps |
FY26 consolidated revenue ₹28,466.67 Mn and PAT ₹793.62 Mn; standalone revenue ₹28,085.32 Mn and PAT ₹792.58 Mn. FY25 comparatives per company Q4 FY25 disclosure.
Operating Leverage Analysis — Where The Money Went
Operating leverage describes how profits respond to changes in sales. Healthy operating leverage means profits grow faster than revenue. LXCHEM shows the opposite — and severely so.
Revenue vs Profit Divergence
Revenue fell modestly. Profit fell six and a half times as fast. That gap of 25.43 percentage points is where the entire FY26 story sits.
The Q4 Picture Is Different
Q4 revenue rose 3.61% YoY and 9% sequentially. PBT more than doubled off a weak base. But PAT still edged down 0.97% to ₹21.55 Cr — the tax line absorbed the pre-tax recovery.
Identified Causes Of Margin Compression
1. Commodity spread volatility — acetic acid and ethyl acetate
Management flagged pronounced swings in acetic acid and ethyl acetate spreads. LXCHEM's acetyl intermediates business converts acetic acid into ethyl acetate; the profit is the spread between the two, not the absolute price. When input prices rise faster than output prices, the spread compresses regardless of volume.
2. Freight surcharges — logistics costs doubled
Management disclosed a sharp rise in freight surcharges that has doubled logistics costs, creating a near-term margin drag. For an export-exposed chemicals business, freight is a direct hit to realisation that cannot be quickly passed through.
3. Pricing pressure and raw material volatility
The company's own AGM disclosure attributes the FY26 profitability decline to pricing pressure and raw material volatility. This is the industry-wide condition afflicting Indian commodity-linked chemicals through the cycle.
4. Interest cost from new borrowing
Interest coverage collapsed from 9.47x to 4.20x. The company drew a ₹500 Cr term loan from HDFC Bank for capacity expansion, and the resulting interest expense flows straight through the P&L while the associated capacity is not yet earning.
Return Ratios — The Uncomfortable Numbers
ROE (Latest)
4.33%
ROCE (Latest)
4.43%
ROE (Hist. Avg)
8.76%
ROCE 3-Yr Avg
9.7%
ROE (return on equity) measures profit generated per rupee of shareholder capital. ROCE (return on capital employed) measures profit per rupee of total capital including debt. At 4.33% and 4.43%, LXCHEM is currently generating returns below its own cost of capital — which in plain terms means the business, at present, is destroying value on incremental capital rather than creating it. Quality chemical manufacturers are typically expected to deliver 15%+ ROE.
Five-year EBIT growth has been running at approximately −22.58% annually, and five-year sales growth at 9.99%. Growing the top line while shrinking operating profit is the clearest possible signal that the capex cycle has not yet converted into earnings.
Cash Flow Analysis
⚠ The Single Most Important Finding In This Report
Reported profit is an accounting opinion. Cash is a fact. And on a cash basis, LXCHEM's FY26 looks materially worse than its ₹79.36 Cr profit suggests.
Free cash flow of −₹373 Cr against a reported profit of +₹79.36 Cr is a gap of roughly ₹452 Cr. The company is generating accounting profit while consuming cash at scale.
Is This Alarming Or Explainable?
Both, and the distinction matters.
Explainable: Negative free cash flow driven by growth capex is very different from negative free cash flow driven by operations bleeding money. LXCHEM is mid-way through a large expansion — the Dahej Phase 2 facility was charging in Q1 FY27 and a new ethyl acetate line has started. Capex of this scale legitimately produces negative FCF for several years before the assets earn.
Alarming: The capex is now being funded with debt, not internal accruals. The ₹500 Cr HDFC term loan is the proof. And the company is paying a dividend out of a balance sheet that is simultaneously levering up.
How Is This Dividend Actually Funded?
Money is fungible, so the honest answer requires ranking sources:
Current Earnings
₹79.36 Cr PAT comfortably exceeds ₹8.31 Cr outflow — technically covered 9.5x
Cash Reserves
₹95.52 Cr covers the dividend 11.5x
Free Cash Flow
Negative — FCF cannot fund any part of this dividend
Borrowings
Indirectly — debt funds capex, freeing cash that funds the dividend
Asset Sales
Not Disclosed by Company
The Perspective That Keeps This Honest
The dividend outflow of ₹8.31 Cr is genuinely small. It is 0.29% of FY26 revenue and about 1.7% of the ₹500 Cr term loan drawn. Cancelling the dividend entirely would not meaningfully change the company's funding position or deleveraging path.
So the accurate framing is not "this dividend is dangerous." It is: this dividend is immaterial to the company's finances, which is precisely why the decision to cut it by 40% is informative. A board that felt confident about FY27 could have maintained ₹0.50 for ₹5.5 Cr more. It chose not to. That choice is the signal — not the ₹8.31 Cr itself.
Detailed operating cash flow, receivables movement and working-capital breakdown for FY26: Not Disclosed by Company in the filings reviewed. Line-item cash flow figures will be available in the FY26 Annual Report cash flow statement.
Balance Sheet Strength
Leverage Has Doubled In One Year
| Metric | FY 2025-26 | FY 2024-25 | Direction |
|---|---|---|---|
| Debt-to-Equity Ratio | 0.27 | 0.13 | Worsened 2.1x |
| Interest Coverage Ratio | 4.20x | 9.47x | Worsened 56% |
| Total Debt / Equity (MRQ) | 27.34% | — | — |
| Total Cash | ₹95.52 Cr | — | — |
| New Term Loan (HDFC Bank) | ₹500.00 Cr | — | Capacity expansion |
| Promoter Pledge | Nil | Nil | Stable |
The Balanced Reading
A debt-to-equity of 0.27 is still conservative in absolute terms. Most Indian chemical manufacturers operate comfortably above this. The company is not over-leveraged.
What deserves attention is the rate of change. Leverage doubling in twelve months while earnings fall 30% is a combination that removes cushion quickly. Interest coverage of 4.20x means EBIT covers interest just over four times — still adequate, but half of last year's comfort.
Note also that 1,24,060 equity shares were issued under ESOP-2020 during FY26, taking paid-up capital marginally up from ₹55.405 Cr to ₹55.43 Cr. Dilution is negligible at roughly 0.045%.
Capital Allocation Analysis
With ₹8.31 Cr available for distribution, the board's realistic alternatives were:
- •Reduce debt: ₹8.31 Cr against ₹500 Cr of new term debt would retire 1.7% of it. Immaterial.
- •Increase capex: Dahej Phase 2 is already funded and charging. Additional ₹8 Cr would not accelerate it.
- •Buyback: At a P/E of ~54x with ROE at 4.33%, buying back stock would be poor capital allocation. Correctly avoided.
- •Retain cash: The most defensible alternative given negative FCF. The board split the difference — it retained 89.5% and paid out 10.48%.
Verdict: The capital allocation decision here is defensible. Paying a token dividend preserves the payment record at trivial cost while retaining nearly all earnings for the expansion.
Dividend Sustainability Analysis
Four-Factor Sustainability Test
Factor 1: Cash Position
PASSCash of ₹95.52 Cr covers the ₹8.31 Cr dividend 11.49 times. The company can pay this dividend eleven times over from cash on hand without touching a rupee of new earnings. Affordability is not in question.
Factor 2: Free Cash Flow
FAILLevered FCF of −₹373 Cr means the dividend is not covered by free cash flow. In a strict cash-flow test this fails outright. The mitigating factor is that the negative FCF is capex-driven, not operations-driven.
Factor 3: Debt Position
CAUTIONDebt-to-equity doubled from 0.13 to 0.27 and interest coverage fell from 9.47x to 4.20x. Paying dividends while levering up is a legitimate concern — though at ₹8.31 Cr the amounts involved are too small to move the leverage needle.
Factor 4: Earnings Trend
FAILPAT down 30.08%, revenue down 4.65%, ROE at 4.33%, five-year EBIT growth at approximately −22.58% annually. The earnings trend is clearly declining, not growing.
Classification
Sustainability Rating
MODERATELY SUSTAINABLE
Why not "Sustainable": The dividend fails two of four tests. Free cash flow is deeply negative, and the earnings trend is falling sharply. A dividend that is not covered by free cash flow is not, in the strictest sense, self-funding.
Why not "Unsustainable": The absolute amount is ₹8.31 Cr — roughly 10.48% of profits and 8.7% of cash on hand. Even if FY27 profits halve again, the company would still cover this dividend from earnings alone. There is no realistic scenario in the near term where LXCHEM cannot physically write this cheque.
The honest position: The dividend is highly affordable but poorly supported by the underlying business trajectory. Investors should assume continued variability — this board has demonstrated it will size the dividend to the year's profit rather than defend a level. A further cut in FY27 would be entirely consistent with its track record if earnings do not recover.
Peer Comparison
LXCHEM Against Indian Specialty Chemicals Peers
| Company | Dividend/Share | Dividend Yield | ROE | ROCE | Promoter |
|---|---|---|---|---|---|
| Laxmi Organic (LXCHEM) | ₹0.30 | 0.19% | 4.33% | 4.43% | 69.35% |
| Deepak Nitrite | ₹7.50 | 0.34% | 22.9% | 30.0% | 49.1% |
| Vinati Organics | ₹8.50 | Not Disclosed by Company | Not Disclosed by Company | Not Disclosed by Company | Not Disclosed by Company |
| Basic Materials Sector Avg | — | 1.70% | — | — | — |
Deepak Nitrite metrics as displayed on Screener.in; ex-date for its ₹7.50 dividend is 27 July 2026. Vinati Organics FY26 PAT ₹487.78 Cr standalone with ₹8.50 final dividend recommended. Sector average dividend yield for Basic Materials per TipRanks.
Where LXCHEM Stands
LXCHEM's 0.19% yield sits at roughly one-ninth of the Basic Materials sector average of 1.70%. Even against Deepak Nitrite — itself a low-yield growth chemical company at 0.34% — LXCHEM pays little over half as much.
The gap on returns is starker than the gap on yield. Deepak Nitrite's ROE of 22.9% and ROCE of 30.0% against LXCHEM's 4.33% and 4.43% is a difference of roughly 5x to 7x. Both are specialty chemical companies operating in the same Indian macro environment. The divergence is company-specific, not sectoral.
The Fair Counterpoint
Comparing LXCHEM to Deepak Nitrite is not entirely like-for-like. Deepak Nitrite is roughly 6.6x larger by market capitalisation (₹28,453 Cr versus ₹4,300 Cr), operates a more diversified portfolio spanning phenolics and advanced intermediates, and is past the capex-heavy phase LXCHEM is currently in.
LXCHEM's promoter holding of 69.35% with zero pledging is materially higher than Deepak Nitrite's 49.1% — a genuine positive on alignment, though it also concentrates the dividend benefit, as the next section shows.
Promoter Impact Analysis
Where The ₹8.31 Crore Actually Goes
Yellowstone Trust, on behalf of the promoter and promoter group, disclosed holding 19,22,06,496 equity shares as at 31 March 2026, with no encumbrance during FY26. That is 69.35% of the company.
Promoter Dividend Income
₹5.77 Cr
19,22,06,496 shares × ₹0.30 = ₹5.77 Cr, which is 69.35% of total distribution.
Public & Minority Dividend Income
₹2.55 Cr
All non-promoter shareholders combined — FII, DII, mutual funds and retail — share ₹2.55 Cr, or 30.65%.
Shareholding Structure
| Category | Holding % | Dividend Share (₹ Cr) |
|---|---|---|
| Promoter & Promoter Group | 69.35% – 69.40% | 5.77 |
| Foreign Institutional Investors (FII) | 1.20% – 1.60% | 0.10 – 0.13 |
| Domestic Institutional Investors (DII) | 0.32% – 0.50% | 0.03 – 0.04 |
| Mutual Funds | 3.94% | 0.33 |
| Retail & Public | 25.70% – 25.85% | 2.14 – 2.15 |
Ranges reflect variation across data providers reporting different quarter-ends. Mutual fund holding rose from 3.29% to 3.94% quarter-on-quarter. Promoter holding has been essentially flat, moving from 69.38% to 69.37% between recent quarters.
Distribution Impact — Reading This Fairly
The concentration is real but not a red flag. Yes, roughly seven out of every ten rupees distributed goes to the promoter family. But that is simply proportional to ownership — every shareholder receives exactly ₹0.30 per share regardless of who they are. There is no preferential treatment.
What is genuinely worth noting is that the promoters, who control the board's dividend recommendation and hold 69.35%, chose to reduce their own dividend income by 40% — from approximately ₹9.61 Cr to ₹5.77 Cr. Promoters with a cash requirement would typically be expected to resist a cut. That they did not resist suggests the cut reflects a genuine capital-preservation judgment rather than extraction.
For a retail investor: A holding of 1,000 LXCHEM shares yields ₹300 gross. On a ₹1.58 lakh investment at current prices, that is pocket change. The practical minority-shareholder benefit from this dividend is close to symbolic.
Taxation Analysis
How Dividends Are Taxed In India
Before April 2020, companies paid Dividend Distribution Tax (DDT) and dividends reached investors tax-free. The Finance Act 2020 abolished DDT and shifted the entire burden to the recipient. Today:
- 1.Dividend income is taxed at your applicable income tax slab rate under the head "Income from Other Sources".
- 2.The company deducts TDS at 10% under Section 194 before crediting your bank account.
- 3.TDS applies only if aggregate dividend from a single company exceeds ₹10,000 in a financial year (the threshold was raised from ₹5,000 with effect from 1 April 2025).
- 4.If PAN is not linked or furnished, TDS rises to 20%.
- 5.TDS is not the final tax. It is an advance credit. You must declare the full dividend in your ITR and pay the balance if your slab exceeds 10%.
- 6.Forms 15G (individuals below 60) and 15H (senior citizens) can be submitted to the RTA to avoid TDS if total income is below the taxable limit.
- 7.Interest on money borrowed to invest is deductible against dividend income, capped at 20% of the dividend, under Section 57.
Worked Example A — Standard Illustration
1,000 shares · ₹10 dividend per share · 30% tax slab
Note: TDS is ₹0 because the ₹10,000 dividend does not exceed the ₹10,000 threshold. At ₹10,001 the company would deduct ₹1,000, and the investor would pay the remaining ₹2,120 at filing.
Worked Example B — Actual LXCHEM Investor
1,000 LXCHEM shares · ₹0.30 dividend per share · 30% tax slab
A ₹1.58 lakh position generates ₹206 net for the year. To even reach the ₹10,000 TDS threshold, an investor would need 33,334 shares — an investment of roughly ₹52.9 lakh.
Key Risks
Commodity Spread Risk — The Core Business Vulnerability
LXCHEM's acetyl intermediates segment earns the spread between acetic acid input cost and ethyl acetate selling price. Neither is under the company's control. Management explicitly flagged pronounced volatility in these spreads as an FY26 headwind. This is structural, not cyclical noise — the company is a price-taker on both sides of its largest business.
Return Ratios Below Cost Of Capital
ROE at 4.33% and ROCE at 4.43% are below any reasonable estimate of LXCHEM's cost of capital. Sustained returns below cost of capital mean the substantial capital already deployed is not earning its keep. Five-year EBIT growth of approximately −22.58% annually indicates this is a multi-year trend, not a single bad year.
Capex Execution And Payback Risk
The ₹500 Cr HDFC term loan is funding capacity expansion including Dahej Phase 2. Interest is being incurred now; revenue is not. If Dahej ramps slower than planned or arrives into a weak pricing environment, the company carries the debt service without the offsetting earnings. Interest coverage has already halved from 9.47x to 4.20x.
Freight And Logistics Cost Inflation
Management disclosed that freight surcharges have doubled logistics costs. For an exporter of bulk and specialty chemicals, freight is a direct deduction from realisation that typically cannot be repriced into contracts immediately. Continued geopolitical disruption to shipping routes would extend this drag.
Valuation Risk At ~54x Earnings
The stock trades at a P/E of roughly 54x on FY26 earnings while delivering 4.33% ROE. That combination prices in a substantial earnings recovery. The 52-week range of ₹107.60 to ₹241.00 shows the market's own uncertainty — a spread of over 124%. If the recovery is delayed, multiple compression is the likely outcome.
Negative Free Cash Flow Persistence
Levered free cash flow of −₹373 Cr against reported profit of ₹79.36 Cr is a substantial divergence. Capex explains it today. If negative FCF persists after Dahej Phase 2 commissions and begins contributing, the explanation shifts from "investment phase" to "working capital or operational problem" — a materially worse diagnosis.
Dividend Policy Unpredictability
Six payouts, three cuts, no stated dividend policy and no minimum payout commitment. The dividend has ranged from ₹0.30 to ₹0.70 — a variation of over 133%. Any investor modelling a dividend stream from LXCHEM is modelling something the company has never committed to.
AGM Approval And Management Transition
The dividend remains legally conditional until declared at the AGM on 5 August 2026. Separately, the AGM agenda includes seeking approval for executive director remuneration in the event of absence or inadequacy of profits for FY26, FY27 and FY28 — a resolution companies file when they anticipate the possibility of insufficient profits. A new CFO also joined on 16 June 2026.
What To Monitor
1. Acetic Acid To Ethyl Acetate Spread
Management noted spreads recovered toward the end of FY 2025-26. Track whether that holds through Q1 and Q2 FY27. This single variable drives more of LXCHEM's earnings than any management action.
2. Dahej Phase 2 Commissioning And Ramp
Charging began in Q1 FY27. Watch for the first quarter of meaningful revenue contribution and the utilisation rate disclosed on concalls. Delay here directly extends the ROCE drought.
3. EBITDA Margin Trajectory
Operating margins compressed to 5.30% from 9.68% during FY26. Recovery toward the high single digits is the earliest reliable evidence that the business is turning. Margin, not revenue, is the metric that matters here.
4. Interest Coverage Ratio
Currently 4.20x, down from 9.47x. If this falls below 3x while Dahej is still pre-revenue, the balance sheet moves from comfortable to constrained. This is the leading indicator of financial stress.
5. Free Cash Flow Inflection
Watch the FY27 cash flow statement for the point at which operating cash flow exceeds capex. That inflection is the single cleanest signal that the investment cycle is complete and the dividend can grow again.
6. Freight Surcharge Normalisation
Logistics costs doubled. Any commentary on freight rates normalising, or on contract repricing to pass costs through, translates almost directly into margin recovery.
7. New CFO's First Full-Year Disclosures
Mr. Amit Jain took charge on 16 June 2026. New CFOs frequently reset guidance, revisit accounting estimates or change disclosure practice in their first two quarters. Q2 FY27 is the meaningful test.
8. Institutional Holding Direction
Mutual fund holding rose from 3.29% to 3.94% quarter-on-quarter while FII holding sits at only 1.20% to 1.60%. Domestic funds accumulating into weakness while foreign investors stay away is a divergence worth tracking each quarter.
9. FY27 Dividend Decision
The May 2027 board meeting is the real test of policy. A restoration toward ₹0.50 would signal genuine confidence. A second consecutive cut, or a hold at ₹0.30, would confirm the dividend has become a token gesture rather than a return of capital.
10. Volume Growth Versus Realisation
In FY25 the company delivered 11% volume growth yet FY26 revenue still fell 4.65%. That gap is pure realisation decline. Watch whether FY27 volume growth finally converts into revenue growth — if it does not, pricing power is the problem.
Conclusion
What This Dividend Actually Tells You
Laxmi Organic Industries' ₹0.30 final dividend for FY 2025-26 is, financially speaking, almost irrelevant. At ₹8.31 Cr it represents 0.29% of revenue and 10.48% of profit. Whether the company paid it or not would change nothing about its balance sheet, its capex programme or its debt service.
Its value is entirely informational. A board that cuts a trivially small dividend by 40% — reducing the promoter family's own income from roughly ₹9.61 Cr to ₹5.77 Cr in the process — is communicating something about how it views FY27. That message reads as caution.
Positives
- ✓Dividend record unbroken since listing in 2021 — six consecutive years including through the FY26 downturn
- ✓Payout ratio of just 10.48% means the dividend is covered 9.54x by earnings and 11.49x by cash
- ✓Absolute leverage remains conservative at 0.27 debt-to-equity
- ✓Promoter holding of 69.35% with zero pledging — strong alignment, no encumbrance during FY26
- ✓Q4 FY26 showed sequential improvement — revenue up 9% QoQ and PBT up 145.26% YoY
- ✓Unmodified auditor's opinion on both standalone and consolidated FY26 statements
- ✓Mutual fund holding rising from 3.29% to 3.94% — domestic institutions accumulating
Negatives
- ✕Dividend cut 40% — the lowest payout since listing, and the third cut in five transitions
- ✕Consolidated PAT down 30.08% on revenue down only 4.65% — a 25.43 pp divergence
- ✕Levered free cash flow of −₹373 Cr against reported profit of +₹79.36 Cr
- ✕ROE 4.33% and ROCE 4.43% — below cost of capital
- ✕Debt-to-equity doubled from 0.13 to 0.27; interest coverage halved from 9.47x to 4.20x
- ✕Yield of 0.19% is roughly one-ninth of the Basic Materials sector average of 1.70%
- ✕AGM seeks approval for director remuneration in case of inadequacy of profits across FY26, FY27 and FY28
The Bottom Line
This is not a dividend story and it should not be read as one. At 0.19% pre-tax and 0.13% post-tax for a 30% slab investor, LXCHEM's dividend does not meaningfully contribute to total return. Anyone holding this stock is holding it for an eventual earnings recovery driven by spread normalisation and the Dahej Phase 2 ramp.
The dividend's only genuine use to an investor is as a management sentiment indicator. Read in that light, the 40% cut alongside an AGM resolution anticipating possible inadequacy of profits, a doubling of leverage and a halving of interest coverage paints a board planning for a difficult FY27 rather than a confident one. The positives — unbroken payment record, conservative absolute leverage, sequential Q4 improvement — are real, but they describe endurance rather than recovery.
The evidence is laid out above. The decision is yours.
Frequently Asked Questions
What dividend has Laxmi Organic Industries announced for FY 2025-26?
What is the dividend yield on LXCHEM shares?
What is the record date for the Laxmi Organic dividend?
What is the ex-date and why is it the same as the record date?
When will the Laxmi Organic dividend actually be paid?
Who is eligible to receive this dividend?
How will this dividend be taxed in my hands?
Is the Laxmi Organic dividend sustainable?
What is Laxmi Organic's dividend history?
Why was the dividend cut by 40% this year?
How much of this dividend goes to the promoters?
Does the dividend need AGM approval, and could it change?
What should investors monitor after this dividend?
Is LXCHEM a good dividend stock for regular income?
What happens to the share price on the ex-dividend date?
Disclaimer
This article is published by ShareBazaar Online for informational and educational purposes only. It does not constitute investment advice, a recommendation, or an offer or solicitation to buy or sell any security. ShareBazaar Online is not a SEBI-registered investment adviser or research analyst.
Figures relating to the record date, AGM date and the purpose of the corporate action are drawn from Laxmi Organic Industries Limited's exchange filing dated 21 May 2026. The dividend amount, financial results, market prices, shareholding data, ratios and peer figures are drawn from the company's board-meeting outcome, its 37th AGM notice, and publicly available third-party financial data sources, and have been cited within the relevant sections. Market prices and ratios change continuously; readers should verify current data on NSE India, BSE India or the company's investor relations page before acting.
The recommended dividend of ₹0.30 per share remains subject to shareholder approval at the 37th Annual General Meeting scheduled for 5 August 2026 and is not payable until declared.
Taxation commentary reflects the general position under the Income Tax Act, 1961 as applicable to resident individual investors. Individual circumstances differ, and non-resident investors are subject to different provisions including treaty rates. Readers should consult a qualified chartered accountant or tax adviser regarding their own position.
Investments in securities markets are subject to market risks. Past performance is not indicative of future results. Readers should conduct their own due diligence and consult a SEBI-registered investment adviser before making any investment decision. ShareBazaar Online and its authors accept no liability for any loss arising from reliance on this content.
Explore More Investment Opportunities
Discover IPOs, unlisted shares, and broker comparison tools curated for smart investors.