
Dividend Status Banner
STATUS: UPCOMING — RECORD DATE NOT YET PASSED
Rainbow Children’s Medicare Limited has fixed Tuesday, 21 July 2026 as the Record Date for its Final Dividend of ₹3.50 per equity share for FY 2025–26. As on today, 20 July 2026, the record date has not yet passed.
Because Indian equities settle on a T+1 basis, the ex-date and the record date fall on the same day — 21 July 2026. This means today, 20 July 2026, is the last trading session in which a purchase of RAINBOW shares will settle in time to appear on the register on the record date. Anyone buying on or after 21 July 2026 will buy the share ex-dividend and will not receive this payout; the seller will.
One additional condition applies. This is a final dividend, not an interim one. The Board has only recommended it. It becomes legally payable only after shareholders approve it at the 28th Annual General Meeting on Wednesday, 29 July 2026. Until that vote is passed, no dividend is due to anyone.
Dividend Snapshot
Company & Security
| Company Name | Rainbow Children’s Medicare Limited |
| NSE Symbol | RAINBOW |
| BSE Scrip Code | 543524 |
| ISIN | INE961O01016 |
| CIN | L85110TG1998PLC029914 |
| Sector | Healthcare — Hospitals |
Dividend Particulars
| Dividend Type | Final Dividend |
| Dividend Per Share | ₹3.50 |
| Dividend Percentage | 35% |
| Face Value | ₹10 per share |
| Financial Year | FY 2025–26 |
| Total Dividend Outflow | ₹35.55 Crore |
| Shares Outstanding | 10.16 Crore |
| AGM Approval Required | Yes — 29 July 2026 |
Yield & Coverage At A Glance
Dividend Yield at CMP ₹1,493.40
0.23%
NSE close, 17 July 2026
Dividend Payout Ratio
12.8%
On consolidated PAT attributable to owners
Dividend Coverage Ratio
7.83×
Consolidated EPS ₹27.41 ÷ DPS ₹3.50
Cash & Investments Coverage
12.33×
₹438.39 Cr ÷ ₹35.55 Cr outflow
Dividend Announcement Summary
The Board of Directors of Rainbow Children’s Medicare Limited met on Saturday, 23 May 2026. The meeting began at 4:45 P.M. and closed at 6:30 P.M. Among the items approved, the Board recommended a final dividend of ₹3.50 per equity share (35% of the ₹10 face value) for the financial year ended 31 March 2026.
In the same sitting, the Board approved audited standalone and consolidated results for Q4 and FY26, on which statutory auditors S.R. Batliboi & Associates LLP issued an unmodified opinion — auditor language meaning no reservations, qualifications or adverse findings were recorded.
What The Company Actually Committed To
- Dividend aggregating ₹355.46 million (₹35.55 Crore), a figure the company stated itself in the notes to the accounts.
- Payment subject to shareholder approval at the 28th AGM.
- Amount to be dispatched or credited within 30 days of the conclusion of the AGM.
- Record date fixed under Regulation 42 of SEBI LODR for both the dividend and AGM entitlement.
Other Board Decisions The Same Day
- Re-appointment of Dr. Ramesh Kancharla as Chairman & Managing Director for five years, 11 August 2026 to 10 August 2031.
- Re-appointment of Dr. Dinesh Kumar Chirla as Whole Time Director for the same five-year window.
- Second five-year terms for Independent Directors Mr. Santanu Mukherjee and Ms. Sundari R. Pisupati.
- Grant of 267,550 stock options under ESOP 2025 at a discount of up to 20% to the closing price of 22 May 2026.
- Re-appointment of M/s. Lavanya & Associates LLP as Cost Auditors for FY 2026–27.
Management Commentary On The Dividend
The board outcome filing carries no narrative commentary explaining the reasoning behind the dividend quantum — no stated payout policy target, no explanation of the increase from ₹3.00 to ₹3.50, and no forward guidance on future payouts. Rationale for the dividend decision: Not Disclosed by Company.
Key Dates Timeline
| Event | Date | Status |
|---|---|---|
| Board Meeting Intimation | 15 May 2026 | Completed |
| Announcement Date (Board Meeting) | 23 May 2026 (Saturday) | Completed |
| Ex-Dividend Date | 21 July 2026 | Tomorrow |
| Record Date | 21 July 2026 (Tuesday) | Tomorrow |
| 28th Annual General Meeting (VC/OAVM) | 29 July 2026 (Wednesday) | Pending |
| Payment Date | On or before 28 August 2026 | Pending |
Note On The Payment Date
The company has not published a specific payment date. It has committed only to a window: within 30 days of the AGM concluding. With the AGM on 29 July 2026, the outer limit is 28 August 2026. For reference, the FY25 dividend followed a similar pattern and was paid on 4 August 2025. Exact payment date: Not Disclosed by Company.
Dividend Yield Analysis
The Arithmetic
Dividend yield tells you the cash return on the price you pay. The formula is simple: dividend per share divided by market price, multiplied by 100.
At the NSE closing price of ₹1,493.40 on 17 July 2026, an investor deploying ₹1,00,000 into RAINBOW today would collect roughly ₹234 in gross dividend — before any tax. A savings bank account pays more.
Announcement-Date Yield
The board met on Saturday, 23 May 2026, a non-trading day, so the market first reacted on Monday, 25 May 2026. We were unable to verify the exact NSE closing price on the reaction date from a primary source, and we do not estimate figures we cannot verify. Announcement-date CMP and announcement-date yield: Not Disclosed by Company. What is on record is that the stock has since moved higher — it was around ₹1,253 on 10 April 2026 and closed at ₹1,493.40 on 17 July 2026, a gain of roughly 19% over that stretch, which by itself pushes the yield down.
Yield Reality Check — Why Is This Number So Small?
A yield can be low or high for very different reasons, and the reason matters more than the number. Here is what is actually driving 0.23%:
Reason 1 — A deliberately small payout
The company distributed only 12.8% of consolidated profit. It kept 87.2% inside the business. That is a capital-allocation choice, not a weakness.
Reason 2 — An expensive share price
RAINBOW traded at a P/E of roughly 53.7× and a P/B of about 9.1× in mid-July 2026. High multiples mathematically crush yield regardless of how generous the dividend is.
Reason 3 — Growth is consuming the cash
FY26 saw ₹216.46 Cr of capex and ₹203.19 Cr on acquisitions. Together that is nearly 12× the dividend cheque.
Reason 4 — Not a special or one-off spike
This is a routine annual final dividend, up 16.7% from ₹3.00. There is no special dividend inflating the headline and no distress signal deflating the price.
The honest reading: this is a growth company that pays a token dividend. Anyone buying RAINBOW for income is buying the wrong instrument. The dividend is a governance signal — evidence that the business generates surplus cash — not a source of return.
Dividend History Analysis
Complete Post-Listing Dividend Record
Rainbow Children’s Medicare listed on 10 May 2022. A ten-year listed dividend history therefore does not exist. Below is the complete record since listing.
| FY | Type | DPS | % | Record Date | Payment Date |
|---|---|---|---|---|---|
| FY 2025-26 | Final | ₹3.50 | 35% | 21 Jul 2026 | By 28 Aug 2026 |
| FY 2024-25 | Final | ₹3.00 | 30% | 28 Jun 2025 | 4 Aug 2025 |
| FY 2023-24 | Final | ₹3.00 | 30% | 23 Jul 2024 | 29 Aug 2024 |
| FY 2022-23 | Final | ₹3.00 | 30% | 22 Jun 2023 | 29 Jul 2023 |
| FY 2021-22 | Final | ₹2.00 | 20% | 8 Sep 2022 | 15 Oct 2022 |
Pre-listing dividend record (FY17–FY21): Not Disclosed by Company in the filings reviewed.
Pattern Read
- Zero cuts. Zero suspensions. Zero missed years. Five for five since listing.
- Zero special dividends. Every payout has been a plain annual final dividend.
- Three flat years then a step-up. ₹3.00 held constant across FY23, FY24 and FY25 before rising to ₹3.50 in FY26 — a 16.67% increase.
- Four-year DPS CAGR from ₹2.00 to ₹3.50 works out to roughly 15%, but that is flattered by the low FY22 base.
Classification
Consistent Payer
Uninterrupted annual dividends across all five completed years as a listed entity.
The qualifier worth attaching: consistency here means reliability of the habit, not materiality of the amount. A payout that sat unchanged at ₹3.00 for three years while consolidated EPS climbed from roughly ₹21 to ₹24 means the payout ratio was quietly shrinking, not growing. FY26’s bump partially arrests that drift but does not reverse it.
Financial Performance Analysis
Consolidated FY26 vs FY25
All figures converted from the company’s reported ₹ Million into ₹ Crore. Consolidated basis, which includes eight subsidiaries and one Section 8 foundation.
| Particulars | FY26 (₹ Cr) | FY25 (₹ Cr) | Growth |
|---|---|---|---|
| Revenue from Operations | 1,703.08 | 1,515.87 | +12.35% |
| Other Income | 43.79 | 51.01 | −14.15% |
| Cost of Materials Consumed | 227.03 | 194.92 | +16.47% |
| Employee Benefits Expense | 233.53 | 206.37 | +13.16% |
| Professional Fees to Doctors | 418.81 | 369.02 | +13.49% |
| Other Expenses | 279.54 | 255.67 | +9.34% |
| Finance Costs | 77.62 | 72.46 | +7.12% |
| Depreciation & Amortisation | 150.57 | 138.44 | +8.76% |
| EBITDA (computed) | 544.17 | 489.89 | +11.08% |
| Exceptional Item (Labour Codes) | 1.54 | — | — |
| Profit Before Tax | 358.23 | 330.00 | +8.55% |
| Total Tax Expense | 76.69 | 85.77 | −10.59% |
| Profit After Tax | 281.54 | 244.23 | +15.28% |
| PAT Attributable to Owners | 278.32 | 243.42 | +14.34% |
| Diluted EPS (₹) | 27.41 | 23.84 | +14.97% |
Operating Leverage Analysis — Read This Part Carefully
Operating leverage means profits should grow faster than revenue as a business scales, because fixed costs get spread over more patients. Here is the actual FY26 sequence:
Revenue Growth
+12.35%
EBITDA Growth
+11.08%
PBT Growth
+8.55%
PAT Growth
+15.28%
Negative Finding: EBITDA and PBT both grew slower than revenue.
EBITDA margin slipped from 32.32% to 31.95%, a compression of roughly 37 basis points. PBT grew at only 8.55% against 12.35% revenue growth. This is the opposite of operating leverage.
Exact reasons, quantified:
- Cost of materials rose 16.47% against 12.35% revenue growth — consumables and pharmacy inflation outpacing the top line.
- Professional fees to doctors rose 13.49% and now consume 24.59% of every rupee of revenue, the single largest cost line. In a specialist paediatric and neonatal business, consultant economics are the binding constraint.
- Employee benefits rose 13.16%, also ahead of revenue.
- Other income fell 14.15%, from ₹51.01 Cr to ₹43.79 Cr, removing ₹7.22 Cr that flowed straight through to PBT. Treasury income shrank because cash was redeployed into acquisitions.
- A ₹1.54 Cr exceptional charge from New Labour Codes gratuity re-measurement, disclosed by the company as a past-service-cost recognition under Ind AS 19.
The PAT Number Needs An Asterisk
PAT grew 15.28% while PBT grew only 8.55%. The gap is entirely tax.
The swing was driven by a deferred tax credit of ₹19.45 Cr in FY26 versus ₹3.52 Cr in FY25. Applied at FY25’s tax rate, FY26 PAT would have been approximately ₹265.1 Cr rather than ₹281.5 Cr — giving underlying PAT growth of roughly 8.6%, not 15.28%. Investors reading only the headline PAT growth are reading a tax event, not an operating improvement.
How Much Growth Was Bought Rather Than Earned?
FY26 included two acquisitions the company consolidated mid-year. Its own notes disclose exactly what they contributed:
| Acquisition | Consolidated From | Revenue Added | PBT Added | Consideration |
|---|---|---|---|---|
| Prashanthi Medicare (76%) | 1 July 2025 | ₹19.15 Cr | ₹0.85 Cr | ₹32.60 Cr |
| Pratiksha Women & Child (76%) | 18 August 2025 | ₹64.87 Cr | ₹13.67 Cr | ₹171.00 Cr |
| Combined | — | ₹84.02 Cr | ₹14.53 Cr | ₹203.60 Cr |
Stripping the acquisitions out changes the picture materially.
Organic revenue growth: approximately +6.81% (not 12.35%). Organic PBT growth: approximately +4.15% (not 8.55%). Roughly 45% of reported revenue growth was purchased, not generated by the existing hospital base. This is the single most important number in the results and it does not appear in any headline.
Cash Flow Analysis
Reported Profit Is An Opinion. Cash Is A Fact.
Profit depends on judgement calls — depreciation schedules, provisions, deferred tax. Cash flow does not. Here is what the consolidated cash flow statement shows:
| Particulars | FY26 (₹ Cr) | FY25 (₹ Cr) |
|---|---|---|
| Cash Generated from Operations | 521.19 | 481.25 |
| Income Tax Paid (net) | (101.54) | (85.59) |
| Net Operating Cash Flow (OCF) | 419.66 | 395.66 |
| Capex (PPE, intangibles, CWIP) | (216.46) | (145.67) |
| Acquisition of Subsidiaries (net of cash) | (203.19) | — |
| Net Investing Cash Flow | (258.65) | (267.80) |
| Lease Principal Repayment | (18.00) | (14.86) |
| Interest Paid | (77.62) | (72.46) |
| Dividend Paid (FY25 dividend) | (30.47) | (30.46) |
| Purchase of Treasury Shares | (21.30) | — |
| Net Increase in Cash | 13.64 | 10.14 |
Cash Conversion — Positive Finding
OCF ÷ PAT
1.49×
The company converted ₹419.66 Cr of cash from ₹281.54 Cr of reported profit. Anything above 1.0× means accounting profit is being backed by real money arriving in the bank. Hospitals structurally score well here because depreciation and lease amortisation are large non-cash charges — but the ratio still confirms the earnings are not fictional.
The caveat: OCF grew only 6.07% while reported PAT grew 15.28%. Cash generation is expanding at less than half the pace of the profit headline.
Receivables — Negative Finding
Trade Receivables Growth
+33.48%
vs revenue growth of +12.35%
Receivables jumped from ₹77.30 Cr to ₹103.18 Cr. Debtor days stretched from roughly 18.6 days to 22.1 days, an increase of about 3.5 days.
What it implies: the company is billing faster than it is collecting. Part of the jump is mechanical — two acquired hospitals brought their own debtor books onto the balance sheet. But an allowance for expected credit loss of ₹5.33 Cr was also booked in FY26 against ₹0.73 Cr in FY25, a seven-fold rise. Inventories also rose 51% to ₹41.63 Cr. Working capital is loosening. At 22 days it is not alarming; the direction is what deserves watching.
Free Cash Flow — And How The Dividend Is Actually Funded
FCF (OCF − Capex)
₹203.20 Cr
Covers the dividend 5.72×
FCF after leases & interest
₹107.58 Cr
Covers the dividend 3.03×
The stricter measure matters for a hospital chain. Rainbow runs an asset-light hub-and-spoke model built on leased property, so ₹18.00 Cr of lease principal and ₹77.62 Cr of interest are unavoidable cash obligations that the standard FCF formula ignores. Even after deducting both, free cash flow covers the ₹35.55 Cr dividend three times over.
Verdict on funding source: Current Earnings.
The dividend is not funded by cash reserves, not by asset sales (proceeds from PPE sales were a trivial ₹1.29 Cr), and not by borrowings — the company took on no new debt in FY26. It is paid entirely out of the year’s operating cash. At ₹35.55 Cr, the dividend consumes just 8.5% of operating cash flow.
Balance Sheet Strength
Key Positions (Consolidated, 31 March 2026)
| Total Assets | ₹2,774.84 Cr |
| Total Equity | ₹1,663.59 Cr |
| Equity Attributable to Owners | ₹1,648.07 Cr |
| Cash & Cash Equivalents | ₹33.89 Cr |
| Current Investments | ₹404.50 Cr |
| Total Cash & Investments | ₹438.39 Cr |
| Conventional Borrowings | Nil |
| Lease Liabilities (non-current + current) | ₹890.98 Cr |
| Goodwill | ₹156.89 Cr |
| Non-Controlling Interest | ₹15.51 Cr |
Net Debt — Two Answers, Both True
Excluding Lease Liabilities
Net Cash of ₹438.39 Cr
Including Lease Liabilities
Net Debt of ₹452.59 Cr
Which figure you use depends on what you believe about the leases. Under Ind AS 116 every hospital lease sits on the balance sheet as a liability with a matching right-of-use asset (₹669.18 Cr). These are genuine long-dated cash commitments that generate the ₹77.62 Cr annual finance cost. Presenting the company as “debt-free” without that qualification would be misleading. Net debt to equity including leases is roughly 0.27× — comfortable, not stressed.
Return Ratios (Computed — Not Disclosed by Company in this filing)
ROE (on average owners’ equity)
17.86%
ROCE (incl. lease liabilities in capital employed)
16.42%
Method: ROE = PAT attributable to owners ₹278.32 Cr ÷ average owners’ equity of ₹1,558.13 Cr. ROCE = operating EBIT of ₹393.60 Cr ÷ average capital employed of ₹2,396.58 Cr. Both computed from the audited results in the filing; the company itself did not disclose ROE or ROCE in this document. Latest annual report figures: Not Disclosed by Company in the material reviewed.
The Goodwill Line Is New
FY25 consolidated goodwill was nil. FY26 shows ₹156.89 Cr, created by the two acquisitions — ₹20.44 Cr from Prashanthi and ₹136.45 Cr from Pratiksha. Add other intangibles and intangibles under development and the total intangible block reaches roughly ₹197.75 Cr, or 11.9% of net worth. Goodwill is not amortised; it is tested annually for impairment. If either acquired hospital underperforms its purchase-price assumptions, the write-down lands directly in the profit and loss account. This is a new risk that did not exist on the FY25 balance sheet.
Dividend Sustainability Analysis
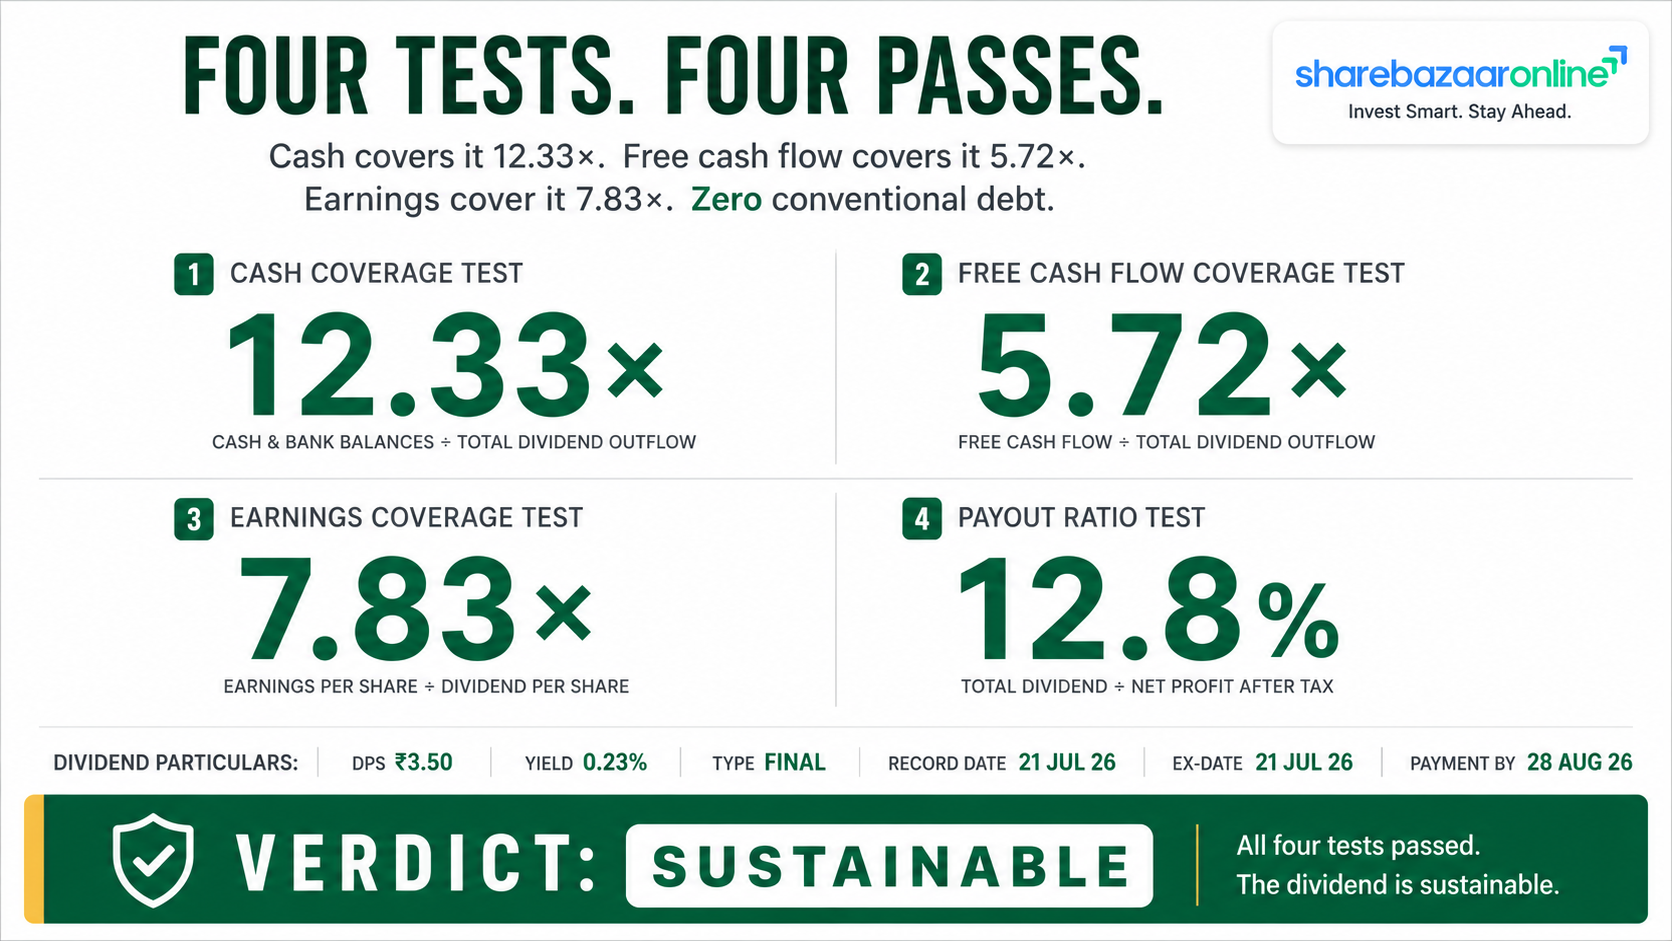
Four Tests
1. Can the company afford it? Comfortably.
Cash and investments of ₹438.39 Cr cover the ₹35.55 Cr outflow 12.33 times. The company could pay this dividend for twelve consecutive years out of existing liquid resources alone, with zero further earnings.
2. Is it covered by free cash flow? Yes.
FCF of ₹203.20 Cr covers it 5.72×. On the stricter post-lease, post-interest measure of ₹107.58 Cr, coverage is still 3.03×. Both clear the bar comfortably.
3. Is debt rising while dividends are paid? No.
There are no conventional borrowings on the consolidated balance sheet and none were raised in FY26. Lease liabilities did rise from ₹763.58 Cr to ₹890.98 Cr, but that reflects new hospital capacity coming on stream, not dividend financing. Crucially, the ₹203.19 Cr acquisition spend was funded from internal accruals, not leverage.
4. Is the earnings trend intact? Growing, but decelerating organically.
EPS rose from ₹23.84 to ₹27.41. But organic PBT growth of roughly 4.15% and a 37bps EBITDA margin contraction mean the underlying engine is running slower than the headline. A dividend that consumes 12.8% of profit can survive a lot of deceleration, but the trend is worth respecting.
Classification
Sustainable
All four tests pass. The payout ratio of 12.8% leaves an enormous buffer — profits could fall by more than 85% and the dividend would still be covered by earnings. Cash coverage of 12.33× and FCF coverage of 3.03× on the strictest basis reinforce this.
The qualification that matters: sustainability here is a statement about safety, not about growth. A payout ratio this low, held down by a heavy capex and acquisition pipeline (900 beds planned by FY29), means the dividend is structurally capped. Investors should expect the payout to stay token for as long as the expansion runs. Safety and generosity are not the same thing.
Peer Comparison
Indian Listed Hospital Chains — Dividend Metrics
| Company | Latest DPS | Dividend Yield | Payout Ratio |
|---|---|---|---|
| Rainbow Children’s Medicare | ₹3.50 | 0.23% | 12.8% |
| Apollo Hospitals Enterprise | ₹10.00 | ~0.28% | ~21% |
| Narayana Hrudayalaya | ₹4.50 | ~0.23% | Not Disclosed by Company |
| Max Healthcare Institute | ₹1.50 | Not Disclosed by Company | ~13.6% |
Peer DPS, yield and payout figures sourced from publicly available market data providers (Equitymaster, GuruFocus, INDmoney, Simply Wall St) as at July 2026. Peer ROE, ROCE and cash-position figures on a strictly comparable audited basis: Not Disclosed by Company in the primary filings reviewed for this report, and we have chosen not to reproduce unverified third-party estimates for those lines.
Sector Benchmark
- The Indian healthcare industry average dividend yield sits around 0.3%.
- The top quartile of Indian dividend payers yields around 1.4%.
- The bottom quartile threshold is roughly 0.29%.
Rainbow’s 0.23% sits below the industry average and below even the bottom-quartile threshold of the broader Indian market. It is one of the lower-yielding stocks in a low-yielding sector.
Where Rainbow Stands Out
- Lowest payout ratio among the comparable set at 12.8%, versus roughly 21% for Apollo.
- Highest promoter concentration at 49.84%, versus 28.0% at Apollo and 23.7% at Max Healthcare — which materially changes who benefits from each rupee distributed.
- No conventional debt, an unusual position in a capital-intensive sector.
- The narrowest specialty focus — paediatrics, obstetrics, gynaecology and fertility only, versus multi-specialty peers.
Promoter Impact Analysis
Where The ₹35.55 Crore Actually Goes
Based on the shareholding pattern as at June 2026.
| Shareholder Category | Holding | Dividend Received |
|---|---|---|
| Promoter & Promoter Group | 49.84% | ₹17.72 Cr |
| Domestic Institutions (DII) | 22.56% | ₹8.02 Cr |
| Foreign Institutions (FII) | 16.02% | ₹5.69 Cr |
| Public & Retail | ~11.58% | ₹4.12 Cr |
| Total | 100% | ₹35.55 Cr |
Distribution Impact
Just under half of every rupee distributed — ₹17.72 Cr — flows to the promoter family, principally Dr. Ramesh Kancharla and associated holders. Institutional investors together take ₹13.71 Cr. The genuine retail and small public shareholder base, at roughly 11.58%, receives about ₹4.12 Cr in aggregate.
This is not a criticism — a per-share dividend is by definition equal for every share, and promoters take the same ₹3.50 as anyone else. But the concentration matters when reading intent. With a 49.84% stake, promoters capture roughly half the benefit of any decision to distribute rather than reinvest, which is exactly why a low payout ratio here reads as a growth-first choice rather than a cash-extraction one.
Minority Shareholder Perspective
An investor holding 100 shares receives ₹350 gross. Against an investment of roughly ₹1,49,340 at the current price, that is a cash return of 0.23% before tax.
The far larger determinant of minority returns is the 87.2% of profit retained and reinvested. Whether that retention creates value is answered by ROCE, not by the dividend. At a computed 16.42% ROCE, the company is currently earning a return on retained capital that comfortably exceeds what a shareholder would earn on the cash if it were paid out and reinvested in a fixed deposit. On that arithmetic, retention is the rational choice.
One structural note: ₹15.51 Cr of consolidated equity belongs to non-controlling interests in the 76%-owned subsidiaries. Profits attributable to those minorities (₹3.22 Cr in FY26) are not available for distribution to Rainbow’s own shareholders.
Capital Allocation Analysis — What Else Could Management Have Done?
FY26 generated ₹419.66 Cr of operating cash. Here is how it was deployed, and what the alternatives would have looked like:
| Use of Cash | FY26 Amount | % of OCF |
|---|---|---|
| Growth Capex (PPE, CWIP, intangibles) | ₹216.46 Cr | 51.6% |
| Acquisitions (Prashanthi + Pratiksha) | ₹203.19 Cr | 48.4% |
| Interest & Lease Principal | ₹95.62 Cr | 22.8% |
| Dividend (FY25, paid in FY26) | ₹30.47 Cr | 7.3% |
| Treasury Shares for ESOP Trust | ₹21.30 Cr | 5.1% |
- Reduce debt? There is no conventional debt to reduce. The only leverage is lease liabilities, which cannot be prepaid without surrendering hospital premises. This option was unavailable.
- Increase capex? Management did — capex rose 48.6% from ₹145.67 Cr to ₹216.46 Cr, alongside 500 beds added in FY26 and land purchased in Gurugram (Sectors 44 and 56) for roughly 400 further beds.
- Conduct a buyback? At a P/E near 53.7× and P/B near 9.1×, buying back shares would destroy value for continuing holders. Declining a buyback at these multiples is the correct call. Notably, the company did spend ₹21.30 Cr on treasury shares — but for the ESOP trust, which offsets dilution rather than returning capital.
- Retain more cash? It already retains 87.2%. Cash and investments of ₹438.39 Cr are earning treasury returns; note that other income fell 14.15% as that pool was redeployed into acquisitions. Hoarding more idle cash would have depressed ROCE further.
Assessment: the ₹35.55 Cr dividend is the smallest line in the capital allocation table. The consequential decisions in FY26 were the ₹203.19 Cr of acquisitions and the ₹216.46 Cr of capex. Whether shareholders did well this year will be settled by the returns those two decisions earn, not by the dividend.
Taxation Analysis
How Dividends Are Taxed In India
Until 31 March 2020, companies paid Dividend Distribution Tax (DDT) and dividends arrived tax-free in the investor’s hands. Since 1 April 2020 that has reversed completely. The current position:
- Dividends are fully taxable in the hands of the shareholder, added to total income and taxed at the investor’s applicable slab rate. There is no exemption limit and no concessional rate for resident individuals.
- TDS under Section 194 is deducted by the company at 10% where aggregate dividend from a single company exceeds ₹10,000 in a financial year (this threshold was raised from ₹5,000 with effect from 1 April 2025).
- TDS rises to 20% if PAN is not furnished or is inoperative.
- Forms 15G / 15H can be submitted by eligible investors whose total income is below the taxable threshold to avoid TDS.
- TDS is not the final tax. It is a credit. If the investor’s slab is 30%, the balance must be paid as self-assessment or advance tax.
- Health & Education Cess of 4% applies on the tax computed, and surcharge applies at higher income levels.
- Interest expense incurred to earn dividend income is deductible under Section 57, capped at 20% of the dividend.
- Non-resident shareholders face TDS at 20% plus applicable surcharge and cess, subject to relief under the relevant Double Taxation Avoidance Agreement.
Worked Example A — Standard Illustration
Investor owns 1,000 shares. Dividend ₹10 per share. Tax slab 30%.
| Gross Dividend (1,000 × ₹10) | ₹10,000 |
| TDS u/s 194 @ 10% | ₹0 — threshold not exceeded |
| Amount credited to bank | ₹10,000 |
| Tax @ 30% + 4% cess = 31.2% | ₹3,120 |
| Net Dividend After Tax | ₹6,880 |
| Effective retention | 68.8% |
Note the trap: because the aggregate is exactly ₹10,000 and not above it, no TDS is deducted — but ₹3,120 of tax is still owed. The investor must pay it themselves. A single rupee more of dividend would have triggered ₹1,000 of TDS.
Worked Example B — Actual RAINBOW Numbers
Investor owns 1,000 RAINBOW shares. Dividend ₹3.50 per share. Tax slab 30%.
| Investment at CMP ₹1,493.40 | ₹14,93,400 |
| Gross Dividend | ₹3,500 |
| TDS u/s 194 | ₹0 — below ₹10,000 |
| Tax @ 31.2% | ₹1,092 |
| Net Dividend | ₹2,408 |
| Gross Yield | 0.23% |
| Effective Post-Tax Yield | 0.16% |
A 30%-slab investor would need to hold 2,858 RAINBOW shares — roughly ₹42.7 lakh of stock — before the dividend from this company alone crosses the ₹10,000 TDS threshold.
What this means in practice: for an investor in the highest slab, a 0.23% gross yield becomes roughly 0.16% after tax. That is materially below what a savings account pays. Any thesis for owning RAINBOW has to rest entirely on capital appreciation and business growth. The dividend is, in tax-adjusted terms, close to a rounding error on the investment.
Key Risks
1. Doctor Fee Inflation Is The Structural Squeeze
Professional fees to doctors consumed 24.59% of FY26 revenue — ₹418.81 Cr, the single largest cost line, and grew 13.49% versus 12.35% revenue growth. In paediatric intensive care and neonatology, a handful of specialists drive referral volumes and hold real bargaining power. Every year this line outgrows revenue, margins compress by definition.
2. Occupancy Risk From Aggressive Bed Addition
The company added 500 beds in FY26 — its highest ever — and has signalled roughly 900 more by FY29, including two Gurugram hospitals on newly bought land. New beds carry full lease, depreciation and staffing costs from day one but ramp occupancy over years. If ramp-up lags, the D&A line (already up 8.76% to ₹150.57 Cr) and the lease interest line (₹77.62 Cr) grow while revenue does not.
3. Goodwill Impairment On Two Fresh Acquisitions
₹156.89 Cr of goodwill appeared on the balance sheet in FY26 where there was none in FY25. Pratiksha alone carries ₹136.45 Cr of goodwill against net assets of ₹34.95 Cr — the company paid ₹171 Cr for a business whose identifiable net assets were valued at a fraction of that. If either hospital misses its plan, an impairment charge hits reported profit directly.
4. Single-Specialty And Geographic Concentration
The company states it operates in one business segment and one geography. Its revenue depends on paediatrics, obstetrics, gynaecology and fertility — with no diagnostics, pharmacy retail or insurance arm to buffer a downturn. India’s declining fertility rate is a slow-moving structural headwind for an obstetrics-led model. The presence footprint remains weighted to Hyderabad and southern India.
5. New Labour Codes Cost Impact Is Only Partly Recognised
The Government consolidated labour laws into four Codes effective 21 November 2025, with Central Rules notified 8 May 2026. The company has booked a ₹1.54 Cr exceptional charge for past service cost and has restructured employee compensation from 1 April 2026. But it explicitly notes that State Rules are yet to be notified. The full recurring cost of higher provident fund and gratuity bases will only be visible in FY27 numbers, against an employee cost line already growing 13.16%.
6. Regulatory And Pricing Intervention
Indian private hospitals operate under standing pressure on pricing — NPPA caps on devices and consumables, CGHS and state scheme rate schedules, and periodic judicial and policy scrutiny of hospital charges. Any tightening lands directly on a business whose cost of materials already grew 16.47%, faster than revenue.
7. Valuation Leaves No Room For Yield Support
At a P/E near 53.7× and P/B near 9.1×, the share price embeds substantial future growth. A dividend yielding 0.23% provides no downside cushion whatsoever. Investors who buy expecting a dividend to support the price during a de-rating will find it does not.
8. Working Capital Drift
Trade receivables grew 33.48% against 12.35% revenue growth, debtor days stretched by roughly 3.5 days, inventories rose 51%, and the expected credit loss allowance rose from ₹0.73 Cr to ₹5.33 Cr. None of these is dangerous today. All four moved the wrong way in the same year.
What To Monitor
1. Organic Versus Acquired Revenue Split
FY26 organic growth was roughly 6.81% against a reported 12.35%. In FY27, both acquisitions will be in the base for a full year. Watch whether reported growth converges toward the organic rate — that convergence is the true test of the business.
2. Occupancy Percentage Trajectory
Sell-side estimates point to occupancy rising to the 56–58% range by FY28. Quarterly occupancy and ARPOB (average revenue per occupied bed) disclosures are the earliest indicator of whether 500 new FY26 beds and 900 planned beds are filling.
3. Professional Fees To Doctors As A Percentage Of Revenue
This sat at 24.59% in FY26. If it crosses 25% and keeps climbing, EBITDA margin compression becomes structural rather than cyclical. This single ratio explains more about future margins than any other line.
4. Effective Tax Rate Normalisation
FY26’s 21.41% effective rate flattered PAT. If FY27 reverts toward the 25–26% range, reported PAT growth will look sharply weaker even if the operating business improves. Read PBT growth, not PAT growth, next year.
5. Debtor Days And Expected Credit Loss Provisioning
Debtor days moved from 18.6 to 22.1. If FY27 pushes past 25 days while ECL provisions keep rising from the FY26 level of ₹5.33 Cr, the quality of reported revenue comes into question.
6. Goodwill Impairment Testing Disclosures
Watch the FY27 annual report’s impairment note on the ₹156.89 Cr of goodwill — specifically the discount rate and terminal growth assumptions used for the Pratiksha and Prashanthi cash-generating units.
7. Capex Intensity Versus Operating Cash Flow
Capex rose 48.6% to ₹216.46 Cr while OCF grew only 6.07%. If capex keeps outrunning cash generation for the Gurugram builds, free cash flow narrows and either the dividend or the debt-free position eventually comes under pressure.
8. Payout Ratio Direction And Any Formal Dividend Policy
The payout ratio is 12.8%. Whether management articulates a formal target range, and whether the ratio drifts up or stays capped through the expansion cycle, will determine if RAINBOW ever becomes relevant to income investors. Currently: no stated policy.
9. Lease Liability Growth Rate
Lease liabilities grew from ₹763.58 Cr to ₹890.98 Cr, up 16.7% — faster than revenue. The associated finance cost of ₹77.62 Cr is a permanent claim on operating profit. Watch whether new bed additions come with progressively worse lease economics.
10. Fertility And IVF Segment Contribution
Management has positioned fertility services as a growth vector alongside rising occupancy. Segment-level fertility revenue is currently Not Disclosed by Company — the company reports as a single segment. Any move to disclose it would be a meaningful transparency improvement.
Conclusion
Positives
- Dividend raised 16.67% from ₹3.00 to ₹3.50 after three flat years — the first increase since FY23.
- Five consecutive years of dividends since listing, with no cut, suspension or missed year.
- Cash conversion of 1.49× — reported profit is backed by real operating cash.
- No conventional borrowings, and ₹203.19 Cr of acquisitions funded entirely from internal accruals.
- Cash coverage of 12.33× and post-lease FCF coverage of 3.03× make the dividend genuinely safe.
- Unmodified audit opinion from S.R. Batliboi & Associates LLP on both standalone and consolidated results.
- ROCE of roughly 16.42% supports the case that retained profit is being reinvested productively.
Negatives
- Yield of 0.23% is below the healthcare sector average and below the bottom quartile of Indian dividend payers.
- Post-tax yield of roughly 0.16% for a 30%-slab investor — below a savings account.
- Organic revenue growth of about 6.81% versus 12.35% reported; roughly 45% of growth was acquired.
- EBITDA margin compressed 37bps and EBITDA grew slower than revenue — negative operating leverage.
- PAT growth of 15.28% is tax-driven. At FY25’s effective rate, underlying growth was closer to 8.6%.
- ₹156.89 Cr of new goodwill introduces impairment risk absent a year ago.
- Receivables up 33.48%, inventories up 51%, ECL provisions up seven-fold.
- No stated dividend policy and no management commentary explaining the payout decision.
The Summary Judgement
Rainbow Children’s Medicare’s FY26 final dividend is safe, small and strategically irrelevant to the investment case. It is comfortably funded from current operating cash, backed by a debt-free balance sheet and ₹438.39 Cr of liquid resources, and it has never been cut. Nothing about it should worry a shareholder.
Equally, nothing about it should attract one. At 0.23% gross and 0.16% post-tax, the payout is a governance signal rather than a return. The genuinely important findings in this filing are elsewhere: that organic growth ran at roughly 6.81% rather than the headline 12.35%, that PAT growth was substantially a tax event, that EBITDA margins compressed 37 basis points, and that ₹156.89 Cr of goodwill now sits on a balance sheet that carried none last year. Those four facts will drive the share price. The ₹3.50 will not.
This report presents the positives, the negatives, the risks and the monitoring factors. The decision belongs to the reader.
Frequently Asked Questions
What dividend has Rainbow Children’s Medicare announced for FY 2025-26?
What is the Rainbow Children’s Medicare dividend yield?
What is the record date for the Rainbow Children’s Medicare dividend?
What is the ex-date and when is the last day to buy?
When will the Rainbow Children’s Medicare dividend be paid?
Who is eligible to receive this dividend?
How is this dividend taxed in India?
Is the Rainbow Children’s Medicare dividend sustainable?
What is Rainbow Children’s Medicare’s dividend history?
What should investors monitor after this dividend?
Why did Rainbow’s profit grow 15% when revenue grew only 12%?
Is Rainbow Children’s Medicare debt-free?
How much of this dividend goes to the promoters?
Does the dividend need AGM approval, and what happens if it is not approved?
Was Rainbow’s FY26 growth organic or acquired?
Disclaimer
This report is published by ShareBazaar Online for informational and educational purposes only. It does not constitute investment advice, a recommendation, or a solicitation to buy, sell or hold any security. ShareBazaar Online is not a SEBI-registered investment adviser or research analyst.
All figures marked as disclosed are taken from Rainbow Children’s Medicare Limited’s Outcome of Board Meeting dated 23 May 2026 and the audited standalone and consolidated financial results for the quarter and year ended 31 March 2026 filed with NSE and BSE. Market prices, shareholding data, peer metrics and dividend history are sourced from publicly available exchange and market data providers as at July 2026, and are cited in the relevant sections. Ratios including EBITDA, ROE, ROCE, free cash flow, organic growth, debtor days and net debt are computed by ShareBazaar Online from the audited figures and were not disclosed in that form by the company. Where information could not be verified from a primary source, it is stated as “Not Disclosed by Company” rather than estimated.
The dividend described here is a Board recommendation and remains subject to shareholder approval at the 28th Annual General Meeting on 29 July 2026. Record dates, ex-dates and payment schedules are subject to change by the company or the exchanges. Investors must independently verify all dates and amounts with the company’s official filings on www.nseindia.com, www.bseindia.com and www.rainbowhospitals.in before acting.
Tax treatment described is general in nature, reflects rules as understood at the date of publication, and varies with individual circumstances and residency status. Readers should consult a qualified chartered accountant or tax adviser regarding their own position. Securities investments are subject to market risks. Past dividend payments are not a guarantee of future payments. Please read all scheme and offer documents carefully before investing.