
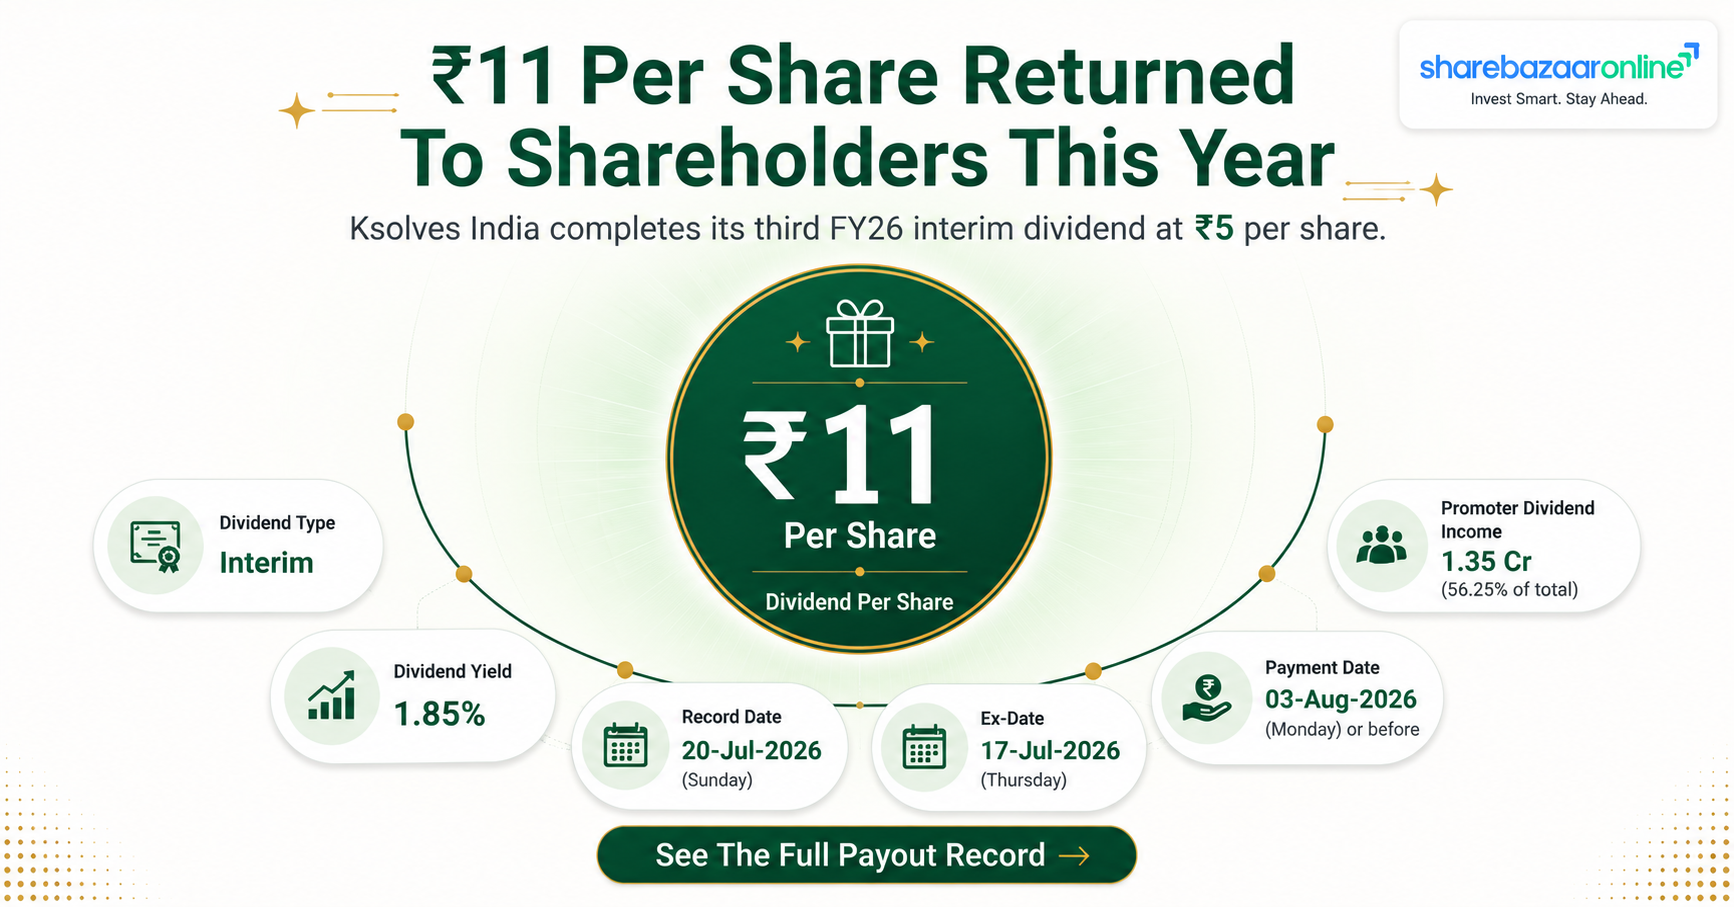
Dividend Status
STATUS: COMPLETED — THIS DIVIDEND IS CLOSED
The record date for Ksolves India Limited's 3rd Interim Dividend of ₹5 per share was 27 January 2026. That date has passed. Shares bought on or after 27 January 2026 did not carry entitlement to this payout, and the money was required to reach eligible shareholders within the 30-day statutory window (by roughly 19 February 2026).
This page is an analytical record of a past corporate action. It is not a live opportunity. Anyone searching for this dividend today cannot participate in it.
There is, however, a live dividend right now
At its board meeting on 15 July 2026, Ksolves declared a 1st Interim Dividend of ₹4 per share for FY 2026-27. The stock trades ex-dividend from 21 July 2026, with payment scheduled for 14 August 2026. That is a separate corporate action and is covered in its own report. (Source: exchange filings and Simply Wall St, July 2026.)
Dividend Snapshot
Company & Security
| Company | Ksolves India Limited |
| NSE Symbol | KSOLVES |
| BSE Scrip Code | 543599 |
| ISIN | INE0D6I01023 |
| Sector | IT Consulting & Software |
| Face Value | ₹5 per share |
Dividend Terms
| Dividend Type | 3rd Interim Dividend |
| Dividend Per Share | ₹5.00 |
| Dividend % | 100% of face value |
| Financial Year | FY 2025-26 |
| Total Outflow (computed) | ₹11.86 Crore |
| Shares Outstanding | ≈2.372 Crore |
The One-Line Version
Ksolves paid out ₹11 per share across three interim dividends in FY26 — roughly ₹26.09 crore — in a year when profit stayed flat at ₹34.33 crore and the closing cash balance was just ₹6.90 crore. The dividend is comfortably covered by earnings, but it is not covered by the cash sitting on the balance sheet. That single tension is the story of this payout.
Dividend Announcement Summary
What The Company Actually Filed
On Tuesday, 20 January 2026, the Board of Directors of Ksolves India Limited met and declared a 3rd Interim Dividend of ₹5 (five rupees) per share for the financial year 2025-26, on the fully paid-up equity share capital of the company. The intimation was filed with both NSE and BSE under Regulation 30 of the SEBI (LODR) Regulations, 2015, and signed by Manisha Kide, Company Secretary & Compliance Officer.
The filing fixed the record date as 27 January 2026 and stated the dividend would be paid "within the statutory time limit" to shareholders whose names appear on the Register of Members on that date.
Disclosed In The Filing
- Dividend amount: ₹5 per equity share
- Nature: Interim (third of FY26)
- Board meeting / announcement date: 20 January 2026
- Record date: 27 January 2026
- Applies to fully paid-up equity capital
Not Disclosed In The Filing
- Exact payment date — Not Disclosed by Company
- Total dividend outflow in ₹ crore — Not Disclosed by Company
- Management commentary or rationale — Not Disclosed by Company
- Cut-off for the register/transfer books — Not Disclosed by Company
A Point On AGM Approval
Several data aggregators described this payout as "subject to shareholder approval." That framing is misleading. Under Section 123(3) of the Companies Act, 2013, an interim dividend is declared by the Board of Directors and does not require shareholder ratification at an AGM. Only a final dividend — which the Board merely recommends — needs AGM approval. Ksolves' own filing correctly uses the word "declared," not "recommended." Once declared, an interim dividend becomes a liability the company must settle within 30 days.
Key Dates Timeline
| Event | Date | Status |
|---|---|---|
| Board Meeting / Announcement | 20 January 2026 (Tuesday) | Passed |
| Ex-Dividend Date | 27 January 2026 | Passed |
| Record Date | 27 January 2026 | Passed |
| Payment Date | Not Disclosed by Company | Completed |
| Statutory Payment Deadline | On or before ~19 February 2026 | Passed |
Why Ex-Date And Record Date Are The Same Day
Under India's T+1 settlement cycle, a trade executed today settles tomorrow. So the last day to buy and still land on the register for a 27 January record date was 26 January 2026. From 27 January itself, the stock traded "ex" — without the dividend attached. Older articles that place the ex-date two days before the record date are describing the pre-2023 T+2 regime and no longer apply.
Dividend Yield Analysis
Yield On This Tranche
| Dividend per share | ₹5.00 |
| Price around announcement (≈) | ₹280 |
| Announcement-window yield | ≈1.79% |
| Latest CMP (17 Jul 2026) | ₹296.85 |
| Yield on latest CMP | 1.68% |
Announcement-day close is an approximation. Ksolves traded in a ₹277–₹304 band through January 2026 (Business Standard price data); the exact 20-Jan-2026 NSE close is Not Disclosed by Company in the filing.
Trailing 12-Month Yield
| FY26 total dividend | ₹11.00 |
| TTM yield at ₹280 | 3.93% |
| TTM yield at ₹296.85 | 3.71% |
| FY25 total (split-adjusted) | ₹15.50 |
| YoY change in DPS | −29.0% |
Yield Reality Check — Where This 3.7% Actually Came From
A trailing yield near 3.7% is unusually high for an Indian IT services company. It is worth being blunt about why.
- The share price fell, hard. Ksolves hit a 52-week high of ₹537 on 20 January 2025. One year later, on the very day this dividend was declared, the stock was near ₹280 — a decline of roughly 48%. Business Standard's data showed a −41.17% one-year return as of early January 2026. A yield calculated on a halved denominator will look generous whether or not the numerator improved.
- The numerator actually shrank. On a like-for-like, split-adjusted basis, FY25 dividends were ₹15.50 per share versus ₹11.00 in FY26 — a 29% cut. So the higher yield is not the product of a bigger dividend.
- Payout ratio did the heavy lifting. With profit flat, the only way to keep distributing meaningfully was to hand out a larger slice of it — the FY26 payout ratio ran at roughly 76%.
Read plainly: this is a falling-price yield combined with a shrinking dividend, not a rising-dividend yield. Those two situations look identical on a screener and are completely different businesses.
Dividend History Analysis
Full Dividend Record Since Listing (2021–2026)
Ksolves listed in July 2020 and has declared 17 dividends since February 2021. Note the 1:2 stock split (face value ₹10 → ₹5) with record date 6 February 2025. Dividends before that date are shown as declared and also split-adjusted, so the trend is comparable.
| Record / Ex-Date | Type | As Declared | Split-Adjusted |
|---|---|---|---|
| 27 Jan 2026 | Interim | ₹5.00 | ₹5.00 |
| 23 Oct 2025 | Interim | ₹5.00 | ₹5.00 |
| 25 Jul 2025 | Interim | ₹1.00 | ₹1.00 |
| 25 Mar 2025 | Interim | ₹7.50 | ₹7.50 |
| 28 Oct 2024 | Interim | ₹8.00 | ₹4.00 |
| 28 Jun 2024 | Interim | ₹8.00 | ₹4.00 |
| 21 Mar 2024 | Interim | ₹5.00 | ₹2.50 |
| 26 Jan 2024 | Interim | ₹7.50 | ₹3.75 |
| 26 Oct 2023 | Interim | ₹7.00 | ₹3.50 |
| 14 Jul 2023 | Final | ₹8.00 | ₹4.00 |
| 04 Mar 2023 | Interim | ₹3.00 | ₹1.50 |
| 28 Oct 2022 | Interim | ₹4.50 | ₹2.25 |
| 22 Jul 2022 | Interim | ₹8.00 | ₹4.00 |
| 04 Feb 2022 | Interim | ₹3.25 | ₹1.63 |
| 29 Oct 2021 | Interim | ₹2.50 | ₹1.25 |
| 07 Jun 2021 | Final | ₹30.00 | ₹15.00 |
| 03 Feb 2021 | Interim | ₹10.00 | ₹5.00 |
Source: Trendlyne corporate actions record for KSOLVES; split-adjustment computed by ShareBazaar Online.
Financial Year Totals (Split-Adjusted)
| FY 2025-26 | ₹11.00 |
| FY 2024-25 | ₹15.50 |
| FY 2023-24 | ₹9.75 |
| FY 2022-23 | ₹7.75 |
| FY 2021-22 | ₹6.63 |
| FY 2020-21 | ₹5.00 |
Classification: Consistent Payer, Variable Amount
- Consistency: Strong. Dividends declared in every single financial year since listing, usually 2–4 times a year alongside quarterly results.
- Growth trend: Rose steadily from ₹5.00 (FY21) to a peak of ₹15.50 (FY25), then fell 29% to ₹11.00 in FY26. The compounding trend has broken.
- Special dividends: None labelled special. The ₹30 final in June 2021 (₹15 adjusted) was an outsized post-listing payout, not a recurring feature.
- Cuts: Yes — FY26 is a clear reduction, and the ₹1 July 2025 tranche was a sharp step down from the pattern.
- Suspensions: None to date.
The Detail Most Reports Miss
The ₹1 per share first interim dividend declared in July 2025 is the single most informative data point in this table. Against a run-rate of ₹4–₹7.50 per tranche, ₹1 is a deliberate signal of caution — declared in the same quarter that Q1 FY26 net profit fell 28% year-on-year to ₹6.43 crore despite revenue rising 20%. The company then returned to ₹5 tranches in October 2025 and January 2026 once quarterly profit stabilised. Anyone modelling FY27 payouts should treat the tranche size as a variable that management adjusts quarter by quarter, not a fixed commitment.
Financial Performance Analysis
Consolidated Results — FY26 vs FY25
All figures consolidated, in ₹ crore, as reported by the company.
| Metric | FY26 | FY25 | Change |
|---|---|---|---|
| Revenue from Operations | ₹162.67 Cr | ₹137.43 Cr | +18.4% |
| EBITDA | ₹48.30 Cr | ≈₹47.83 Cr | +1.0% |
| EBITDA Margin | 29.7% | 34.8% | −510 bps |
| Profit After Tax | ₹34.33 Cr | ≈₹34.31 Cr | Flat |
| PAT Margin | 21.1% | ≈25.0% | −390 bps |
| EPS | ₹14.48 | ₹14.47 | +0.1% |
| ROE | 137% | Not Disclosed by Company | — |
| ROCE | 152% | Not Disclosed by Company | — |
Source: Ksolves India investor communications and Q4 FY26 results release, April 2026.
Operating Leverage Analysis — Revenue Up 18.4%, Profit Up 0.1%
This is the central finding of the year and it deserves plain language. Operating leverage means that in a services business with largely fixed overheads, each extra rupee of revenue should drop a disproportionately large amount into profit. In FY26, Ksolves delivered the opposite: revenue grew 18.4%, EBITDA grew 1.0%, and PAT grew 0.1%.
Put in rupee terms: the company added ₹25.24 crore of incremental revenue and converted roughly ₹0.47 crore of it into incremental EBITDA — an incremental margin of under 2%, against a company-average margin of 29.7%. Effectively, the entire growth was consumed by cost.
Where the 510 basis points of margin went, per management:
- Employee and senior leadership costs — hiring of senior global leaders to break into larger accounts.
- ESOP-related charges — a non-cash but real hit to reported EBITDA.
- New labour regulation costs — a structural, recurring increase, not a one-off.
- AI capability build-out and international branding spend — the company states all 600+ employees are AI-certified.
Management frames all of this as planned investment rather than operational failure, and FY27 guidance of 18–20% revenue growth with 25–30% EBITDA margin implicitly concedes that the higher cost base is now permanent. That guidance range does not recover the 34.8% margin of FY25.
Quarterly Trajectory Through FY26
| Quarter | Revenue | PAT |
|---|---|---|
| Q1 FY26 | ₹37.67 Cr | ₹6.43 Cr (−28% YoY) |
| Q2 FY26 | ₹39.67 Cr | ₹8.41 Cr (−8.5% YoY) |
| Q3 FY26 | ₹42.30 Cr | ₹9.80 Cr (−5.0% YoY) |
| Q4 FY26 | ₹43.03 Cr | ₹9.69 Cr (+65.4% YoY) |
Reading The Quarterly Pattern Honestly
Revenue rose in every quarter of FY26 — a genuinely clean sequential trend. Profit is messier. Three of four quarters showed year-on-year declines. The headline-grabbing +65.4% Q4 growth is real but flattered by a weak base: Q4 FY25 PAT was only ₹5.86 crore, itself a poor quarter.
Sequentially, Q4 FY26 PAT of ₹9.69 crore was actually 1.1% lower than Q3's ₹9.80 crore. The recovery is early and not yet proven across consecutive quarters.
Five-Year Growth Context
The company reports a five-year revenue CAGR of 42% and a five-year net profit CAGR of 31% for FY21–FY26. Both are exceptional numbers. But the gap between them — 11 percentage points — tells you margins have been compressing across the entire period, not just in FY26. FY26 simply made that trend impossible to ignore, because profit growth finally hit zero.
Cash Flow Analysis
Reported Profit Is An Opinion. Cash Is A Fact.
Ksolves reported ₹34.33 crore of profit in FY26 and distributed roughly ₹26.09 crore of it as dividends. It ended the year with a closing cash balance of ₹6.90 crore.
That is the number retail investors should sit with. The company distributed roughly 3.8 times its year-end cash balance during FY26. This is only possible because the cash was generated and paid out through the year — it was never allowed to accumulate.
Cash Coverage Ratios (Computed)
| Cash & equivalents (FY26 close) | ₹6.90 Cr |
| This tranche outflow (₹5/share) | ₹11.86 Cr |
| Cash cover, this tranche | 0.58× |
| FY26 full-year outflow (₹11/share) | ₹26.09 Cr |
| Cash cover, full year | 0.26× |
Earnings Coverage Ratios (Computed)
| FY26 EPS | ₹14.48 |
| Coverage on ₹5 tranche | 2.90× |
| Coverage on FY26 total ₹11 | 1.32× |
| FY26 payout ratio | 76.0% |
| Retained for reinvestment | ₹8.24 Cr (24.0%) |
How Is This Dividend Actually Funded?
Working through the four possible sources:
- Current earnings — YES, primarily. With ₹34.33 crore of PAT against ₹26.09 crore of dividends, current-year profit funds the payout with ₹8.24 crore to spare.
- Cash reserves — NO, there are none to speak of. A ₹6.90 crore closing balance cannot fund a ₹26 crore programme. There is no buffer here.
- Asset sales — NO. No material asset disposals disclosed.
- Borrowings — NO. The company is net debt-free and confirmed this status at FY26 close.
The correct verdict is: the dividend is funded entirely out of the current year's earnings, with essentially no reserve cushion behind it. That is a materially different risk profile from a company paying an equivalent yield out of a large accumulated cash pile. If a single quarter's profit disappoints badly, the dividend is the first line item with nowhere to hide.
What We Could Not Verify — And Are Not Going To Guess
- Operating Cash Flow vs Net Profit (FY26): Not Disclosed by Company in the quarterly releases. The full cash flow statement appears only in the FY26 Annual Report. Readers should check whether OCF tracks the ₹34.33 crore PAT — a services business with rising receivables can report healthy profit while collecting far less.
- Free Cash Flow (FY26): Not Disclosed by Company. Consequently FCF coverage of the dividend cannot be computed and we will not estimate it.
- Receivables growth vs revenue growth: Not Disclosed by Company in interim filings. This matters unusually much here — roughly 77% of FY26 revenue came from overseas clients, so collection cycles and currency movements both sit in this line.
- Total investments beyond cash: Not Disclosed by Company.
We would rather label a gap than fill it with an estimate that looks like a fact. The Annual Report is the document that closes these four gaps.
Balance Sheet Strength
Key Balance Sheet Markers
| Net Debt Position | Net Debt-Free |
| Cash Balance (FY26) | ₹6.90 Cr |
| Equity Share Capital | ≈₹11.86 Cr |
| Book Value per Share | ₹14.01 |
| Net Worth (computed) | ≈₹33.2 Cr |
| Total Investments | Not Disclosed by Company |
Why ROE Of 137% Is Not What It Looks Like
A 137% return on equity and 152% ROCE would be extraordinary in most businesses. Here, the arithmetic deserves scrutiny.
ROE is profit divided by shareholders' equity. Ksolves' net worth is only about ₹33 crore — because the company pays out most of its profit rather than retaining it. A high payout ratio mechanically keeps the equity base small, which mechanically inflates ROE.
So the 137% figure is partly a genuine reflection of an asset-light services model, and partly an artefact of the dividend policy itself. It is not evidence that the dividend is safe. Read it alongside the ₹6.90 crore cash balance, not instead of it.
Capital-Light, Reserve-Light
Ksolves runs a genuinely capital-light model: an IT services firm with 600+ employees, no heavy plant, and no debt. That is a real structural strength. The flip side is that the balance sheet carries almost no shock absorber. With a net worth near ₹33 crore against a market capitalisation of roughly ₹684 crore, the price-to-book ratio sits above 20×. Investors are paying almost entirely for the earnings stream and the payout, not for asset backing.
Dividend Sustainability Analysis
Verdict: MODERATELY SUSTAINABLE
The dividend is affordable out of earnings but has no reserve cushion, is being paid at a high payout ratio into a period of flat profits, and has already been cut once. It is not fragile — but it is not fixed either. Management has demonstrated it will adjust the tranche size downward when a quarter disappoints, and did exactly that in July 2025.
Supporting The Dividend
- Net debt-free. No interest obligations competing for cash.
- Earnings cover of 1.32× on the full FY26 payout — profit does exceed the distribution.
- Capital-light model. Minimal mandatory capex means profit converts to distributable cash more directly than in a manufacturing business.
- Revenue growing 18.4% with FY27 guidance of 18–20% — the top line is not the problem.
- Unbroken track record of dividends every year since listing in 2020.
Pressuring The Dividend
- ₹6.90 crore cash versus ₹26.09 crore of annual distribution — a 0.26× cash cover.
- 76% payout ratio leaves only ₹8.24 crore of retained earnings to fund all growth.
- Profit was flat in FY26 and declined year-on-year in three of four quarters.
- Dividend already cut 29% from FY25 levels — the precedent exists.
- Margin guidance of 25–30% for FY27 sits below FY26's actual 29.7% at the low end.
- FCF coverage cannot be verified — Not Disclosed by Company.
The Structural Tension, Stated Plainly
Management has told the market it is investing in senior leadership, AI capability and international branding to break through toward a larger revenue scale. Those investments cost money. Simultaneously, the company distributes 76% of its profit to shareholders and retains just ₹8.24 crore. A company cannot fund an aggressive scale-up phase and a near-maximum payout ratio from the same flat profit pool indefinitely. One of the two has to give. Watching which one gives — and when — is the single most useful thing a Ksolves shareholder can do over the next four quarters.
Peer Comparison
Where Ksolves Sits In Indian IT
Ksolves is a small-cap IT services company with a market capitalisation of roughly ₹684 crore. That places it in a different universe from the large-cap IT names most dividend screens surface, so a like-for-like comparison needs care.
| Metric | Ksolves India | Typical Large-Cap Indian IT |
|---|---|---|
| Market Cap | ≈₹684 Cr | ₹50,000 Cr – ₹15 lakh Cr |
| Trailing Dividend Yield | ≈3.7% | Typically 1.5% – 3.5% |
| Payout Ratio | ≈76% | Commonly 60% – 100%+ |
| EBITDA Margin FY26 | 29.7% | Broadly 20% – 26% |
| FY26 Revenue Growth | +18.4% | Low single digits in a soft demand year |
| ROE | 137% | Typically 20% – 45% |
| Net Debt | Debt-free | Usually net cash |
| Cash Position | ₹6.90 Cr | Multiple years of dividends held in reserve |
Peer-side figures are indicative sector ranges for context, not precise company data. Readers comparing specific companies should verify current figures on NSE/BSE filings. Ksolves-side figures are computed or sourced as cited throughout this report.
Where Ksolves Genuinely Wins
Growth and margin. An 18.4% revenue increase in a year when the broader Indian IT services sector grew in low single digits is a real differentiator, and it comes from niche positioning in Salesforce consulting, data engineering and Odoo ERP rather than commodity staffing. A 29.7% EBITDA margin also sits above most listed large-cap peers.
Where The Comparison Turns Against It
Balance sheet resilience. Large-cap IT companies typically hold cash equal to several years of dividend payments, which is precisely why their payouts survive downturns. Ksolves holds ₹6.90 crore against a ₹26 crore annual distribution. Same yield, very different margin of safety. Client concentration is also far higher — the top five clients contributed 40% and the top ten contributed 54% of FY26 revenue.
Promoter Impact Analysis
Shareholding Pattern
| Promoter Holding | 58.92% |
| FII Holding | 0.08% |
| DII Holding | 0.01% |
| Public / Retail | ≈40.98% |
| Promoter Pledge | Nil |
Source: shareholding pattern as reported for the quarter ended June 2026.
Dividend Distribution Split (Computed)
| This tranche — to promoters | ≈₹6.99 Cr |
| This tranche — to public | ≈₹4.87 Cr |
| FY26 full year — to promoters | ≈₹15.37 Cr |
| FY26 full year — to public | ≈₹10.72 Cr |
| To institutions (FII + DII) | ≈₹0.02 Cr |
What This Distribution Actually Tells You
Roughly ₹59 out of every ₹100 distributed goes to the promoter group. On the FY26 programme, promoters received an estimated ₹15.37 crore against a company net worth of about ₹33 crore. That ratio is worth stating clearly because it explains the payout policy: a founder-controlled company with a small equity base and a high payout ratio is, structurally, a company where dividends are the primary mechanism by which the controlling family realises returns.
This is not inherently negative. Unlike related-party transactions or preferential allotments, a dividend is pro-rata and fully transparent — every minority shareholder receives exactly the same ₹5 per share the promoter receives. Alignment of interest is genuine.
The caution is about tax efficiency and reinvestment. Because dividends are taxed at the recipient's slab rate, a high-payout policy is a relatively tax-inefficient way to return capital to a high-slab promoter — which makes the persistence of the policy notable. And every rupee distributed is a rupee not available for the AI and leadership investments management says are strategically necessary.
A Trend Worth Flagging
Promoter holding has drifted down — one data provider records a 3.51% decline over a six-month window, with the most recent quarterly change from 58.94% to 58.92%. Separately, promoters filed a formal declaration on 9 April 2026 confirming no encumbrance or pledge on their shares for FY26, which is a positive governance signal. Institutional ownership is effectively nil at 0.08% FII and 0.01% DII — meaning the stock is almost entirely promoter-and-retail owned, with the thin liquidity and higher volatility that implies.
Taxation Analysis
How Dividend Tax Works In India Today
Since 1 April 2020, the Dividend Distribution Tax paid by companies was abolished and the tax burden shifted entirely to the shareholder. The rules that apply to this Ksolves dividend:
- Dividend income is fully taxable in the hands of the investor, added to total income under "Income from Other Sources" and taxed at the investor's applicable slab rate. There is no exemption limit for dividend income itself.
- TDS under Section 194: the company deducts tax at source at 10% if total dividend paid to a resident shareholder by that company exceeds ₹10,000 in a financial year. Below that threshold, no TDS is deducted — but the income remains taxable.
- No PAN: TDS rises to 20%.
- Form 15G / 15H: resident investors whose total income is below the taxable limit can submit these to avoid TDS deduction.
- TDS is not the final tax. It is an advance credit. A 30%-slab investor still owes the balance at the time of filing their return.
- Deduction allowed: interest expense on money borrowed to invest can be claimed, capped at 20% of the dividend income.
Worked Example A — Standard Illustration
Investor holds 1,000 shares, dividend of ₹10 per share, tax slab 30%.
| Gross Dividend | ₹10,000 |
| TDS @ 10% | ₹0 (at threshold, not above) |
| Credited to bank | ₹10,000 |
| Tax @ 30% + 4% cess = 31.2% | ₹3,120 |
| Net Dividend After Tax | ₹6,880 |
| Effective post-tax yield (at ₹296.85) | 2.32% |
Gross yield on ₹10 at ₹296.85 = 3.37%. Tax removes 105 basis points.
Worked Example B — This Actual Ksolves Dividend
Investor holds 1,000 shares, dividend of ₹5 per share, tax slab 30%.
| Gross Dividend | ₹5,000 |
| TDS @ 10% | ₹0 (below ₹10,000) |
| Credited to bank | ₹5,000 |
| Tax payable @ 31.2% | ₹1,560 |
| Net Dividend After Tax | ₹3,440 |
| Effective post-tax yield (at ₹296.85) | 1.16% |
Note the trap: no TDS was deducted, so the full ₹5,000 hit the bank account. The ₹1,560 liability is still owed at return-filing time.
The Number That Changes The Investment Case
The headline trailing yield of 3.71% is a pre-tax figure. For an investor in the 30% slab, the real post-tax yield on FY26's ₹11 is approximately 2.55%. For a 20%-slab investor it is around 2.94%; for someone below the taxable threshold, the full 3.71% is retained. Any comparison of this stock against a fixed deposit, debt fund or another dividend stock must be done on post-tax numbers, and the answer differs materially by investor.
Key Risks
1. Client Concentration
The top 5 clients contributed 40% and the top 10 contributed 54% of FY26 revenue. The loss or budget freeze of a single major account could remove a mid-single-digit percentage of total revenue in one quarter — and with a 76% payout ratio, there is little retained profit to absorb it.
2. Geographic and Currency Exposure
Approximately 77% of FY26 revenue came from overseas markets, predominantly the US. This creates simultaneous exposure to US enterprise IT budget cycles, rupee-dollar movement, and any shift in US policy on outsourced technology services. Management has explicitly flagged geopolitical conflicts causing client order-release delays.
3. Margin Structure Has Permanently Reset
EBITDA margin fell 510 basis points from 34.8% to 29.7%. FY27 guidance of 25–30% does not target a return to FY25 levels, and its lower bound is below FY26 actuals. Senior leadership salaries and new labour-regulation costs are recurring, not one-off.
4. Thin Cash Buffer
A ₹6.90 crore closing cash balance against a ₹26.09 crore annual dividend programme means the payout depends on each year's earnings arriving on schedule. There is no reserve to bridge a weak year. This is the most under-reported risk in this stock.
5. Regulatory and Governance History
In March and April 2023, SEBI issued show-cause notices and initiated investigations into alleged insider trading and related-party transactions at Ksolves India. Investors should read the contingent liabilities and legal-proceedings disclosures in the Annual Report for the current status of these matters. (Source: publicly reported corporate news summaries.)
6. Product Strategy Setback
The company halted further investment in its DFM product after customer acceptance came in below expectations, refocusing on core IT services. Capital and management attention already spent on that initiative will not generate the intended return, and it narrows the path to a higher-margin, non-linear product revenue stream.
7. Talent Cost Inflation In An AI Race
The AI-first repositioning requires continuously re-skilling and retaining 600+ technical staff in one of the most competitive talent markets in Indian IT. Wage inflation in AI, Salesforce and data-engineering skills directly attacks the same margin line that already gave up 510 basis points.
8. Liquidity and Ownership Structure
With institutional ownership near zero (0.08% FII, 0.01% DII) and daily traded values that have been recorded in the low lakhs, price discovery is thin. The stock fell roughly 48% from its ₹537 peak within twelve months, which illustrates how quickly sentiment can move a low-float small-cap.
What To Monitor
1. Operating Cash Flow In The FY26 Annual Report
Compare OCF against the ₹34.33 crore reported PAT. A ratio comfortably above 1.0× confirms profits are converting to cash. A ratio meaningfully below 1.0× would mean the dividend is being funded ahead of collections — the most important single check available.
2. Trade Receivables Days
With 77% overseas revenue, watch whether receivables are growing faster than the 18.4% revenue growth. Rising days-sales-outstanding in a services company is usually the earliest warning that revenue quality is deteriorating.
3. Quarterly EBITDA Margin vs 25–30% Guidance
Q4 FY26 delivered 29.3%, up from 25.6% a year earlier. Track whether subsequent quarters hold near the top of the guided band or slip toward 25%. Each percentage point of margin on ~₹190 crore of FY27 revenue is roughly ₹1.9 crore of EBITDA.
4. Size Of Each Interim Dividend Tranche
The FY27 first interim came in at ₹4 per share versus ₹1 for the FY26 first interim — a meaningful step up. Whether subsequent FY27 tranches hold at ₹4–₹5 or drop back is the clearest real-time read on management's own confidence.
5. Closing Cash Balance Each Half-Year
Watch whether the balance rebuilds above ₹6.90 crore. A rising cash position alongside a maintained dividend would signal genuine surplus generation. A flat or falling balance means the company is running at the edge of its distributable capacity.
6. Client Concentration Percentages
Track whether top-5 concentration falls below the FY26 level of 40%. Falling concentration alongside growing revenue is the strongest evidence that the ₹150 crore-plus scale is genuinely widening the addressable client base as management claims.
7. Revenue Contribution From New Partnerships
Ksolves was named a Salesforce Summit Partner for a third consecutive year and onboarded as a Databricks Consulting Partner. Monitor whether these translate into disclosed revenue contribution or remain badges without measurable financial impact.
8. Promoter Shareholding Direction
Holding stands at 58.92%. Track the quarterly shareholding pattern for any continued drift. Combined with the absence of institutional holders, sustained promoter selling in a thinly-traded stock is a material signal in either direction.
Conclusion
The Positives
- Revenue grew 18.4% to ₹162.67 crore, crossing ₹150 crore for the first time, in a year when the broader Indian IT sector grew far more slowly.
- Net debt-free with no promoter pledge, formally declared to the exchanges in April 2026.
- Dividends declared in every financial year since listing in 2020 — 17 declarations in total.
- Earnings cover the FY26 payout at 1.32×; the dividend was not funded by debt or asset sales.
- EBITDA margin of 29.7% remains above most listed large-cap Indian IT peers.
- Q4 FY26 showed the first evidence of margin recovery, at 29.3% versus 25.6% a year earlier.
The Negatives
- Profit was flat at ₹34.33 crore despite ₹25 crore of incremental revenue — near-zero operating leverage.
- The dividend was cut 29%, from ₹15.50 to ₹11.00 per share on a split-adjusted basis.
- ₹6.90 crore of cash covers only 0.26× of the annual dividend programme.
- EBITDA margin fell 510 basis points and FY27 guidance does not target recovery to prior levels.
- The share price fell roughly 48% from its ₹537 peak — the high yield is substantially a price-decline artefact.
- Free cash flow and operating cash flow are Not Disclosed by Company in interim filings, so FCF coverage cannot be verified.
- SEBI show-cause notices from 2023 relating to alleged insider trading and related-party transactions remain part of the company's public record.
The Balance Of Evidence
Ksolves India's 3rd interim dividend of ₹5 per share was a real, fully-paid distribution from a growing, debt-free, cash-generative business — and it arrived in a year when that business converted almost none of its 18.4% revenue growth into profit growth. Both statements are true simultaneously, and most coverage of this stock reports only one of them.
The honest framing is this: the dividend is affordable from earnings, but it is running without a reserve. The FY26 payout ratio of 76% against a closing cash balance of ₹6.90 crore means shareholders are receiving a distribution funded almost entirely by that year's operating performance, in a business that has just absorbed a permanent 510-basis-point cost increase. Management has already shown, with the ₹1 tranche in July 2025, that it will size dividends to conditions.
Whether that is acceptable depends entirely on what an individual investor is buying: an income stream that requires quarterly re-verification, or a growth business whose dividend is a by-product of a small equity base. Those are different theses with different risk tolerances, and this report is not going to choose between them on anyone's behalf. The positives, the negatives, the risks and the monitoring checklist are all above — the decision belongs to the reader and, where appropriate, to their SEBI-registered adviser.
Frequently Asked Questions
What dividend has Ksolves India announced?
What is the Ksolves dividend yield?
What was the record date for this dividend?
What was the ex-dividend date?
When was the dividend paid?
Who was eligible to receive this dividend?
How is this dividend taxed in my hands?
Is the Ksolves dividend sustainable?
What is Ksolves' full dividend history?
What should investors monitor going forward?
Why did Ksolves' profit stay flat when revenue grew 18.4%?
Does an interim dividend need AGM approval?
How much of this dividend went to the promoters?
Is there a Ksolves dividend I can still participate in?
Why is Ksolves' ROE of 137% so high, and is that a good sign?
Disclaimer
This article is published by ShareBazaar Online for informational and educational purposes only. It does not constitute investment advice, a recommendation, or an offer to buy or sell any security. ShareBazaar Online is not a SEBI-registered investment adviser or research analyst.
Figures marked as computed are our own calculations derived from company filings and publicly reported data; the underlying inputs are cited within the relevant sections. Share prices, yields and shareholding percentages change continuously and were accurate to the best of our knowledge at the time of writing. Items marked "Not Disclosed by Company" were unavailable in the source filings at the time of publication and have deliberately not been estimated.
The dividend discussed in this report has a record date of 27 January 2026, which has passed. It is a completed corporate action and is not available for participation.
Investments in securities are subject to market risks. Past dividend performance is not indicative of future payouts, and dividends can be reduced, deferred or suspended at the discretion of the Board. Readers should read all scheme and company documents carefully and consult a SEBI-registered financial adviser before making any investment decision.