
Dividend Status
STATUS: UPCOMING — LAST DAY TO BUY IS TODAY
Jaro Institute of Technology Management and Research Limited (NSE: JARO | BSE: 544534) turns ex-dividend on 21 July 2026 for its final dividend of ₹3 per share for FY 2025-26. Under India’s T+1 settlement cycle, the ex-date and record date fall on the same day, which means 20 July 2026 is the last cum-dividend trading session. Shares purchased on or after 21 July 2026 will not carry this dividend.
DIVIDEND PER SHARE
₹3.00
Final Dividend — 30% on face value of ₹10
DIVIDEND YIELD (CURRENT CMP)
0.60%
On CMP of ₹497.55 (17 July 2026, Simply Wall St / S&P Global data)
Important: This is a recommended final dividend, not a declared one. It becomes legally payable only after shareholders approve it at the 17th Annual General Meeting on 28 July 2026. Payment is expected on or before 26 August 2026, within 30 days of the AGM, as stated by the company.
Dividend Snapshot
Company Identity
| Company Name | Jaro Institute of Technology Management and Research Limited |
| NSE Symbol | JARO |
| BSE Script Code | 544534 |
| ISIN | INE00YJ01010 |
| Sector | Education Services / EdTech |
| Listed On | 30 September 2025 (NSE & BSE) |
Dividend Particulars
| Dividend Type | Final Dividend |
| Dividend Per Share | ₹3.00 |
| Dividend % | 30% |
| Face Value | ₹10 |
| Financial Year | FY 2025-26 |
| Total FY26 Dividend | ₹5.00 (₹2 interim + ₹3 final) |
| AGM Approval Required | Yes — 28 July 2026 |
Capital & Outflow
| Paid-up Share Capital (31-03-2026) | ₹21.78 Cr |
| Shares Outstanding | 2,17,79,000 |
| Final Dividend Outflow | ₹6.53 Cr |
| Interim Dividend Already Paid | ₹4.43 Cr |
| Total FY26 Outflow | ₹10.97 Cr |
Shares outstanding derived from paid-up capital of ₹2,177.90 lakh ÷ ₹10 face value. This is net of treasury shares held by the Jaro Education Welfare Trust (ESOP Trust), which are deducted from equity under the company’s consolidation policy.
Coverage Metrics
| FY26 PAT | ₹52.92 Cr |
| FY26 Dividend Payout Ratio | 20.72% |
| Basic EPS FY26 | ₹24.97 |
| Coverage on Final Dividend | 8.32x |
| Free Cash Flow Coverage | 8.66x |
| Cash & Investments Coverage | 22.1x |
Dividend Announcement Summary
What the Board Approved
The Board of Directors met on Thursday, 7 May 2026 from 6:00 PM to 7:10 PM and approved two things: the audited financial results for the quarter and year ended 31 March 2026, and a recommended final dividend of 30%, i.e. ₹3 per equity share of ₹10 face value, for FY 2025-26.
In the company’s own words in the filing, the dividend “if approved by the Members at the forthcoming Annual General Meeting” will be credited or dispatched within 30 days from the AGM date. Statutory auditor M S K A & Associates LLP issued an unmodified opinion on the FY26 audited results — meaning the auditors found nothing requiring qualification.
Full-Year Dividend Picture
FY26 is the company’s first full dividend-paying year as a listed entity. The board declared an interim dividend of ₹2 per share on 2 January 2026 (paid January 2026, outflow ₹4.43 crore), and has now recommended ₹3 as final. Combined FY26 payout: ₹5 per share, or 50% of face value.
Management Commentary
The board meeting outcome letter contains no forward-looking management commentary on dividend policy, growth outlook or capital allocation intent. On qualitative guidance, the disclosure is: “Not Disclosed by Company”. Everything in this analysis below is derived from audited numbers, not from management narrative.
Standalone Only — No Consolidated Accounts
Note 13 of the results states the company has no subsidiary, associate or joint venture, and therefore is not required to prepare consolidated financial results. All figures in this analysis are standalone audited figures, which in this case are also the complete picture of the group. Readers should be careful with third-party data portals that display “consolidated” ratios for JARO — there is no separate consolidated set of books.
Key Dates Timeline
| Event | Date | What It Means |
|---|---|---|
| Board Meeting / Announcement | 07-05-2026 | Dividend recommended and disclosed to exchanges |
| Record Date Intimation | 06-07-2026 | Company notified exchanges of the eligibility cut-off |
| Last Cum-Dividend Day | 20-07-2026 | Final session to buy and still qualify |
| Ex-Date | 21-07-2026 | Stock trades without dividend entitlement |
| Record Date | 21-07-2026 | Register of members frozen for eligibility |
| Annual General Meeting | 28-07-2026 | 17th AGM, 2:30 PM, via VC/OAVM — shareholder approval |
| Payment Date | On or before 26-08-2026 | Credit/dispatch within 30 days of AGM |
Announcement date and AGM approval requirement sourced from the company’s BSE/NSE filing dated 7 May 2026. Ex-date, record date and expected payment date sourced from exchange corporate action data and Simply Wall St dividend calendar (17 July 2026). AGM date and time from the company’s newspaper advertisement filing dated 8 July 2026.
Why Ex-Date and Record Date Are the Same
Indian markets moved to a T+1 settlement cycle, meaning trades settle one working day after execution. Because of this, the ex-date and record date now typically fall on the same calendar day. Older articles that say “ex-date is two days before record date” are using pre-2023 conventions and are outdated for Indian stocks.
Dividend Yield Analysis
Yield Calculations
| Final Dividend Yield (CMP ₹497.55) | 0.60% |
| Yield on Announcement-Day Close (₹469.10) | 0.64% |
| Full-Year FY26 Yield (₹5 on CMP) | 1.00% |
| Yield on IPO Price (₹890) | 0.56% |
| Yield at 52-Week Low (₹383.50) | 1.30% |
Formula used: (Dividend Per Share ÷ Price) × 100. Announcement-day reference price is the 8 May 2026 close of ₹469.10, after the stock rose 14.54% on the results (Capital Market data via broker portals). 52-week low and IPO price from exchange data.
Yield Reality Check
A sub-1% yield does not make JARO a yield stock. But the more important observation is why the yield rose from 0.56% at IPO price to 1.00% today.
It is not because the dividend grew. It is because the share price fell roughly 44% from the ₹890 IPO price to around ₹497. When yield expands on a falling denominator rather than a rising numerator, that is a price-driven yield, not a dividend-driven one.
Investors screening for “improving yield” should treat this specific mechanism with care: the same ₹5 dividend simply became a larger percentage of a smaller price.
Context: What 0.60% Actually Buys You
On an investment of ₹1,00,000 at CMP ₹497.55, an investor holds roughly 201 shares and receives a gross final dividend of about ₹603. Compared with a bank fixed deposit or a liquid fund, the cash return here is negligible. Anyone buying JARO purely for this dividend is, in practical terms, taking full equity risk for the yield of a savings account — the investment case, if any, has to rest on business growth, not distribution.
Dividend History Analysis
Complete Listed Dividend Record
| Financial Year | Type | DPS | Outflow | Status |
|---|---|---|---|---|
| FY 2025-26 | Interim | ₹2.00 | ₹4.43 Cr | Paid (Jan 2026) |
| FY 2025-26 | Final | ₹3.00 | ₹6.53 Cr | Recommended — AGM pending |
| FY 2024-25 | Company was unlisted for the entire year. Pre-IPO distribution record: Not Disclosed by Company in this filing. | |||
| FY 2016-17 to FY 2023-24 | Not applicable — company was privately held; no public dividend record exists. | |||
Why a 10-Year History Does Not Exist
JARO listed on 30 September 2025. The mandated 10-year dividend history simply cannot be constructed — the company has been public for under ten months. Any website presenting a “10-year dividend history” for JARO is extrapolating. We state plainly: Not Disclosed by Company.
Classification
On the evidence available, JARO is best classified as an Unproven Payer — a newly listed company that has established a distribution habit in its very first year but has no track record across a full business cycle.
It is neither a Consistent Payer (that requires years of data) nor an Irregular Payer (there is nothing irregular yet). The honest answer is that there is not enough history to classify, and investors should treat the FY26 pattern as a starting data point, not a policy.
One Structural Detail Worth Noting
The interim dividend of ₹2 cost ₹4.43 crore, implying roughly 2.22 crore shares were entitled at that time. The final dividend at ₹3 will cost approximately ₹6.53 crore on the 2.18 crore shares outstanding at 31 March 2026. The share count fell during the year because the company’s ESOP Trust purchased shares from the open market, and those treasury shares are deducted from equity. This is a small but real detail: treasury shares do not receive dividends, which marginally reduces total outflow.
Financial Performance Analysis
The Headline That Does Not Match the Business
FY26 net profit rose 2.41% to ₹52.92 crore. That looks like modest growth. It is not. Strip out other income and the picture reverses completely.
Core operating profit (revenue minus all operating expenses) fell 13.54%, from ₹68.39 crore to ₹59.13 crore. Profit before tax stayed flat only because other income exploded from ₹1.76 crore to ₹11.12 crore — a rise of 533%. That ₹9.37 crore swing is almost entirely interest and investment gains on IPO money parked in deposits and mutual funds. It is not operating performance.
FY26 vs FY25 — Full Year (₹ Crore)
| Particulars | FY26 | FY25 | Change |
|---|---|---|---|
| Revenue from Operations | 273.88 | 252.26 | +8.57% |
| Other Income | 11.12 | 1.76 | +533% |
| Employee Benefits Expense | 78.52 | 73.90 | +6.24% |
| Other Expenses | 123.27 | 96.53 | +27.70% |
| Finance Costs | 3.19 | 4.29 | −25.77% |
| Depreciation & Amortisation | 9.77 | 9.15 | +6.84% |
| Core Operating Profit | 59.13 | 68.39 | −13.54% |
| Profit Before Tax | 70.25 | 70.14 | +0.16% |
| Net Profit After Tax | 52.92 | 51.67 | +2.41% |
| Basic EPS (₹) | 24.97 | 25.53 | −2.19% |
All figures converted from the audited statement (INR lakhs) to ₹ crore. Core Operating Profit = Revenue from Operations minus Total Expenses, i.e. excluding other income.
Operating Leverage: Working in Reverse
Healthy operating leverage means profits grow faster than revenue. JARO delivered the opposite in FY26:
- Revenue growth: +8.57%
- EBITDA (operating, pre-D&A and interest): −11.90%, from ₹81.83 Cr to ₹72.09 Cr
- Core operating profit: −13.54%
Operating margin compressed by 552 basis points, from 27.11% to 21.59%. Every rupee of extra revenue in FY26 came with more than a rupee of extra cost.
Where the Margin Went: Other Expenses
The single cause is Other Expenses, up ₹26.74 crore or 27.70% — more than triple the pace of revenue growth. Employee cost, by contrast, rose a disciplined 6.24%, below revenue growth.
Note 4 of the results gives the probable explanation: of the IPO proceeds, ₹36.19 crore was spent on marketing, brand building and advertising against an allocation of ₹81 crore. In an EdTech enrolment business, marketing spend flows straight into other expenses. The company is buying revenue growth of 8.57% with marketing spend growth far in excess of it — a customer acquisition economics question investors should track quarterly.
Q4 FY26: The Quarter Behind the “PAT Up 17%” Headline
Media coverage in May 2026 reported Q4 net profit rising 17.33% to ₹21.33 crore, and the stock jumped 14.54%. The underlying quarter tells a different story:
- Q4 revenue from operations: ₹72.79 Cr vs ₹74.12 Cr — a decline of 1.80% year on year
- Q4 core operating profit: ₹18.43 Cr vs ₹24.15 Cr — down 23.69%
- Q4 other income: ₹9.06 Cr vs ₹0.57 Cr
- Q4 current tax: ₹0.82 Cr vs ₹1.46 Cr, further flattering the bottom line
In plain language: the operating business shrank in Q4, and profit rose because of treasury income on IPO cash and a lower current tax charge. This is the most important finding in the FY26 results and it deserves to be stated clearly.
Cash Flow Analysis
Cash Flow Summary (₹ Crore)
| Particulars | FY26 | FY25 |
|---|---|---|
| Operating Profit before Working Capital | 73.98 | 84.09 |
| Cash Generated from Operations | 60.36 | (17.15) |
| Net Operating Cash Flow (OCF) | 57.45 | (23.45) |
| Capital Expenditure (PPE Purchase) | (0.85) | (4.12) |
| Free Cash Flow (OCF − Capex) | 56.60 | (27.57) |
| Net Investing Cash Flow | (111.64) | (4.09) |
| Net Financing Cash Flow | 73.06 | 14.19 |
| Dividend Paid | (4.34) | (1.52) |
| Closing Cash & Equivalents | 23.95 | 5.08 |
OCF vs Net Profit: A Genuine Improvement
FY26 OCF of ₹57.45 crore against PAT of ₹52.92 crore gives a cash conversion ratio of 1.09x. Profits turned into cash. That is a real positive and a sharp reversal from FY25, when the company reported ₹51.67 crore of PAT but burned ₹23.45 crore of operating cash — a conversion ratio of negative 0.45x.
The turnaround driver is visible: trade receivables released ₹22.54 crore of cash in FY26 after absorbing ₹22.70 crore in FY25.
Receivables vs Revenue: The Good News
Revenue grew 8.57% while trade receivables fell 62.21%, from ₹36.22 crore to ₹13.69 crore. Debtor days improved from roughly 31 days to 18 days.
This is the correct direction and suggests either tighter collection discipline or a shift toward upfront student payments. It is one of the strongest data points in the FY26 accounts and it directly underpins the dividend’s cash affordability.
The Line Item Nobody Is Talking About
While receivables improved, “Other non-current and current assets” consumed ₹48.82 crore of operating cash in FY26 — the single largest working capital outflow in the statement, and larger than the entire receivables benefit.
On the balance sheet, Other Current Assets rose from ₹197.80 crore to ₹246.62 crore, up ₹48.82 crore or 24.68% — growing nearly three times faster than revenue, and now representing 57.5% of total assets.
The board meeting outcome does not break down what sits inside this line. Given the business model of partnering with 36 institutions including IIMs and IITs, it plausibly includes advances to university partners and prepaid programme costs — but the composition is Not Disclosed by Company in this filing. It is the first thing an investor should look for in the FY26 Annual Report. A line item worth ₹246 crore in a company with a market capitalisation near ₹1,100 crore is not a footnote.
How Is This Dividend Funded?
This matters more than the yield. The four possibilities and the verdict:
Funded by current earnings — YES
FY26 FCF of ₹56.60 Cr covers the ₹6.53 Cr final dividend 8.66 times. Total FY26 dividend of ₹10.97 Cr is covered 5.16 times.
Funded by cash reserves — NOT NEEDED
Cash and investments of ₹144.51 Cr are available but are not required to fund this payout.
Funded by asset sales — NO
Proceeds from sale of PPE in FY26: ₹0.02 crore. Immaterial.
Funded by borrowings — NO
The company repaid ₹50.53 Cr of current borrowings and ₹0.20 Cr of non-current borrowings in FY26. Debt went down, not up.
Verdict: the dividend is funded out of genuine operating cash flow. That is the strongest single argument in its favour, and it stands independent of the margin concerns raised above.
Balance Sheet Strength
Liquidity Position as at 31-03-2026 (₹ Crore)
| Current Investments | 70.48 |
| Cash & Cash Equivalents | 23.95 |
| Other Bank Balances (Fixed Deposits) | 50.09 |
| Total Cash & Investments | 144.51 |
| Total Borrowings (current + non-current) | 0.38 |
| Lease Liabilities | 7.40 |
| Net Cash Position | +136.73 |
Structural Strength
| Total Assets | ₹428.81 Cr |
| Total Equity | ₹360.43 Cr |
| Total Liabilities | ₹68.39 Cr |
| Debt-to-Equity Ratio | 0.001x |
| Current Ratio | 10.08x |
| Return on Equity (avg equity) | 19.89% |
| Return on Capital Employed (closing) | 19.95% |
ROE computed on average equity of ₹265.99 Cr; matches the 19.89% figure reported by third-party data providers. ROCE = (PBT + finance costs) ÷ closing capital employed.
Reading Between the Lines
Total equity more than doubled from ₹171.55 crore to ₹360.43 crore. This was not earned — it was raised. Of the increase, ₹170 crore came from the fresh issue of equity in the IPO, offset by ₹12.52 crore of issue transaction costs and ₹18.69 crore of treasury share purchases by the ESOP Trust.
This has a mechanical consequence for returns: with equity doubling and profit growing only 2.41%, ROE on closing equity falls to 14.68%. The reported 19.89% uses the average of opening and closing equity and therefore flatters a year in which capital arrived mid-way. Unless earnings scale materially, FY27 ROE will print lower simply because the full-year equity base is now much larger.
Separately, the company cleared ₹50.73 crore of borrowings during FY26 — current borrowings fell from ₹50.73 crore to ₹0.20 crore, in line with the IPO objective of prepaying ₹45 crore of debt, which the company reports as fully utilised. Finance costs consequently dropped 25.77%.
Unutilised IPO Proceeds
As at 31 March 2026, ₹50.80 crore of the ₹170 crore fresh issue remained unspent — including ₹44.81 crore of the ₹81 crore earmarked for marketing and brand building. The company states ₹50 crore of unutilised proceeds sits in bank fixed deposits. This is the source of the treasury income that carried FY26 profit. It also means the marketing spend that already compressed margins by 552 bps has more than half its budget still to come. Investors should expect continued pressure on the other-expenses line.
Dividend Sustainability Analysis
Four-Factor Test
| Factor | Evidence | Assessment |
|---|---|---|
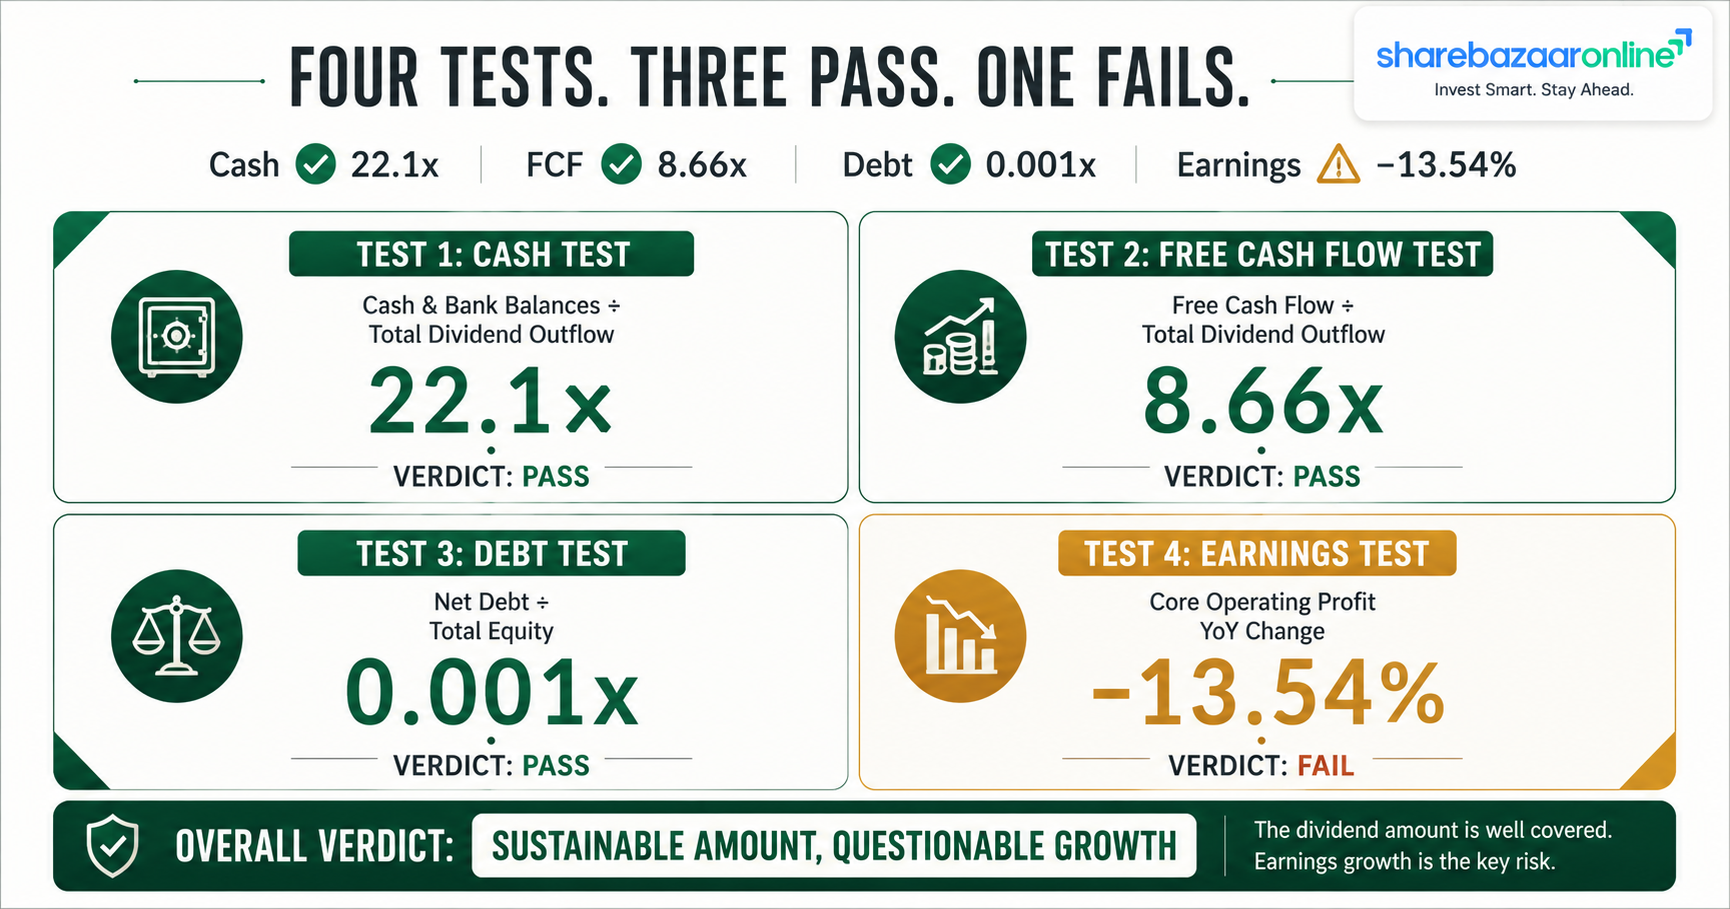
| Cash Position | ₹144.51 Cr cash & investments vs ₹6.53 Cr outflow — 22.1x cover | Very Strong |
| Free Cash Flow | FCF ₹56.60 Cr; final dividend covered 8.66x, full-year dividend 5.16x | Strong |
| Debt Position | Borrowings cut from ₹51.11 Cr to ₹0.38 Cr; D/E 0.001x | Very Strong |
| Earnings Trend | Core operating profit −13.54%; margin −552 bps; Q4 revenue −1.80% | Deteriorating |
Classification: Sustainable
On the numbers, the FY26 dividend is Sustainable. A payout ratio of 20.72% is conservative, cash cover is enormous, and there is effectively no debt competing for the same rupees. Even if operating profit halved from here, the ₹10.97 crore annual outflow would still be comfortably affordable.
But sustainability of the amount is not the same as growth of the amount. The dividend is safe because it is small relative to the balance sheet — not because the business is compounding. Three things would need to hold for the payout to grow meaningfully from ₹5 per share:
- Marketing spend must start converting. Other expenses rose 27.70% to produce 8.57% revenue growth. That ratio has to invert.
- Operating margin must stabilise. At 21.59% versus 27.11% a year ago, the trend line is the wrong shape.
- Treasury income must be replaced by operating income. The ₹11.12 Cr of other income is a one-off benefit of holding IPO cash. As that cash is deployed into marketing, this income falls away — and the operating business has to fill the gap.
In short: the dividend is not at risk. The dividend’s growth is.
Peer Comparison
Listed Education & Training Sector
| Company | Dividend Yield | Payout Ratio | Balance Sheet |
|---|---|---|---|
| Jaro Institute (JARO) | 1.00% | 20.72% | Net cash ₹136.73 Cr, D/E 0.001x |
| NIIT Learning Systems | 0.91% – 0.95% | ~18.9% | Net cash; ₹3 DPS annually, growing since 2023 |
| Broad Services Sector Average | ~0.49% | Not Disclosed by Company | — |
| Aptech Ltd | Not Disclosed by Company | Not Disclosed by Company | Historic dividend payer; verify current data |
| Career Point, Veranda Learning, Zee Learn | Not Disclosed by Company | Not Disclosed by Company | Not consistent dividend payers |
NIIT Learning Systems yield and payout data from TipRanks and Investing.com (April–July 2026); services sector average yield of 0.489% per TipRanks sector data. Peer figures move daily — readers should verify against live exchange data before use. Where we could not verify a figure to an identifiable source, we have written “Not Disclosed by Company” rather than estimate.
Where JARO Stands Out
Against its closest listed comparable, JARO’s 1.00% full-year yield edges above NIIT Learning Systems’ ~0.91%, and its 20.72% payout is modestly higher than NIIT Learning’s ~18.9%. Both sit roughly double the broad services sector average of about 0.49%. On balance sheet, JARO’s effectively debt-free position with ₹144.51 crore of cash is a genuine differentiator in a sector where several players carry leverage.
The Honest Caveat
Indian listed education is a thin and heterogeneous peer set. NIIT Learning Systems is a corporate B2B training business; Career Point is exam coaching; Zee Learn runs physical schools. JARO’s model — online degrees delivered in partnership with IIMs, IITs and other universities — does not map cleanly onto any of them. Peer yield comparison here is directional at best, and anyone treating it as a valuation anchor is over-reading the data.
Promoter Impact Analysis
Shareholding Pattern (March 2026)
| Promoter & Promoter Group | 57.28% |
| FII / FPI | 0.80% |
| DII | 4.80% |
| Public & Others | 37.12% |
Promoter holding per Torus Digital (57.28%, March 2026 quarter, down from 57.33% in December 2025). FII/DII/public split per Share.Market data (June 2026). Figures may differ marginally across providers depending on treatment of treasury shares.
Dividend Distribution Split
| Promoter share of final dividend | ₹3.74 Cr |
| Minority / public share of final dividend | ₹2.79 Cr |
| Promoter share of full FY26 dividend | ₹6.28 Cr |
| Institutional (FII + DII) share of final | ₹0.37 Cr |
Is This a Promoter-Skewed Payout?
By construction, 57.28% of every rupee distributed goes to the promoter group — that is simply the ownership arithmetic and applies to every Indian company with a concentrated promoter. The relevant question is whether the payout size is disproportionate to the company’s needs, which would signal cash extraction.
Here it does not appear so. At ₹6.53 crore, the final dividend is 1.8% of total equity and 4.5% of the cash pile. A promoter seeking to extract capital would push the payout ratio far above 20.72%. The evidence points the other way: promoters have been buying shares in the open market — Sanjay Salunkhe added 15,326 shares on 12 June 2026, raising his holding to 1,23,74,766 shares.
Minority shareholder perspective: the public float of 37.12% receives ₹2.79 crore from the final dividend. For a retail investor holding 100 shares, the gross entitlement is ₹300. The dividend is a symbolic commitment to shareholder returns, not a material cash event for small holders.
Taxation Analysis
How Dividends Are Taxed in India
Since 1 April 2020, the Dividend Distribution Tax paid by companies was abolished. Dividends are now taxable in the hands of the shareholder, added to total income and taxed at the individual’s applicable slab rate under the head “Income from Other Sources”.
- TDS under Section 194: the company deducts 10% TDS before paying, if total dividend from that company in the financial year exceeds the prescribed threshold. Resident individuals below the threshold receive the dividend without deduction.
- No PAN on record: TDS rises to 20%.
- Form 15G / 15H: shareholders whose total income falls below the taxable limit may submit these forms to the RTA before the record date to avoid TDS.
- Non-resident shareholders: TDS at 20% plus applicable surcharge and cess, subject to relief under an applicable Double Taxation Avoidance Agreement with valid Tax Residency Certificate and Form 10F.
- Credit for TDS: tax deducted appears in Form 26AS and can be claimed against the final liability when filing the return.
- Interest deduction: interest expense on money borrowed to invest may be claimed against dividend income, capped at 20% of the dividend.
Worked Example — The Standard Case
Investor holds 1,000 shares, dividend of ₹10 per share, tax slab 30%:
| Gross Dividend (1,000 × ₹10) | ₹10,000 |
| TDS deducted at source @10% | ₹1,000 |
| Amount credited to bank account | ₹9,000 |
| Total tax liability @30% slab | ₹3,000 |
| Additional tax payable at filing (₹3,000 − ₹1,000) | ₹2,000 |
| Net Dividend in Hand | ₹7,000 |
| Effective retention | 70% of gross |
Surcharge and 4% health and education cess are excluded for simplicity and would raise the effective rate for higher income brackets.
Applied to JARO’s Actual ₹3 Final Dividend
| Shares Held | Gross Dividend | Tax @30% | Net in Hand | Post-Tax Yield |
|---|---|---|---|---|
| 100 | ₹300 | ₹90 | ₹210 | 0.42% |
| 1,000 | ₹3,000 | ₹900 | ₹2,100 | 0.42% |
| 5,000 | ₹15,000 | ₹4,500 | ₹10,500 | 0.42% |
The key takeaway: for a 30%-slab investor, JARO’s 0.60% gross final dividend yield becomes an effective 0.42% post-tax. On the full FY26 dividend of ₹5, the 1.00% gross yield becomes 0.70% post-tax. Investors chasing the record date for the dividend alone should weigh this against the transaction costs and the price adjustment that typically occurs on the ex-date.
Key Risks
1. Marketing Spend Is Not Converting Efficiently
Other expenses rose 27.70% to deliver revenue growth of 8.57%. With ₹44.81 crore of the marketing budget still unspent, this pressure continues into FY27. If customer acquisition cost keeps rising faster than enrolments, margins compress further.
2. Profit Quality Is Deteriorating
FY26 PBT was flat only because other income rose 533% to ₹11.12 crore. This is treasury income on IPO cash. As that cash is deployed, this income disappears — and core operating profit is already falling 13.54%. FY27 reported profit faces a headwind from both directions.
3. Revenue Declined in Q4 FY26
Q4 revenue fell 1.80% year on year to ₹72.79 crore, and Q4 core operating profit dropped 23.69%. The most recent quarter is the weakest data point available, not the strongest. One quarter is not a trend — but it is the latest evidence.
4. Opaque ₹246 Crore Asset Line
Other Current Assets grew 24.68% to ₹246.62 crore — 57.5% of the entire balance sheet and the biggest working capital drain in FY26. Composition is Not Disclosed by Company in the results filing. Any impairment or slow recovery here would matter far more than the dividend.
5. Single-Segment, Single-Geography Concentration
Note 5 confirms the company operates in one reportable segment and has no reportable geographical segments — operations are entirely domiciled in India. There is no diversification buffer if Indian online higher-education demand or regulation shifts.
6. University Partner Dependency
The business model depends on partnerships with 36 institutions including 7 IIMs and 7 IITs. Programme approvals for online degrees are subject to UGC and regulatory frameworks that can change. Loss or non-renewal of a marquee partner would directly affect enrolment appeal and pricing power.
7. Short Listing History and Price Volatility
The stock has traded for under ten months and has moved between ₹890 and ₹383.50 in that window — a peak-to-trough drawdown of 57%. Average weekly movement is materially above the market average. A 0.60% dividend provides no cushion against this volatility.
8. Equity Dilution and ROE Compression
Equity more than doubled to ₹360.43 crore while profit grew 2.41%. ROE on closing equity is 14.68% versus the 19.89% average-equity figure widely quoted. FY27 ratios will reflect the full enlarged base. Ongoing ESOP allotments add further dilution.
What To Monitor
1. Other Expenses as % of Revenue
FY26 baseline: 45.01% of revenue, up from 38.27% in FY25. Watch each quarter. A fall back toward 40% would signal marketing efficiency returning. A rise above 47% would confirm the acquisition cost problem is structural.
2. Revenue Excluding Other Income
Ignore total income headlines. Track revenue from operations alone against the Q4 FY26 base of ₹72.79 crore. Two consecutive quarters of year-on-year decline would change the growth thesis entirely.
3. Other Current Assets Movement
Now ₹246.62 crore. Look for the FY26 Annual Report breakdown and check whether this line grows faster than revenue again in FY27. Rising unexplained assets alongside flat cash generation is a classic warning pattern.
4. Deployment of the Remaining ₹50.80 Crore IPO Money
Quarterly monitoring reports to the exchanges disclose utilisation. Watch whether the ₹44.81 crore marketing balance produces measurable enrolment growth, or simply repeats FY26’s pattern of cost outpacing revenue.
5. Operating Cash Flow Conversion
FY26 OCF/PAT was 1.09x after being negative 0.45x in FY25. Much of the improvement came from a one-time receivables release of ₹22.54 crore, which cannot repeat at that scale. Sustaining conversion above 0.8x in FY27 would be the real proof.
6. Debtor Days
Improved from roughly 31 days to 18 days. If this reverses, it may indicate the company is extending credit to sustain enrolment numbers — a red flag that typically precedes revenue quality problems in education businesses.
7. Promoter Shareholding Trend
Currently 57.28%, with promoters buying in the open market during June 2026. Continued accumulation is a constructive signal; any pledge creation or sustained selling in quarterly filings would be the opposite.
8. FY27 Dividend Policy Signal
Whether the board declares another interim dividend around Q3 FY27 will indicate if the FY26 pattern was a policy or a one-off listing-year gesture. Watch also for a formal dividend distribution policy in the FY26 Annual Report.
Conclusion
What Is Working
- Dividend is funded entirely by operating cash flow, not by debt, asset sales or reserves — FCF cover of 8.66x.
- Payout ratio of 20.72% leaves substantial headroom; even a severe earnings decline would not threaten the payout.
- Balance sheet is effectively debt-free: borrowings cut from ₹51.11 Cr to ₹0.38 Cr, net cash of ₹136.73 Cr.
- Operating cash flow swung from negative ₹23.45 Cr to positive ₹57.45 Cr — a genuine improvement in cash discipline.
- Debtor days nearly halved, from ~31 to ~18 days.
- IPO objectives are being met: ₹45 crore of debt prepayment fully executed, and the auditor issued an unmodified opinion.
- Promoters have been buying in the open market, not selling.
What Is Not
- Core operating profit fell 13.54% despite revenue rising 8.57% — the business got less profitable, not more.
- Flat PBT was manufactured by a 533% jump in other income from IPO cash, which is not repeatable.
- Operating margin compressed 552 basis points, from 27.11% to 21.59%.
- Q4 revenue actually declined 1.80% year on year while the reported PAT headline showed +17.33%.
- ₹246.62 crore sits in an undisclosed “Other Current Assets” line — 57.5% of total assets.
- EPS fell 2.19% despite PAT rising, because of equity dilution.
- The yield improved because the price fell 44% from IPO, not because the dividend grew.
The Balanced View
JARO’s ₹3 final dividend is a safe, small, well-funded payout from a company with a fortress balance sheet and a softening operating business. Those two facts sit side by side and neither cancels the other.
For an income-focused investor, a 0.60% gross yield falling to 0.42% after tax at the 30% slab is not a reason to own this share. For anyone evaluating the company on its merits, the dividend is a secondary data point — useful mainly as evidence that the business generates real cash, which the FY26 cash flow statement confirms.
The decision that matters is not about the dividend. It is about whether the ₹44.81 crore of remaining marketing spend can restore growth without permanently resetting margins below 22%. That question will be answered in the FY27 quarterly results, not at the record date. We present the evidence; the conclusion is the reader’s to draw.
Frequently Asked Questions
What dividend has Jaro Institute announced for FY 2025-26?
What is the dividend yield on JARO shares?
What is the record date for the Jaro Institute final dividend?
What is the ex-date and what does it mean for buyers?
When will the Jaro Institute dividend be paid?
Who is eligible to receive this dividend?
How is this dividend taxed in my hands?
Is the Jaro Institute dividend sustainable?
What is Jaro Institute’s dividend history?
What should investors monitor after this dividend?
Why did net profit rise only 2.41% when revenue grew 8.57%?
Does Jaro Institute have any debt concerns?
How much of this dividend goes to the promoters?
Should I buy JARO shares just for this dividend?
Are these standalone or consolidated results?
Disclaimer
This article is published by ShareBazaar Online for informational and educational purposes only. It does not constitute investment advice, a recommendation, or an offer or solicitation to buy or sell any security. ShareBazaar Online does not provide buy, sell or hold recommendations.
All company financial data is sourced from the audited financial results and board meeting outcome filed by Jaro Institute of Technology Management and Research Limited with BSE Limited and the National Stock Exchange of India Limited on 7 May 2026. Market prices, shareholding patterns, peer data and corporate action dates are sourced from stock exchange records and third-party financial data providers as cited within the article, and were accurate as at the time of writing. Market data changes continuously and readers must verify current figures independently.
All ratios, growth rates and coverage metrics have been computed by ShareBazaar Online from disclosed figures. Where information was not available in company filings, we have stated “Not Disclosed by Company” rather than estimate. The recommended final dividend is subject to shareholder approval at the Annual General Meeting and may be altered or withheld.
Investments in securities are subject to market risks. Past performance is not indicative of future results. Tax treatment depends on individual circumstances and may change; readers should consult a qualified chartered accountant or tax adviser. ShareBazaar Online is not a SEBI-registered investment adviser or research analyst. Readers should consult a SEBI-registered adviser before making any investment decision.
ShareBazaar Online and its authors hold no position in the securities discussed at the time of publication.
Explore More Investment Opportunities
Discover IPOs, unlisted shares, and broker comparison tools curated for smart investors.