
Dividend Status: Ex-Date Passed — Payment Pending
Eligibility for this dividend has already closed.
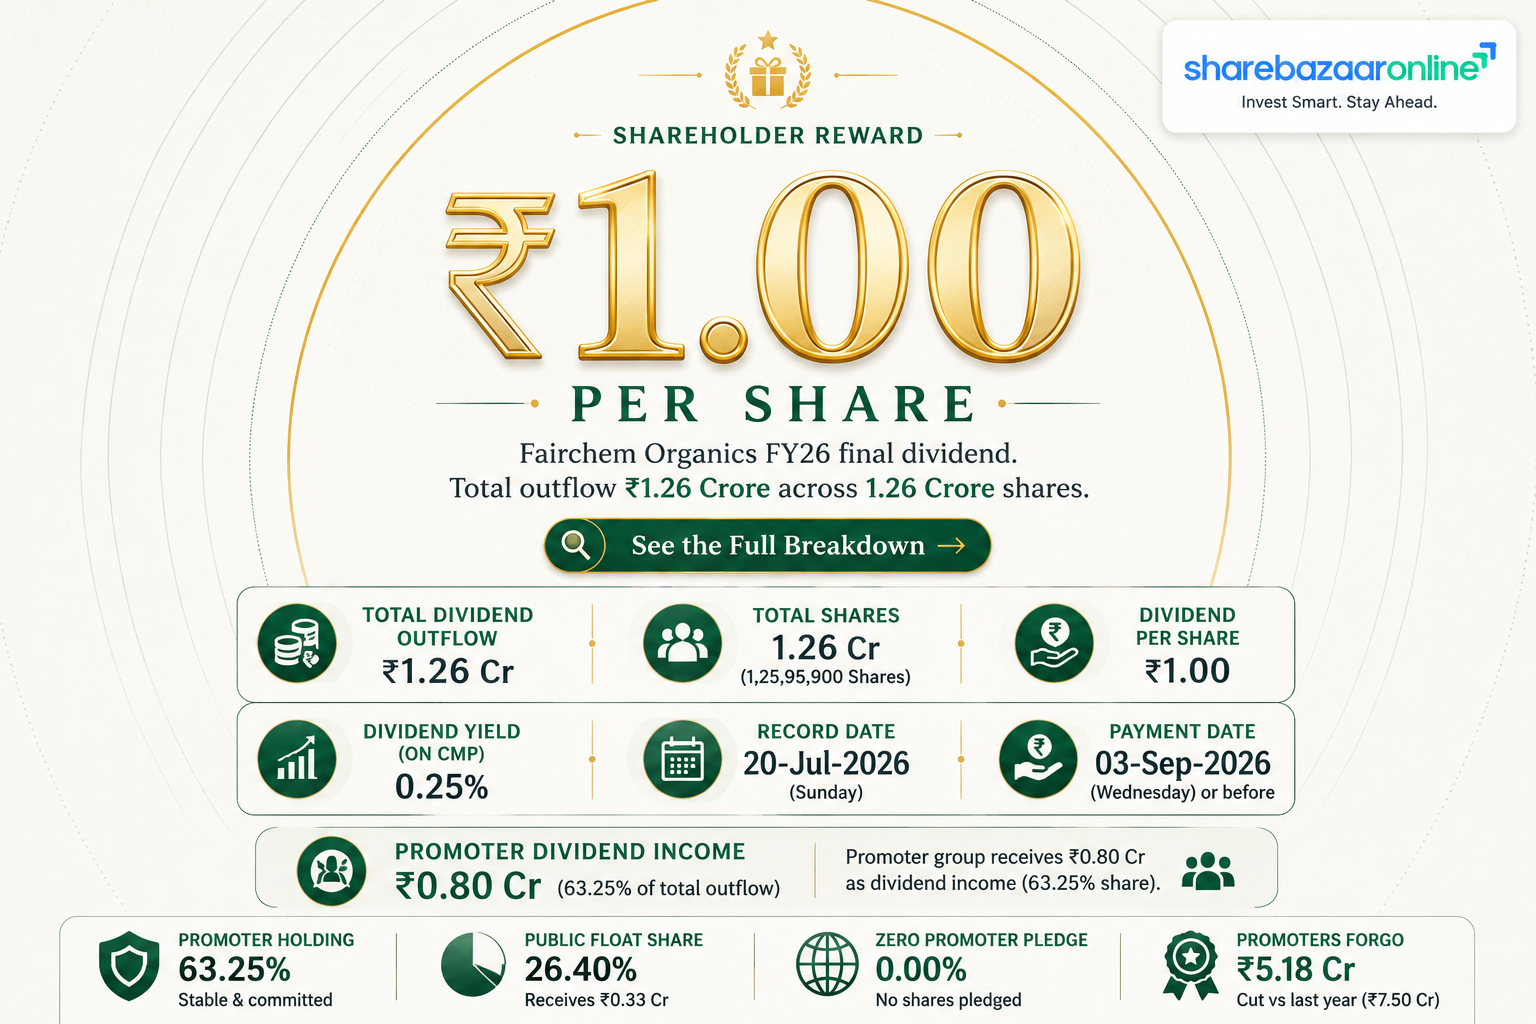
Fairchem Organics Limited fixed Monday, 20 July 2026 as the Record Date. Under India's T+1 settlement cycle, the Ex-Date and the Record Date fall on the same trading day. Investors buying the share on or after 20 July 2026 are not entitled to this dividend.
The dividend of ₹1.00 per share is still subject to shareholder approval at the 7th Annual General Meeting scheduled for Monday, 27 July 2026. Payment is expected on or around 26 August 2026. This article is therefore a post-event analysis, not a forthcoming dividend opportunity.
The single most important fact in this announcement is not the dividend itself. It is the size of the cut. Fairchem Organics paid ₹7.50 per share for FY2024-25. For FY2025-26 the Board has recommended ₹1.00 per share — a reduction of 86.7%.
Dividend Snapshot
Company & Security Details
| Company Name | Fairchem Organics Limited |
| NSE Symbol | FAIRCHEMOR |
| BSE Scrip Code | 543252 |
| ISIN | INE0DNW01011 |
| CIN | L24200GJ2019PLC129759 |
| Sector | Speciality Chemicals (Oleo & Nutraceuticals) |
| Promoter Group | Fairfax India / FIH Group |
Dividend Details
| Dividend Type | Final Dividend |
| Dividend Per Share | ₹1.00 |
| Dividend Percentage | 10% |
| Face Value | ₹10.00 |
| Financial Year | FY 2025-26 |
| Shares Outstanding | 1,25,95,900 |
| Total Dividend Outflow | ₹1.26 Crore |
| AGM Approval Required | Yes — 7th AGM, 27 July 2026 |
How we arrived at the share count
The company's audited results show paid-up equity share capital of ₹1,259.59 Lakhs at a face value of ₹10 per share. Dividing gives 1,25,95,900 shares. Multiplying by ₹1.00 per share gives a total cash outflow of ₹1.26 Crore. Note that share capital fell from ₹1,302.09 Lakhs a year earlier because 4,25,000 shares were extinguished in the January 2026 buyback.
Dividend Announcement Summary
The Board of Directors of Fairchem Organics Limited met on Wednesday, 6 May 2026 through audio-visual means. The meeting began at 12:30 p.m. and ended at 2:50 p.m. Two decisions matter to shareholders.
First, the Board approved the audited financial results for the quarter and financial year ended 31 March 2026. Statutory auditors B S R and Co, Chartered Accountants, issued an unmodified opinion — meaning no qualifications, reservations, or adverse findings were raised.
Second, the Board recommended a dividend of 10%, i.e. ₹1.00 per equity share on a face value of ₹10, subject to shareholder approval at the ensuing 7th AGM.
What "10% dividend" actually means
Indian companies quote dividends as a percentage of face value, not of the share price. Fairchem's face value is ₹10. A 10% dividend therefore equals ₹1.00 per share — not 10% of the ₹677.75 market price. This is one of the most common misreadings in Indian retail investing, and here it matters enormously: the actual yield is roughly 0.15%, not 10%.
Other board decisions
- Re-appointment of Shri Sudhin Choksey as Independent Director for a second term (11 Feb 2027 to 10 Feb 2032), subject to member approval.
- 7th AGM fixed for Monday, 27 July 2026 via video conferencing.
- Register of Members and Share Transfer Books closed 21 July 2026 to 27 July 2026 (both days inclusive).
- Remote e-voting window: 22 July to 26 July 2026. (Source: company AGM public notice, June 2026)
Key Dates Timeline
| Event | Date | Status |
|---|---|---|
| Board Meeting / Announcement | 06-05-2026 | Completed |
| Ex-Date | 20-07-2026 | Passed |
| Record Date | 20-07-2026 | Today / Passed |
| Book Closure Begins | 21-07-2026 | Upcoming |
| 7th Annual General Meeting | 27-07-2026 | Upcoming — approval pending |
| Expected Payment Date | 26-08-2026 | Pending |
Announcement, record date and book closure dates are from the company's filing of 6 May 2026. The expected payment date of 26 August 2026 is reported by market data providers and is not stated in the board meeting outcome filing itself; shareholders should treat it as indicative until the company confirms.
Why the ex-date and record date are the same
Older articles will tell you the ex-date is "two business days before the record date". That guidance is outdated. Since Indian equities moved to a T+1 settlement cycle, a trade settles the very next working day. The exchanges therefore now set the ex-date on the same day as the record date. To have received this dividend, you needed to buy the share on or before 17 July 2026 (the last trading day before 20 July).
Dividend Yield Analysis
Yield Computation
| Dividend Per Share | ₹1.00 |
| Market Price (mid-July 2026) | ₹677.75 |
| Current Dividend Yield | 0.15% |
| Closing price on announcement day (06-05-2026) | Not Disclosed by Company |
| Prior-year yield (₹7.50 on ~₹700) | ≈1.07% |
Market price of ₹677.75 as referenced in third-party coverage during the week of 13–17 July 2026. Prior-year yield of 1.07% as reported by Business Standard against the 04-Aug-2025 record date dividend of ₹7.50.
Yield Reality Check
A falling yield can come from a rising share price or a shrinking dividend. Here it is unambiguously the second.
The share price is down roughly 24-33% over one year depending on the measurement date. A falling price, on its own, would have raised the yield. Instead the yield collapsed from about 1.07% to 0.15% — an 86% decline — because the dividend itself was cut by 86.7%.
In plain terms: this is a weak-business yield story, not a value opportunity. An investor holding 1,000 shares worth roughly ₹6.78 Lakh receives ₹1,000 in dividend income for the full year.
Context: 0.15% versus a savings account
A standard savings bank account in India pays roughly 2.7% to 3.5%. This dividend yield is approximately one-twentieth of that. Anyone who bought Fairchem Organics in the last week purely to capture this dividend earned a return that is, for practical purposes, rounding error against the daily price movement of the stock — which routinely swings 2-3% in a session.
Dividend History Analysis
Dividend Track Record Since Listing
| Financial Year | Dividend Per Share | Type | Change |
|---|---|---|---|
| FY 2020-21 | ₹3.50 | Final | First payout |
| FY 2021-22 | Not Disclosed by Company | Final | — |
| FY 2022-23 | Not Disclosed by Company | Final | — |
| FY 2023-24 | ₹7.50 | Final | — |
| FY 2024-25 | ₹7.50 | Final | Flat |
| FY 2025-26 | ₹1.00 | Final | -86.7% |
The FY24 and FY25 figures of ₹7.50 are corroborated by the audited cash flow statement, which shows "Dividend Paid" of ₹976.57 Lakhs in both FY26 and FY25. Against roughly 1.30 Crore shares that works out to ₹7.50 per share in each year. Fairchem Organics listed only in 2020-21 following the demerger from Fairchem Speciality Limited, so a full ten-year dividend record does not exist.
Classification: Irregular Payer
Fairchem Organics does not qualify as a consistent dividend payer. In a track record spanning only six years, the company has already delivered a cut of 86.7% in a single step. Independent dividend trackers had flagged instability in the payout pattern even before this cut.
A company that cuts once is statistically more likely to cut again. Investors buying this stock for income should treat the payout as discretionary and earnings-linked, not as a floor.
Special dividends and suspensions
No special dividend has been declared in the period reviewed. No dividend suspension has occurred — the company has continued to pay something every year, which is worth noting. The FY26 dividend is a severe reduction rather than a skip.
Separately, the company returned capital through a ₹34 Crore tender-offer buyback in January 2026 at ₹800 per share. That is a different capital return channel, and it is central to understanding this year's dividend decision.
Financial Performance Analysis
FY2025-26 Audited Results (Standalone)
| Particulars | FY26 (₹ Cr) | FY25 (₹ Cr) | Change |
|---|---|---|---|
| Revenue from Operations | 459.65 | 537.90 | -14.5% |
| Total Income | 460.95 | 539.24 | -14.5% |
| EBITDA (derived) | 22.04 | 44.12 | -50.0% |
| Profit Before Exceptional Items & Tax | 8.20 | 29.92 | -72.6% |
| Exceptional Item (Labour Codes provision) | 0.88 | — | New |
| Profit Before Tax | 7.32 | 29.92 | -75.5% |
| Net Profit After Tax | 5.54 | 21.97 | -74.8% |
| Basic EPS (₹) | 4.28 | 16.88 | -74.6% |
| Net Worth | 263.04 | 302.03 | -12.9% |
All figures converted from the company's reported ₹ Lakhs to ₹ Crore. EBITDA is derived as Profit Before Tax + Finance Costs + Depreciation and Amortisation, and is a ShareBazaar Online computation, not a company-disclosed figure. Fairchem Organics has no subsidiary, associate or joint venture as on 31 March 2026, so standalone results are the consolidated position.
Operating Leverage: revenue fell 14.5%, profit fell 74.8%
This is the defining feature of the year. Revenue declined by roughly one-seventh. Net profit declined by three-quarters. The gap between those two numbers is negative operating leverage — the company's cost base did not shrink as fast as its sales.
The line-by-line breakdown explains exactly why:
| Cost Head | FY26 (₹ Cr) | FY25 (₹ Cr) | Change |
|---|---|---|---|
| Cost of Materials Consumed | 374.19 | 419.75 | -10.9% |
| Employee Benefits Expense | 22.83 | 23.89 | -4.4% |
| Power and Fuel | 23.15 | 35.18 | -34.2% |
| Finance Costs | 3.70 | 3.67 | +0.8% |
| Depreciation & Amortisation | 11.02 | 10.53 | +4.6% |
| Other Expenses | 24.94 | 34.40 | -27.5% |
Two cost lines rose while revenue fell 14.5%: depreciation, up 4.6%, and finance costs, up 0.8%. These are fixed charges tied to the asset base and the borrowings, and they do not flex with sales. Depreciation and interest together consumed ₹14.72 Crore — nearly 2.7 times the entire year's net profit of ₹5.54 Crore.
Cost of materials fell 10.9% against a 14.5% revenue decline. Because raw material cost did not fall as fast as sales, gross margin compressed. In an oleo-chemicals business built on processing by-products of edible-oil refining, this is the classic signature of a spread squeeze: input prices held up while realisations weakened.
The one bright spot: Q4
Q4 FY26 net profit came in at ₹3.69 Crore versus ₹0.59 Crore in Q4 FY25 — a sharp sequential and year-on-year recovery, on revenue of ₹116.93 Crore versus ₹120.78 Crore.
Put differently, ₹3.69 Crore of the full-year ₹5.54 Crore profit, or about 67%, came in the final quarter alone. Power and fuel cost in Q4 dropped to ₹6.05 Crore from ₹8.05 Crore. Whether this reflects a durable margin turn or a favourable quarter is the single most important thing to watch in FY27.
The exceptional item explained
The company recognised ₹0.88 Crore as an exceptional item. This is an additional employee benefit obligation arising from the Government of India's four new Labour Codes, including the Code on Wages 2019, effective 21 November 2025.
Management has classified it as regulatory-driven and non-recurring, based on actuarial valuation and ICAI guidance. The company has said it will continue to monitor Central and State Rules and will account for further effects as clarifications are issued — so the final gratuity and leave-encashment impact may not yet be fully booked.
Cash Flow Analysis
The most important positive in this filing
Reported profits are opinions. Cash is fact. And on cash, FY26 was dramatically better than FY25 — the exact opposite of what the profit line suggests.
Audited Cash Flow Statement
| Particulars | FY26 (₹ Cr) | FY25 (₹ Cr) |
|---|---|---|
| Profit Before Tax | 7.32 | 29.92 |
| Operating Profit Before Working Capital Changes | 21.59 | 44.40 |
| Trade Receivables movement | +18.07 | -29.27 |
| Inventories movement | -3.94 | -18.60 |
| Net Cash from Operating Activities | 41.60 | -16.78 |
| Purchase of PPE and Intangibles (Capex) | -15.34 | -26.11 |
| Net Cash used in Investing Activities | -13.74 | -25.50 |
| Short Term Borrowings (net) | +20.75 | +55.71 |
| Buyback of Equity Share Capital | -35.14 | — |
| Dividend Paid (for FY25's ₹7.50) | -9.77 | -9.77 |
| Interest Paid | -3.70 | -3.67 |
| Closing Cash and Cash Equivalents | 0.01 | 0.01 |
Operating Cash Flow versus Net Profit
FY26 net profit was ₹5.54 Crore. Operating cash flow was ₹41.60 Crore — a cash conversion of roughly 7.5 times reported profit.
The reason is straightforward: depreciation of ₹11.02 Crore is a non-cash charge, and the company released ₹18.07 Crore from trade receivables. Receivables fell from ₹86.13 Crore to ₹68.13 Crore while revenue fell 14.5% — meaning collections improved slightly faster than sales declined. That is a genuine positive on working capital discipline.
But read FY25 first
In FY25 the company reported a healthy net profit of ₹21.97 Crore — and yet operating cash flow was negative ₹16.78 Crore. Receivables ballooned by ₹29.27 Crore and inventories by ₹18.60 Crore. The company paid ₹9.77 Crore of dividend that year while generating no operating cash at all.
This is precisely why cash flow must be read alongside profit. FY25 looked like the good year and FY26 like the bad year on the profit line. On cash, the picture is exactly reversed.
How is this dividend being funded?
| Free Cash Flow (OCF ₹41.60 Cr − Capex ₹15.34 Cr) | ₹26.26 Crore |
| Dividend Outflow | ₹1.26 Crore |
| FCF Coverage of Dividend | 20.8 times |
| Cash & Cash Equivalents + Other Bank Balances | ₹1.23 Crore |
| Cash Coverage of Dividend | 0.97 times |
The dividend is comfortably funded by current-year free cash flow, not by borrowings or asset sales. On an FCF basis the coverage is exceptional.
However — and this is a finding worth flagging prominently — the company's balance-sheet cash is only ₹1.23 Crore, which is less than the ₹1.26 Crore dividend itself. Fairchem Organics runs a near-zero-cash treasury and funds working capital through ₹83.78 Crore of short-term borrowings. There is no cash reserve buffer here. Every rupee of dividend must be generated fresh from operations or drawn from the credit line.
Balance Sheet Strength
Key Balance Sheet Items
| Item | FY26 (₹ Cr) | FY25 (₹ Cr) |
|---|---|---|
| Total Assets | 390.98 | 401.83 |
| Property, Plant & Equipment | 196.19 | 197.10 |
| Capital Work-In-Progress | 18.38 | 11.72 |
| Inventories | 92.25 | 88.31 |
| Trade Receivables | 68.13 | 86.13 |
| Cash & Equivalents | 0.01 | 0.01 |
| Short-Term Borrowings | 83.78 | 63.03 |
| Deferred Tax Liabilities (Net) | 20.57 | 18.73 |
| Asset Held for Sale | 3.96 | — |
| Total Equity | 263.04 | 302.03 |
Derived Ratios
| Net Debt (Borrowings − Cash & Bank) | ₹82.55 Cr |
| Debt to Equity | 0.32x |
| Net Debt to EBITDA | 3.75x |
| Interest Coverage (EBIT / Finance Cost) | 2.98x |
| Return on Equity (FY26) | 2.11% |
| Return on Capital Employed (FY26) | 3.18% |
| Book Value Per Share | ₹208.83 |
| Working Capital (Current Assets − Current Liabilities) | ₹67.63 Cr |
ROE = PAT ÷ Total Equity. ROCE = (PBT + Finance Cost) ÷ (Total Equity + Borrowings). Both are ShareBazaar Online computations from the audited results. FY26 was an unusually weak profit year, so these ratios are cyclically depressed and should not be read as structural.
Debt rose while capital was returned
Short-term borrowings increased by ₹20.75 Crore during FY26, from ₹63.03 Crore to ₹83.78 Crore. In the same year the company spent ₹35.14 Crore on a buyback and ₹9.77 Crore on the previous year's dividend.
Money is fungible, so it is not strictly correct to say the buyback was debt-funded. But the arithmetic is worth stating plainly: free cash flow of ₹26.26 Crore did not cover ₹44.91 Crore of capital returned, and the gap of roughly ₹18.65 Crore lines up closely with the ₹20.75 Crore increase in borrowings. Net worth fell 12.9% and interest cost is now running at ₹3.70 Crore a year against a net profit of ₹5.54 Crore.
CARE Ratings reaffirmed the company's ratings on 29 June 2026, with long-term bank facilities of ₹173.99 Crore rated CARE A and short-term facilities rated CARE A1. That is an investment-grade reaffirmation and suggests the lender view of the balance sheet remains stable.
Dividend Sustainability Analysis
Coverage Metrics
| Dividend Per Share | ₹1.00 |
| Earnings Per Share | ₹4.28 |
| Dividend Coverage Ratio | 4.28 times |
| Total Dividend Outflow | ₹1.26 Cr |
| Profit After Tax | ₹5.54 Cr |
| Dividend Payout Ratio | 22.7% |
| FCF Coverage | 20.8 times |
| Cash Coverage | 0.97 times |
Verdict: Sustainable — but only because it was cut to a token level
ShareBazaar Online classifies this dividend as Sustainable. That classification needs an honest caveat attached to it.
A ₹1.26 Crore outflow against ₹41.60 Crore of operating cash flow is trivially affordable. The payout ratio of 22.7% is conservative. Coverage on every measure except balance-sheet cash is strong.
But consider the counterfactual. Had the Board maintained ₹7.50 per share, the outflow would have been ₹9.45 Crore against a net profit of ₹5.54 Crore — a payout ratio of 171%. The company would have been paying out substantially more than it earned, in a year when borrowings were already rising. The dividend is sustainable precisely because it was cut.
Read that way, the cut is arguably a sign of financial discipline rather than distress — a board choosing balance-sheet preservation over optics. Income investors, however, do not get to bank discipline. They get ₹1.00.
Positive sustainability factors
- Operating cash flow swung from −₹16.78 Cr to +₹41.60 Cr
- Payout ratio of only 22.7% leaves room to absorb a further earnings decline
- FCF covers the dividend 20.8 times
- Working capital tightened — receivables down ₹18.07 Cr
- Q4 profit of ₹3.69 Cr suggests a possible margin turn
- CARE reaffirmed CARE A / A1 ratings in June 2026
Negative sustainability factors
- Balance sheet cash of ₹1.23 Cr is less than the dividend itself
- Borrowings rose ₹20.75 Cr in the same year capital was returned
- PAT down 74.8%; five-year sales growth of only 3.0%
- ROE of 2.11% is below any reasonable cost of capital
- A cut of this magnitude signals the payout is fully discretionary
- Labour Code cost impact not yet fully quantified
Peer Comparison
Speciality Chemicals — Dividend Yield Benchmark
| Company | Latest DPS | Dividend Yield | Payout Ratio |
|---|---|---|---|
| Fairchem Organics (FY26) | ₹1.00 | 0.15% | 22.7% |
| Fairchem Organics (FY25) | ₹7.50 | 1.07% | 44.5% |
| Laxmi Organic Industries | ₹0.50 | 0.26% | 16.13% |
| Basic Materials sector average | — | 1.70% | Not Disclosed by Company |
Laxmi Organic and sector-average figures sourced from TipRanks dividend data as at the FY25 payout cycle. FY25 Fairchem payout ratio computed as ₹9.77 Cr dividend ÷ ₹21.97 Cr PAT. Peer set is limited: Fairchem Organics is a single-segment small-cap oleochemicals manufacturer with few directly comparable listed peers of similar size and product mix.
Where Fairchem now sits
At 0.15%, Fairchem Organics now yields roughly one-eleventh of the broader Basic Materials sector average of about 1.70%, and less than half of Laxmi Organic's already-modest 0.26%.
Even before this cut, at 1.07%, independent analysts described Fairchem's yield as below the industry average. The stock has never been an income stock. It is now, on yield, effectively a zero-income holding.
Return ratios against the sector
Fairchem's FY26 ROE of 2.11% and ROCE of 3.18% are far below what a healthy speciality chemicals franchise generates through a normal cycle. The company's own five-year record — 3.0% sales growth and roughly 3.1% EPS growth per annum — points to a business that has struggled to compound.
Management has publicly targeted ₹2,000 Crore of revenue by FY30 against FY26 revenue of ₹459.65 Crore. Reaching that would require roughly 44% compound annual growth for four straight years. That is an extremely demanding target against the company's realised track record.
Promoter Impact Analysis
Shareholding Pattern
| Promoter Holding | 63.25% |
| FII Holding | 6.34% |
| DII Holding | 3.98% |
| Public Holding | 26.40% |
| Promoter Shares Pledged | 0% |
Shareholding data as reported by market data providers for the quarter ending June 2026. Promoter holding rose to about 63.2-63.3% following the January 2026 buyback, in which promoters did not tender proportionately.
Distribution of the ₹1.26 Crore
| Promoter Dividend Income | ₹0.80 Cr |
| FII Dividend Income | ₹0.08 Cr |
| DII Dividend Income | ₹0.05 Cr |
| Public / Retail Dividend Income | ₹0.33 Cr |
The entire public float — every retail and non-institutional shareholder combined — receives approximately ₹33 Lakh in total.
The alignment question
One useful test of a dividend cut is whether the controlling shareholder shares the pain. Here, they clearly do. The Fairfax-linked promoter group holds 63.25% and therefore absorbs 63.25% of the ₹8.19 Crore reduction in total dividend versus last year — roughly ₹5.18 Crore of forgone income.
There is no structure here where the promoter extracts cash while minority holders are diluted. The promoter is the largest single loser from the cut in absolute rupee terms. That is a meaningfully different situation from a company maintaining a high dividend to service promoter obligations while the underlying business deteriorates.
It is also worth noting that zero promoter shares are pledged, removing one common source of pressure to maintain artificial payouts.
Capital Allocation Analysis
Where FY26 capital actually went
| Use of Capital | Amount (₹ Cr) | Share of Total |
|---|---|---|
| Share Buyback (Jan 2026) | 35.14 | 54.0% |
| Capital Expenditure | 15.34 | 23.6% |
| Dividend Paid (FY25 payout) | 9.77 | 15.0% |
| Interest Paid | 3.70 | 5.7% |
The buyback versus dividend trade-off
The Board bought back 4,25,000 shares at ₹800 each in January 2026, spending ₹35.14 Crore including expenses. That is 28 times the FY26 dividend outflow of ₹1.26 Crore.
The buyback price of ₹800 was a 20.85% premium to the then-market price of roughly ₹662. Since then the share has traded between roughly ₹428 and ₹1,024 over 52 weeks and sat near ₹677 in mid-July 2026. Judged narrowly on price, capital deployed at ₹800 has not yet been vindicated by the market.
What else could the money have done?
- Debt reduction: ₹35.14 Cr would have retired 42% of the ₹83.78 Cr borrowings, saving roughly ₹1.5 Cr a year in interest at prevailing rates.
- Higher capex: capex was ₹15.34 Cr, down from ₹26.11 Cr. CWIP rose to ₹18.38 Cr, so projects are in flight — but the ₹2,000 Cr FY30 revenue ambition implies far heavier investment than FY26 saw.
- Retained cash: with balance sheet cash at ₹1.23 Cr, retaining even a fraction would have removed the company's dependence on short-term borrowings for working capital.
- Maintained dividend: holding ₹7.50 would have cost ₹9.45 Cr and pushed the payout ratio to 171% of profit.
The honest summary: FY26 saw the company return ₹44.91 Crore of capital while generating ₹26.26 Crore of free cash flow and increasing borrowings by ₹20.75 Crore. Whether that was the right sequencing is a legitimate question for shareholders to put to the Board at the AGM on 27 July 2026.
Taxation Analysis
How dividends are taxed in India
Since the abolition of Dividend Distribution Tax in Budget 2020, dividends are taxed entirely in the hands of the shareholder. The company no longer pays tax on your behalf.
- Dividend income is taxed under the head "Income from Other Sources".
- It is added to your total income and taxed at your applicable slab rate, plus applicable surcharge and 4% health and education cess.
- The company deducts TDS at 10% under Section 194 if total dividend paid to a resident shareholder in a financial year exceeds the prescribed threshold. Following Budget 2025, that threshold was raised to ₹10,000 per company per financial year with effect from FY 2025-26.
- If PAN is not furnished, TDS is deducted at 20%.
- Shareholders with income below the taxable limit may file Form 15G (or Form 15H for senior citizens) to avoid TDS.
- TDS is only an advance collection — the final liability is settled at your slab rate when you file your return, and excess TDS is refundable.
- A deduction is available for interest expense incurred to earn dividend income, capped at 20% of the dividend.
- Non-resident shareholders are generally subject to 20% TDS plus surcharge and cess, subject to relief under the applicable Double Taxation Avoidance Agreement.
Tax rules change with each Finance Act. Shareholders should confirm current thresholds and rates with a qualified tax professional before acting.
Worked Example A — the standard illustration
Investor owns 1,000 shares, dividend ₹10 per share, tax slab 30%.
| Gross Dividend | ₹10,000 |
| TDS at 10% | ₹0 (at threshold) |
| Tax at 30% + 4% cess = 31.2% | ₹3,120 |
| Net Dividend in Hand | ₹6,880 |
| Effective post-tax yield if share price is ₹677.75 | 1.02% |
Worked Example B — Fairchem Organics reality
Investor owns 1,000 shares, dividend ₹1.00 per share, tax slab 30%.
| Investment value at ₹677.75 | ₹6,77,750 |
| Gross Dividend | ₹1,000 |
| TDS (below ₹10,000 threshold) | ₹0 |
| Tax at 31.2% | ₹312 |
| Net Dividend in Hand | ₹688 |
| Effective Post-Tax Yield | 0.10% |
A shareholder in the highest slab keeps ₹688 on an investment of nearly ₹6.78 Lakh. To trigger TDS on this dividend at all, you would need to hold more than 10,000 shares, worth roughly ₹67.8 Lakh.
Key Risks
1. Raw material spread risk
Fairchem's model depends on procuring by-products of edible-oil refining and purifying them into dimer acid, linoleic acid and isostearic acid. Cost of materials is 81.4% of revenue (₹374.19 Cr of ₹459.65 Cr). A small adverse move in the spread between waste-stream input costs and product realisations wipes out the entire margin. In FY26, materials cost fell 10.9% while revenue fell 14.5% — the spread moved against the company.
2. Single-segment concentration
The company reports only one business segment — Speciality Chemicals — under Ind AS 108, and has no subsidiary, associate or joint venture. There is no diversified earnings stream to cushion a downcycle in oleochemicals. Almost all revenue is from domestic sales, so no separate geographic segment is even disclosed.
3. Working capital and liquidity risk
Cash and equivalents stand at ₹0.01 Crore against short-term borrowings of ₹83.78 Crore and inventories of ₹92.25 Crore. The business is funded on rolling short-term credit. Any tightening in bank facilities, or a repeat of FY25's receivables blow-out, would create immediate stress.
4. Regulatory and Labour Code cost risk
The company has booked ₹0.88 Crore as an exceptional item for the four new Labour Codes effective 21 November 2025, and has explicitly stated it will account for further effects as Central and State Rules are finalised. Against a net profit of ₹5.54 Crore, even a modest additional provision is material.
5. Earnings volatility and execution risk
EPS has moved from ₹16.88 to ₹4.28 in a single year. Five-year sales growth stands at 3.0% per annum. Against this, management targets ₹2,000 Crore revenue by FY30 — implying roughly 44% compound growth from ₹459.65 Crore. The execution gap between record and ambition is wide.
6. Small-cap liquidity and price risk
With a market capitalisation of roughly ₹850-975 Crore and a public float of only 26.40%, the stock is thinly traded. Reported daily volumes have been as low as a few hundred shares on some sessions. The 52-week range of roughly ₹428 to ₹1,024 shows how violently the price can move on modest order flow — a swing that dwarfs a ₹1.00 dividend many times over.
7. Dividend policy risk
Having cut once by 86.7%, the Board has demonstrated the payout is fully discretionary and earnings-linked. There is no published commitment to a minimum payout ratio in the board meeting outcome. Investors should not model any assumed floor for FY27.
8. Approval risk on this specific dividend
The ₹1.00 dividend is a recommendation, not a declaration. It requires shareholder approval at the AGM on 27 July 2026. While rejection of a final dividend is rare, the payment is not legally due until members approve it, and the expected payment date of 26 August 2026 is not stated in the company's own filing.
What To Monitor
- Q1 FY27 EBITDA margin. Q4 FY26 EBITDA margin recovered to about 6.9% from 4.2% in Q3. If Q1 FY27 holds above 6.5%, the margin turn is real. If it slips back toward 4%, FY26's Q4 was a one-off. This is the single highest-signal number to watch.
- Cost of materials as a percentage of revenue. FY26 ran at 81.4%. Watch whether this falls back below 80% as isostearic acid and other value-added products scale. This ratio, more than any other, determines whether Fairchem earns anything.
- Short-term borrowings at each quarter-end. The number rose from ₹63.03 Cr to ₹83.78 Cr in FY26. A continued climb while profits stay depressed would be the clearest warning sign on the balance sheet.
- Trade receivable days. Receivables fell ₹18.07 Cr in FY26 after rising ₹29.27 Cr in FY25. This line has whipsawed. Consistent, disciplined collections would confirm the FY26 cash improvement is structural rather than a one-year correction.
- Capital work-in-progress and capex run-rate. CWIP rose to ₹18.38 Cr while capex fell to ₹15.34 Cr. Watch whether CWIP converts into commissioned capacity, and whether capex reaccelerates in line with the FY30 revenue ambition.
- Export mix and isostearic acid ramp. Management has flagged export strategy and value-added products as growth levers. Track disclosed export share and volume commentary in quarterly investor presentations and earnings calls.
- Further Labour Code provisioning. The company has said additional accounting effects will follow as rules are notified. Any incremental provision should be read against the small FY26 profit base.
- FY27 dividend recommendation (expected May 2027). Whether the Board restores a meaningful payout, holds at ₹1.00, or moves again will reveal how it now thinks about capital return versus balance-sheet repair.
- Promoter and FII holding trend. Promoter holding is 63.25% post-buyback with zero pledge. Watch quarterly shareholding filings for any change in the Fairfax-linked group's stance or in the 6.34% FII position.
- CARE Ratings actions. Ratings were reaffirmed at CARE A / A1 in June 2026 on facilities of ₹173.99 Crore. Any outlook change would be an early, independent signal on financial health.
Conclusion
Fairchem Organics Limited's FY26 dividend of ₹1.00 per share is, in isolation, an unremarkable corporate action worth ₹1.26 Crore. Read against the ₹7.50 paid in each of the previous two years, it is one of the sharpest single-year dividend reductions among listed Indian speciality chemicals companies this cycle — a cut of 86.7%.
The cut follows a year in which revenue fell 14.5% and net profit fell 74.8% to ₹5.54 Crore. Fixed costs — depreciation and interest — did not flex with sales and together consumed 2.7 times the year's entire profit.
Positives
- Operating cash flow swung to +₹41.60 Cr from −₹16.78 Cr
- Free cash flow of ₹26.26 Cr covers the dividend 20.8 times
- Payout ratio a conservative 22.7%
- Receivables reduced by ₹18.07 Cr
- Q4 profit of ₹3.69 Cr versus ₹0.59 Cr a year earlier
- Unmodified audit opinion; CARE A / A1 reaffirmed June 2026
- Promoter holds 63.25% with zero pledge and absorbs most of the cut
Negatives
- Dividend cut 86.7%; yield collapses to 0.15%
- Net profit down 74.8%; EPS ₹16.88 to ₹4.28
- ROE 2.11%, ROCE 3.18%
- Balance sheet cash of ₹1.23 Cr is less than the dividend
- Borrowings up ₹20.75 Cr in a year of ₹44.91 Cr capital return
- Five-year sales growth of only 3.0% per annum
- Labour Code cost impact not fully quantified
The most useful way to frame this: the dividend cut is the symptom, not the story. The story is a single-segment chemicals business with a squeezed spread, rising fixed charges, near-zero treasury cash, and a management team targeting ₹2,000 Crore of revenue by FY30 from a ₹460 Crore base. The Board's decision to preserve ₹8.19 Crore of cash rather than pay out 171% of profit is defensible on its own terms. Whether the business can rebuild the earnings power that once supported a ₹7.50 dividend is a question FY27 will answer, not this announcement.
ShareBazaar Online does not issue buy, sell or hold recommendations. The figures, computations, risks and monitoring factors above are presented so readers can reach their own conclusions.
Frequently Asked Questions
What dividend has Fairchem Organics announced for FY 2025-26?
Why is the dividend so much lower than last year?
What is the dividend yield on Fairchem Organics?
What is the record date for the Fairchem Organics dividend?
What is the ex-date and has it already passed?
When will the Fairchem Organics dividend be paid?
Who is eligible to receive this dividend?
How is this dividend taxed, and will TDS be deducted?
Is the Fairchem Organics dividend sustainable?
What is Fairchem Organics' dividend history?
How did Fairchem Organics perform financially in FY2025-26?
If profit fell 75%, why did operating cash flow improve so much?
What happened with the Fairchem Organics buyback?
How much of the dividend goes to promoters?
What should investors monitor from here?
Disclaimer
This article is published by ShareBazaar Online for informational and educational purposes only. It does not constitute investment advice, a recommendation, or an offer or solicitation to buy or sell any security. ShareBazaar Online does not issue buy, sell or hold recommendations.
All company-disclosed figures are sourced from Fairchem Organics Limited's Outcome of Board Meeting filing dated 6 May 2026, together with the audited financial results, audited statement of assets and liabilities, and audited cash flow statement for the year ended 31 March 2026, as submitted to NSE and BSE. Market prices, shareholding data, dividend history for prior years, peer comparisons and the expected payment date are sourced from third-party market data providers and exchange disclosures, and are indicated as such in the text. All derived ratios — EBITDA, ROE, ROCE, free cash flow, coverage ratios and payout ratios — are ShareBazaar Online computations and are not company-disclosed figures.
Market prices change continuously; yield figures calculated in this article will move with the share price. The dividend described is a Board recommendation and remains subject to shareholder approval at the AGM on 27 July 2026. Tax rules referenced are subject to amendment by each Finance Act.
Securities markets are subject to market risks. Please read all related documents carefully before investing. Investors should consult a SEBI-registered investment adviser and a qualified tax professional before making any investment or tax decision. ShareBazaar Online and its authors accept no liability for any loss arising from the use of this information.