
Dividend Status
STATUS: UPCOMING — RECORD DATE NOT YET PASSED
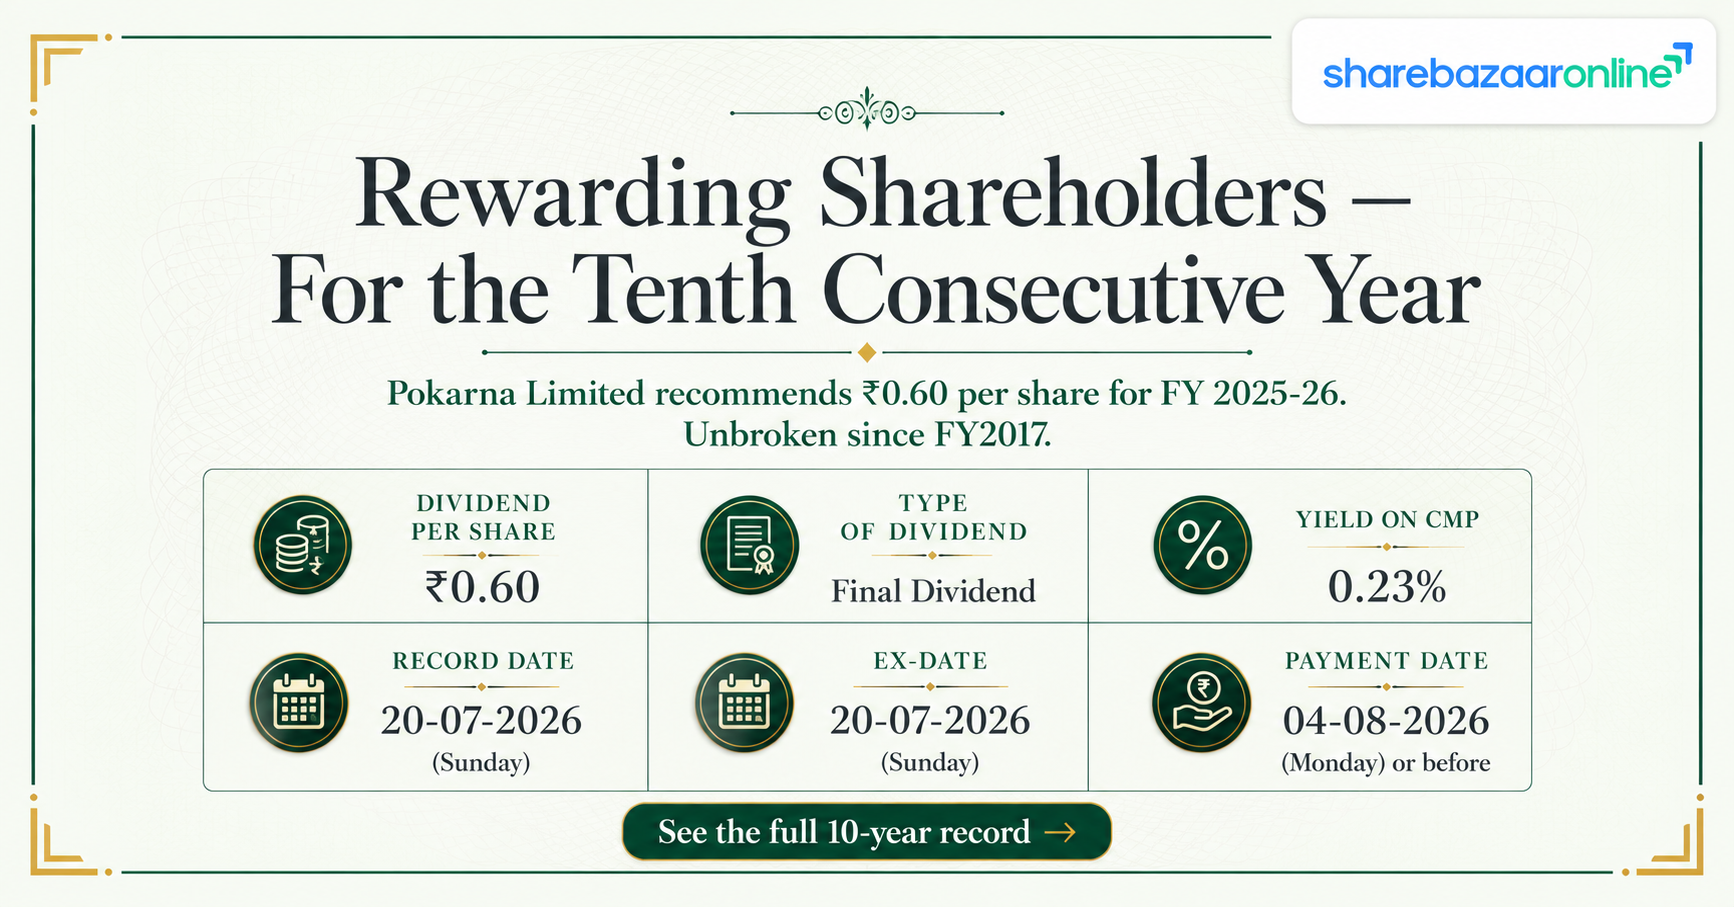
Pokarna Limited's final dividend of ₹0.60 per share for FY 2025-26 has a record date of Monday, 20 July 2026. As on 18 July 2026, that date has not yet arrived, so the dividend is technically still upcoming and payment is pending shareholder approval at the 35th AGM on 27 July 2026.
IMPORTANT — THE ELIGIBILITY WINDOW HAS ALREADY CLOSED
Under India's T+1 settlement cycle, the ex-date and record date fall on the same day. With the ex-date on Monday, 20 July 2026, the last day to buy the share and still be eligible was Friday, 17 July 2026. Today is Saturday, 18 July 2026 and markets are shut. A fresh purchase on or after Monday 20 July will NOT qualify for this dividend. Only investors already holding the stock as of the 17 July close will receive ₹0.60 per share.
Dividend Snapshot
Company Identity
- Company: Pokarna Limited
- NSE Symbol: POKARNA
- BSE Scrip Code: 532486
- ISIN: INE637C01025
- CIN: L14102TG1991PLC013299
- Registered Office: Surya Towers, 105, Sardar Patel Road, Secunderabad 500 003, Telangana
- Business: Granite quarrying & processing; engineered quartz surfaces (brand: Quantra) through wholly owned subsidiary Pokarna Engineered Stone Limited
Dividend Terms
- Dividend Type: Final Dividend
- Dividend Per Share: ₹0.60
- Dividend Rate: 30% of face value
- Face Value: ₹2 per share
- Financial Year: FY 2025-26
- Total Dividend Outflow: ₹1.86 crore (₹186.02 lakh, as stated by the company)
- Shares Outstanding: 3.10 crore (paid-up capital ₹620.08 lakh ÷ ₹2)
- AGM Approval Required: Yes — 35th AGM, 27 July 2026
Yield Maths
- CMP (17 July 2026 close): ₹967.30 (Source: INDmoney, NSE data)
- Dividend Yield at CMP: 0.06% (₹0.60 ÷ ₹967.30)
- Price near announcement (25 May 2026): ₹820.10 (Source: Torus Digital)
- Announcement-period Yield: 0.07% approx.
- Exact 28 May 2026 NSE closing price: Not independently verified at time of writing
The One-Line Takeaway
Pokarna is paying out ₹1.86 crore from a consolidated net profit of ₹80.61 crore. That is a payout ratio of just 2.31% — one of the lowest you will find in the listed building-materials space. The dividend is not a yield story. It is a token continuity payment while the company channels ₹326.84 crore of cash into capital expenditure.
Dividend Announcement Summary
The Board of Directors of Pokarna Limited met on Thursday, 28 May 2026, from 2:00 PM to 3:40 PM. At that meeting the Board approved the audited standalone and consolidated financial results for the quarter and year ended 31 March 2026, and recommended a final dividend of ₹0.60 per equity share (30% on face value of ₹2) for FY 2025-26.
The word "recommended" matters. A final dividend is only a proposal until shareholders vote on it. Approval is scheduled at the 35th Annual General Meeting on Monday, 27 July 2026 at 11:00 AM, held through video conferencing. If approved, the company has disclosed the payout will result in a cash outflow of ₹186.02 lakh (₹1.86 crore).
The statutory auditors, M/s S. Daga & Co., Chartered Accountants (ICAI FRN 0000669S), issued an unmodified opinion on both the standalone and consolidated results. An unmodified opinion means the auditor found no material misstatement and raised no qualification — it is the clean, best-case audit outcome.
What Else the Board Approved
- Notice of the 35th AGM to be held on 27 July 2026 via VC/OAVM
- Book closure from Tuesday, 21 July 2026 to Monday, 27 July 2026 (both inclusive)
- Cut-off / record date of Monday, 20 July 2026
- Remote e-voting from 23 July 2026 (9:00 AM) to 25 July 2026 (5:00 PM)
- Appointment of Mr. K. V. Chalama Reddy of M/s K V C Reddy & Associates as Scrutinizer
- KFin Technologies Limited as e-voting and VC service provider
Note: A corrigendum filed on 2 July 2026 extended remote e-voting to 26 July 2026. (Source: exchange filing summary via Screener)
Management Commentary
The board outcome filing dated 28 May 2026 contains no narrative management commentary on business performance, dividend policy or outlook. It is a pure regulatory disclosure under Regulation 30 and 33 of SEBI LODR.
Management Commentary on dividend rationale: Not Disclosed by Company.
Key Dates Timeline
| Event | Date | What It Means For You |
|---|---|---|
| Board Meeting / Announcement | 28-05-2026 | Dividend recommended by the Board |
| Last cum-dividend trading day | 17-07-2026 | Final day to buy and still qualify. This day has passed. |
| Ex-Date | 20-07-2026 | Stock trades without dividend entitlement |
| Record Date / Cut-off | 20-07-2026 | Registers checked to fix the eligible shareholder list |
| Book Closure | 21-07-2026 to 27-07-2026 | Share transfer register closed |
| Remote E-Voting | 23-07-2026 to 25-07-2026 | Extended to 26-07-2026 by corrigendum |
| 35th AGM | 27-07-2026 | Shareholders vote to approve the dividend |
| Payment Date | Not Disclosed by Company | Companies Act requires payment within 30 days of declaration — i.e. by around 26-08-2026 |
A word on ex-date and record date being the same: India moved to a T+1 settlement cycle, meaning a trade settles one working day after execution. Because of this, the ex-date and record date now fall on the same calendar day. To appear in the register on 20 July, your purchase had to be executed by 17 July 2026 — the previous trading session.
Timing note: Pokarna has historically paid roughly 5 to 6 weeks after the record date. In FY25, the record date was 3 September 2025 and payment came on 10 October 2025. (Source: TipRanks dividend history) This year the gap could be shorter because the AGM sits just one week after the record date.
Dividend Yield Analysis
The Calculation
- Dividend Per Share ÷ CMP × 100
- ₹0.60 ÷ ₹967.30 × 100 = 0.062%
- At the announcement-period price of ₹820.10: 0.073%
- On a ₹1,00,000 investment at CMP, the annual dividend income is roughly ₹62, before tax.
Yield Reality Check
High yields can be misleading, and so can low ones. Here the low yield has a clear, non-alarming explanation: the dividend has been frozen at ₹0.60 for nine consecutive years while the share price has multiplied. Over five years the stock is up roughly 282% (Source: Simply Wall St). The denominator grew; the numerator did not.
This is not a case of a falling price inflating yield, nor a one-off special dividend. It is a growth company paying a nominal, symbolic dividend.
Historical Yield Context
Because the rupee dividend has been fixed at ₹0.60 since FY2017, the historical yield curve is purely a mirror image of the share price. When the share traded near ₹200-300 in FY2020-21, the yield was around 0.20-0.30%. As the share crossed ₹1,000, the yield compressed to under 0.07%. Business Standard's data on 24 December 2025 recorded a dividend yield of 0.07% at a price of ₹834.40. (Source: Business Standard)
Investors should not read the falling yield as deterioration. Read it as: the dividend policy simply has not moved with the business.
Dividend History Analysis
| Financial Year | Dividend / Share | Ex-Date | Payment Date |
|---|---|---|---|
| FY2025-26 | ₹0.60 | 20-07-2026 | Not Disclosed by Company |
| FY2024-25 | ₹0.60 | 03-09-2025 | 10-10-2025 |
| FY2023-24 | ₹0.60 | 23-09-2024 | 30-10-2024 |
| FY2022-23 | ₹0.60 | 11-09-2023 | 18-10-2023 |
| FY2021-22 | ₹0.60 | 29-08-2022 | 07-10-2022 |
| FY2020-21 | ₹0.60 | 29-07-2021 | 05-09-2021 |
| FY2019-20 | ₹0.60 | 21-09-2020 | 29-10-2020 |
| FY2018-19 | ₹0.60 | 06-09-2019 | 14-10-2019 |
| FY2017-18 | ₹0.60 | 06-09-2018 | 14-10-2018 |
| FY2016-17 | ₹0.60 | 08-09-2017 | 18-10-2017 |
| FY2015-16 | ₹1.40 | 08-09-2016 | Not Disclosed |
Source: TipRanks dividend history for Pokarna Limited, cross-checked against the company's 28 May 2026 exchange filing which confirms FY25 dividend of ₹0.60 per share and outflow of ₹186.02 lakh.
Classification: Consistent Payer
Pokarna has paid a dividend in each of the last ten years without a single suspension — including through FY2020-21, when the pandemic hit construction demand worldwide. That is genuine consistency and it deserves credit.
But Zero Growth — and One Cut
The rupee dividend has been flat at ₹0.60 for nine straight years. Worse, it was cut by 57% from ₹1.40 to ₹0.60 after FY2015-16, and has never been restored. Over the same nine years consolidated profit swung from modest to ₹187.55 crore (FY25) and back to ₹80.61 crore (FY26). The dividend responded to none of it.
Practical implication: shareholders should not model dividend growth into a Pokarna investment thesis.
Financial Performance Analysis
All figures below are consolidated unless stated otherwise, converted from the lakhs used in the filing into ₹ crore. Consolidated is the right lens here because the granite business sits in the listed parent while the far larger quartz surfaces business sits in wholly owned subsidiary Pokarna Engineered Stone Limited.
Consolidated Full-Year Performance (₹ Crore)
| Particulars | FY 2025-26 | FY 2024-25 | Change |
|---|---|---|---|
| Revenue from Operations | 571.62 | 930.13 | -38.5% |
| Other Income | 22.08 | 21.21 | +4.1% |
| Total Revenue | 593.69 | 951.34 | -37.6% |
| Total Expenses | 482.67 | 685.59 | -29.6% |
| EBITDA (PBT + Dep + Finance) | 189.69 | 347.05 | -45.3% |
| Profit Before Tax | 111.02 | 265.76 | -58.2% |
| Net Profit (PAT) | 80.61 | 187.55 | -57.0% |
| Basic EPS (₹) | 26.00 | 60.49 | -57.0% |
Operating Leverage — Working In Reverse
Operating leverage means fixed costs magnify profit moves in both directions. Here it worked against Pokarna. Revenue fell 38.5%, EBITDA fell 45.3%, and PAT fell 57.0%. Each step down the P&L amplified the damage.
The reason is visible in the cost lines. Revenue dropped by ₹358.51 crore, but:
- Employee cost fell only 13.2% (₹96.16 Cr → ₹83.47 Cr)
- Other expenses fell 20.7% (₹199.18 Cr → ₹157.99 Cr)
- Depreciation rose 10.7% (₹44.19 Cr → ₹48.91 Cr)
Depreciation rising while revenue collapses is the classic signature of a company that has commissioned new capacity ahead of the demand to fill it.
Segment Breakdown (₹ Crore)
| Segment | FY26 Rev | FY25 Rev | FY26 Result |
|---|---|---|---|
| Granites | 22.69 | 29.01 | -10.30 |
| Quartz Surfaces | 548.92 | 901.14 | 199.99 |
| Total | 571.62 | 930.13 | 189.69 |
Quartz is 96% of consolidated revenue. Its revenue fell 39.1% and segment profit fell 43.2% (₹352.36 Cr → ₹199.99 Cr). The granite segment lost money — a segment loss of ₹10.30 crore versus a loss of ₹5.32 crore in FY25.
The Standalone Picture Is Materially Worse
The listed parent, on a standalone basis, reported a net loss of ₹9.74 crore in FY26 against a loss of ₹6.76 crore in FY25. The auditor's standalone report explicitly refers to "the net Loss" for the year.
Critically, standalone other income of ₹7.09 crore includes ₹6.26 crore of dividend received from the subsidiary Pokarna Engineered Stone Limited (FY25: ₹8.34 crore). Strip that out and the parent's standalone result deteriorates further. The parent is funding its ₹1.86 crore dividend largely from cash upstreamed by its own subsidiary, not from its own granite operations.
Cash Flow Analysis
Reported profit involves judgement. Cash does not. This is where the FY26 story gets genuinely interesting — and where the news is better than the P&L suggests.
Positive: Operating Cash Flow Held Up
- Consolidated OCF FY26: ₹183.41 crore
- Consolidated OCF FY25: ₹191.32 crore
- Decline: only 4.1%
PAT fell 57% but operating cash flow fell just 4%. OCF was 2.3 times PAT. That is a strong quality-of-earnings signal — the profit decline was driven substantially by non-cash items (depreciation of ₹48.91 crore) and by working capital releasing cash rather than absorbing it.
Negative: Free Cash Flow Is Deeply Negative
- Operating Cash Flow: ₹183.41 crore
- Capex (PPE + intangibles): ₹326.84 crore
- Free Cash Flow: −₹143.43 crore
Capex more than tripled from ₹97.69 crore in FY25 to ₹326.84 crore in FY26. Capital work-in-progress on the balance sheet exploded from ₹40.56 crore to ₹386.40 crore — a 9.5x increase. Pokarna is in the middle of a very large expansion.
So How Is This Dividend Being Funded?
Walking through the sources honestly:
- Current earnings? Partially. ₹1.86 crore against ₹80.61 crore of consolidated PAT is comfortably affordable in isolation.
- Operating cash? Yes. ₹183.41 crore of OCF covers ₹1.86 crore 98.6 times over.
- Free cash flow? No. FCF was negative ₹143.43 crore. Once capex is accounted for, there was no surplus cash generated in FY26.
- Borrowings? Indirectly, yes. Gross borrowings rose from ₹327.34 crore to ₹426.32 crore, an increase of ₹98.98 crore. Fresh non-current borrowings of ₹159.50 crore were raised during the year. The marginal rupee funding the balance sheet in FY26 was borrowed.
- At the parent level: the ₹1.86 crore was effectively funded by the ₹6.26 crore dividend upstreamed from the subsidiary, since standalone operations were loss-making.
Honest verdict: the dividend is trivially small relative to cash generation, so it is affordable. But it is being paid in a year when the company consumed ₹143 crore more cash than it produced and added ₹99 crore of debt. The correct framing is "affordable but not surplus-funded."
Receivables vs Revenue
Trade receivables fell from ₹185.59 crore to ₹144.23 crore, down 22.3%. But revenue fell faster, at 38.5%. In days:
- FY25 debtor days: approximately 73 days
- FY26 debtor days: approximately 92 days
Screener flags the same movement, noting debtor days rose from 76.3 to 92.1. (Source: Screener.in) Customers are taking roughly 19 more days to pay. Allowances for credit losses of ₹3.81 crore were also booked. In a soft export market this usually means longer credit terms were extended to defend volumes.
Cash Position Deteriorated Sharply
- Cash & equivalents (BS): ₹13.61 Cr vs ₹77.61 Cr
- Other bank balances: ₹49.10 Cr vs ₹45.70 Cr
- Net decrease in cash: −₹75.93 crore
- Cash flow statement closing balance: −₹5.38 crore (versus +₹58.66 crore), reflecting bank overdraft netting
Liquid cash on the balance sheet fell by 82% year on year. Inventories also came down from ₹156.66 crore to ₹142.02 crore. This is a company deploying its liquidity into fixed assets.
Balance Sheet Strength
Key Consolidated Metrics (₹ Crore)
| Item | FY26 | FY25 |
|---|---|---|
| Total Assets | 1,616.41 | 1,403.18 |
| Total Equity | 856.97 | 777.98 |
| Non-current Borrowings | 302.92 | 215.20 |
| Current Borrowings | 123.40 | 112.14 |
| Gross Debt | 426.32 | 327.34 |
| Cash + Bank Balances | 62.71 | 123.31 |
| Net Debt | 363.61 | 204.03 |
| Capital Work-in-Progress | 386.40 | 40.56 |
| Net Debt / Equity | 0.42x | 0.26x |
Return Ratios (computed)
- ROE (FY26): 80.61 ÷ average equity of 817.47 = 9.9% (FY25: approximately 26%)
- ROCE (FY26): EBIT of 140.78 ÷ capital employed of 1,283.29 = 11.0%
- Book value per share: ₹856.97 Cr ÷ 3.10 Cr shares = ₹276
- Interest coverage: EBIT 140.78 ÷ finance cost 29.76 = 4.7x
ROE more than halved. The reason is arithmetic: profit fell 57% while equity grew 10%. Crucially, ₹386.40 crore of assets sit in capital work-in-progress and are not yet earning anything. Adjusting capital employed for CWIP, ROCE on productive capital would be closer to 15.7%.
Credit Rating Context
CRISIL has affirmed Pokarna Limited's long-term rating at CRISIL A/Stable and short-term at CRISIL A2, with the subsidiary Pokarna Engineered Stone Limited carrying identical ratings on total facilities of ₹651.52 crore. (Source: exchange announcement summary via Groww) An 'A' category rating indicates adequate degree of safety on financial obligations. Interest coverage of 4.7x and net debt/equity of 0.42x remain within comfortable bounds.
Dividend Sustainability Analysis
Coverage Metrics
| Metric | Formula | Result |
|---|---|---|
| Dividend Payout Ratio | 1.86 ÷ 80.61 × 100 | 2.31% |
| Dividend Coverage Ratio | EPS 26.00 ÷ DPS 0.60 | 43.3x |
| Cash Coverage | 62.71 ÷ 1.86 | 33.7x |
| OCF Coverage | 183.41 ÷ 1.86 | 98.6x |
| FCF Coverage | −143.43 ÷ 1.86 | Not covered (FCF negative) |
| Payout as % of Total Equity | 1.86 ÷ 856.97 × 100 | 0.22% |
Classification: SUSTAINABLE
On the narrow question — can Pokarna keep paying ₹0.60 per share? — the answer is a clear yes. At ₹1.86 crore, this dividend is 1.0% of annual operating cash flow and 0.6% of one year's capex. Even if profit halved again, coverage would remain above 20x. Pokarna sustained this exact dividend through FY2020-21 and through a year in which the parent posted a standalone loss.
The Caveat That Matters More
Sustainability is not the real question for this stock. The dividend is so small that sustainability is nearly meaningless. The relevant question is whether it will ever grow — and nine years of frozen payout, combined with a ₹386 crore capex programme still in progress and rising net debt, points strongly toward "no, not soon." Capital is being retained for expansion, not returned.
The Four Sustainability Tests
- Cash position: Weakened materially — cash and equivalents down 82% to ₹13.61 crore. Still 33.7x the dividend when bank balances are included. Pass, with concern.
- Free cash flow: Negative ₹143.43 crore. Dividend not covered by FCF. Fail.
- Debt trajectory: Net debt rose 78% from ₹204.03 crore to ₹363.61 crore while dividends were paid. Caution.
- Earnings trend: Declining sharply — PAT down 57%. Negative.
Three of four tests raise flags. The dividend survives them only because it is so small that it is almost a rounding error on this balance sheet.
Peer Comparison
Pokarna sits in an unusual place. It is classified under building products and basic materials, but it is really an export-led engineered quartz manufacturer. The nearest listed comparators are Indian building-products and stone companies, most of which are domestic-demand driven.
Simply Wall St classifies Pokarna within Indian Basic Materials, where the sector returned −5.1% over the past year against Pokarna's +8.1%. (Source: Simply Wall St) On dividends, TipRanks records the Basic Materials sector average dividend yield at 1.695% versus Pokarna's 0.07%. (Source: TipRanks)
Where Pokarna Stands
| Metric | Pokarna FY26 | Sector Benchmark |
|---|---|---|
| Dividend Yield | 0.06% | approx. 1.70% |
| Payout Ratio | 2.31% | Typically 15-35% |
| ROE | 9.9% | Not Disclosed |
| ROCE | 11.0% | Not Disclosed |
| Net Debt/Equity | 0.42x | Not Disclosed |
Sector benchmark yield per TipRanks. Peer-level payout, ROE, ROCE and cash figures for individual comparators are not verified from primary filings and are therefore marked Not Disclosed rather than estimated.
Reading the Gap
Pokarna's yield is roughly 1/28th of the sector average. That is not a red flag by itself — it is a positioning statement. Mature building-materials companies with saturated capacity return cash. Pokarna is doing the opposite: it has ₹386.40 crore in construction and is levering up to finish it.
If you are screening for income, Pokarna will fail every filter. If you are screening for a capacity-expansion story, the low payout is internally consistent with what management is doing with the money.
Promoter Impact Analysis
Shareholding Pattern (March 2026)
- Promoters: 56.66% — unchanged from December 2025
- FII: 6.89%
- DII: approximately 15.96%
- Public: 20.47%
- Promoter pledge: Nil
Source: Bajaj Finserv and Torus Digital, sourced from filed shareholding patterns. Largest single holder: K Gautam Chand Jain, Chairman & Managing Director.
Distribution of the ₹1.86 Crore
- Promoter dividend income: 56.66% × ₹1.86 Cr = ₹1.05 crore
- FII share: approximately ₹0.13 crore
- DII share: approximately ₹0.30 crore
- Retail and other public: approximately ₹0.38 crore
Promoters take the majority of the payout, as they would in any company where they hold a majority stake. But at ₹1.05 crore against a promoter stake worth roughly ₹1,748 crore at CMP, this is not a dividend-extraction structure. The annual cash return to promoters on their own holding is under 0.07%.
The Alignment Read
This matters more than the rupee split. When a promoter with 56.66% holds a dividend flat for nine years while profits swing wildly, they are voluntarily forgoing cash they could have voted themselves. Combined with zero pledged shares and a stable holding percentage, the signal is that promoter wealth is tied to capital appreciation and the success of the capex programme, not to extracting cash from the company.
For minority shareholders the practical consequence is straightforward: your return from Pokarna will come from share price, not from the dividend cheque. A minority holder with 100 shares receives ₹60 gross, before tax.
Capital Allocation Analysis
With ₹183.41 crore of operating cash and ₹159.50 crore of fresh long-term borrowing, management had roughly ₹343 crore of deployable capital in FY26. Here is what they did and what else they could have done.
| Use of Capital | Actual FY26 (₹ Cr) | Comment |
|---|---|---|
| Capital Expenditure | 326.84 | The overwhelming priority — 9.5x growth in CWIP |
| Debt Repayment | 68.83 | Offset by ₹159.50 Cr of fresh borrowing |
| Interest Paid | 23.18 | Down from ₹32.48 Cr in FY25 |
| Dividend Paid | 1.86 | 0.6% of capex |
| Share Buyback | Nil | Not undertaken |
The Alternatives, Quantified
- Reduce debt instead: The ₹1.86 crore dividend could have retired debt saving roughly ₹0.13 crore of annual interest at the implied cost of borrowing. Immaterial.
- Buyback: ₹1.86 crore at ₹967 buys about 19,200 shares — 0.06% of equity. Not worth the transaction cost.
- Retain the cash: Would have added 0.6% to the capex budget. Immaterial.
- Increase the dividend: A 25% payout ratio would mean ₹20.15 crore, or roughly ₹6.50 per share — a yield of 0.67%. Even that would remain below sector average.
The Honest Assessment
Every alternative use of ₹1.86 crore is financially irrelevant on a ₹1,616 crore balance sheet. This dividend exists for signalling and continuity, not capital allocation. Its real function is to maintain an unbroken payment record and to satisfy institutional mandates that require a dividend history.
The genuine capital allocation question for Pokarna is not the dividend. It is whether ₹386.40 crore of capital work-in-progress will generate returns above the cost of the debt funding it, in a year when the revenue it is meant to serve fell 38.5%.
Taxation Analysis
How Dividends Are Taxed in India
Since 1 April 2020, the Dividend Distribution Tax paid by companies was abolished. Dividends are now taxed entirely in the hands of the shareholder.
- Taxable head: "Income from Other Sources"
- Rate: Your applicable income tax slab rate — 5%, 20%, 30% and so on, plus surcharge and 4% cess
- TDS threshold: The company deducts TDS at 10% under Section 194 if total dividend paid to a resident shareholder in a financial year exceeds ₹10,000
- No PAN: TDS at 20%
- TDS is not final tax: It is credit against your total liability. If your slab is 30%, you pay the remaining 20% plus cess when filing your return
- Form 15G/15H: Can be submitted to the RTA (KFin Technologies) to avoid TDS if your total income is below the taxable limit
- NRIs: TDS at 20% plus surcharge and cess, subject to DTAA benefits where applicable
- Deduction allowed: Interest expense on borrowed money used to acquire the shares, capped at 20% of dividend income
Worked Example — 1,000 Shares, ₹10 Dividend, 30% Slab
This is the standard illustration requested. Note it uses ₹10 per share, not Pokarna's ₹0.60, so it demonstrates the mechanics at a scale where TDS actually triggers.
| Step | Amount |
|---|---|
| Gross Dividend (1,000 × ₹10) | ₹10,000 |
| TDS under Section 194 (10%) | ₹0 — threshold is "exceeds ₹10,000", so ₹10,000 exactly does not trigger TDS |
| Amount credited to bank | ₹10,000 |
| Tax at 30% slab | ₹3,000 |
| Health & Education Cess at 4% | ₹120 |
| Total Tax Liability | ₹3,120 |
| Net Dividend in Hand | ₹6,880 |
| Effective post-tax retention | 68.8% |
Applied to Pokarna's Actual Dividend
For a real Pokarna holder in the 30% slab:
- 100 shares: Gross ₹60. Tax ₹18.72. Net ₹41.28. Effective post-tax yield on ₹96,730 invested: 0.043%
- 1,000 shares: Gross ₹600. Tax ₹187.20. Net ₹412.80. No TDS (below ₹10,000)
- To cross the TDS threshold you would need more than 16,667 shares, worth over ₹1.61 crore at CMP
Practical point for retail investors: you will almost certainly receive the full ₹0.60 per share with no TDS deducted — but you are still legally required to declare it in your ITR and pay tax at your slab. Do not skip it because the amount is small; the company reports the payment to the tax department regardless.
Key Risks
1. Severe Revenue Contraction in the Core Segment
Quartz surfaces revenue fell 39.1% from ₹901.14 crore to ₹548.92 crore. This segment is 96% of consolidated revenue. A second consecutive year of decline of similar magnitude would put the entire capex programme's economics under strain.
2. Capex Commissioning Risk
Capital work-in-progress of ₹386.40 crore is 24% of total assets and earning nothing today. Once commissioned, it will add depreciation and interest to the P&L immediately, whether or not the associated revenue materialises. Depreciation already rose 10.7% in FY26.
3. Regulatory and Litigation Exposure
The company disclosed receiving a notice from the Andhra Pradesh Mines Department alleging misuse of permits, with a very large demand raised. The company has stated it plans to appeal and sees no immediate financial impact. (Source: exchange announcement summary via Groww) A separate Income Tax assessment order for AY 2024-25 raised a demand of ₹1.28 crore, also under appeal. Readers should verify the exact quantum from the company's own filings, as the mining demand figure has been reported inconsistently across data providers.
4. Export Concentration and Currency Exposure
Pokarna exports to roughly 12 countries across Europe, the Middle East and North America. US housing and renovation demand is the single biggest driver of engineered quartz volumes. The consolidated statement reports a forex gain of ₹14.35 crore in FY26 (FY25: ₹16.36 crore) — meaning currency movement, not operations, contributed meaningfully to the result.
5. Rising Leverage into a Downturn
Net debt rose 78% from ₹204.03 crore to ₹363.61 crore in a year when EBITDA fell 45.3%. Net debt to EBITDA moved from roughly 0.59x to 1.92x. That is still manageable, but the direction of travel in a demand downturn deserves attention.
6. Working Capital Stretch
Debtor days rose from about 73 to 92 days. Trade payables fell by ₹29.45 crore, meaning the company paid suppliers faster while collecting from customers slower — a double squeeze on working capital. Credit loss allowances of ₹3.81 crore were also booked.
7. Loss-Making Granite Segment
The original granite business posted a segment loss of ₹10.30 crore, worse than the ₹5.32 crore loss in FY25, on revenue of just ₹22.69 crore. It carries ₹102.02 crore of segment assets against ₹63.48 crore of segment liabilities — capital tied up in a shrinking, loss-making operation.
8. Dividend Is Not an Income Proposition
At a 0.06% yield, the dividend provides effectively no downside cushion. Investors buying for income will be disappointed. The stock's 52-week range of ₹692.60 to ₹1,146.20 means a single day's price move can exceed a decade of dividends.
What To Monitor
1. Capital Work-in-Progress Conversion
Track the CWIP line each quarter. Watch for ₹386.40 crore moving into Property, Plant and Equipment — that marks commissioning. The quarter it moves is the quarter depreciation and interest capitalisation stop being deferred.
2. Quarterly Quartz Segment Revenue Trajectory
Q4 FY26 consolidated revenue of ₹147.24 crore was already up from Q3's ₹134.96 crore. Watch whether Q1 FY27 continues that sequential recovery or reverts. Two consecutive quarters above ₹150 crore would signal the bottom is in.
3. Debtor Days
Monitor whether the 92-day figure stabilises or keeps climbing. Rising debtor days alongside recovering revenue would suggest volume is being bought with credit terms rather than won on demand.
4. Net Debt and Interest Coverage
Net debt to EBITDA at 1.92x and interest coverage at 4.7x are the two numbers to track. Interest coverage falling below 3x, or net debt/EBITDA above 3x, would change the risk profile materially.
5. Free Cash Flow Turning Positive
FCF was −₹143.43 crore in FY26. Once the capex cycle completes, capex should normalise toward the ₹50-100 crore maintenance range. The first year FCF turns clearly positive is the year the dividend policy could plausibly change.
6. US Housing and Renovation Demand
Engineered quartz countertop demand tracks US existing-home sales and remodelling activity. Watch US housing starts, existing home sales and the NAHB remodelling index as leading indicators for Pokarna's order book two to three quarters ahead.
7. Resolution of the AP Mines Department Matter
Track exchange filings for updates on the appeal. Any provisioning against this demand would hit the P&L directly. Monitor the contingent liabilities note in the FY26 annual report for the disclosed quantum.
8. Any Change to the ₹0.60 Dividend
The dividend has been ₹0.60 for nine years. The single clearest signal that management believes the capex cycle is complete and cash generation has normalised would be the first increase since FY2016. Watch the May board meeting each year.
Conclusion
Positives
- Ten consecutive years of uninterrupted dividend payment, including through FY2020-21
- Operating cash flow of ₹183.41 crore fell only 4.1% despite a 57% PAT decline — strong earnings quality
- OCF at 2.3x reported PAT
- Unmodified audit opinion on both standalone and consolidated results
- Dividend coverage of 43.3x earnings and 98.6x operating cash flow
- Promoter holding stable at 56.66% with zero pledge
- CRISIL A/Stable long-term rating affirmed
- Interest coverage of 4.7x; net debt/equity of 0.42x remains moderate
- Q4 FY26 showed sequential improvement — revenue ₹147.24 Cr vs ₹134.96 Cr in Q3
Negatives
- Consolidated revenue down 38.5%; PAT down 57.0%
- Free cash flow of −₹143.43 crore — dividend not covered by FCF
- Net debt up 78% to ₹363.61 crore
- Cash and equivalents down 82% to ₹13.61 crore
- Dividend frozen at ₹0.60 for nine years; cut 57% from ₹1.40 after FY2016 and never restored
- Yield of 0.06% versus sector average of roughly 1.70%
- Payout ratio of just 2.31%
- Parent posted a standalone loss of ₹9.74 crore; dividend effectively funded by subsidiary upstreaming
- Granite segment loss widened to ₹10.30 crore
- Debtor days deteriorated from 73 to 92 days
- ROE halved to 9.9%
- The eligibility window closed on 17 July 2026 — fresh buyers cannot qualify
The Bottom Line
Pokarna's FY26 dividend announcement is best understood as a non-event dressed as a corporate action. At ₹1.86 crore against a ₹1,616 crore balance sheet, it neither strengthens nor weakens the company in any measurable way.
The genuinely important information in the same filing is elsewhere: a 38.5% revenue collapse, a ₹326.84 crore capex programme that tripled year on year, net debt up 78%, and operating cash flow that held remarkably firm at ₹183.41 crore. Those four numbers will determine what happens to this share. The ₹0.60 will not.
Investors should evaluate Pokarna as a cyclical, export-led capacity-expansion story currently in a demand trough with a large unfinished asset base — not as a dividend investment. Weigh the positives and negatives set out above against your own objectives, time horizon and risk tolerance, and consult a SEBI-registered investment adviser where appropriate.
Frequently Asked Questions
What dividend has Pokarna Limited announced for FY 2025-26?
What is the dividend yield on Pokarna shares?
What is the record date for the Pokarna dividend?
What is the ex-date and can I still buy the share to get the dividend?
When will the Pokarna dividend be paid?
Who is eligible to receive this dividend?
How will this dividend be taxed in my hands?
Is the Pokarna dividend sustainable?
What is Pokarna's dividend history over the last ten years?
Why is the dividend so small when the company earned ₹80.61 crore?
Why did Pokarna's profit fall 57% in FY 2025-26?
How much of the dividend goes to the promoters?
What should Pokarna shareholders watch going forward?
Did the auditors flag any concerns in Pokarna's FY26 results?
Should I look at Pokarna's standalone or consolidated numbers?
Disclaimer
This article is published by ShareBazaar Online for informational and educational purposes only. It does not constitute investment advice, a recommendation, or an offer or solicitation to buy or sell any security. ShareBazaar Online is not a SEBI-registered investment adviser or research analyst.
All company-specific dividend and financial data is sourced from Pokarna Limited's stock exchange filing dated 28 May 2026 and the audited financial results annexed to it. Market prices, shareholding data, dividend history and sector benchmarks are sourced from third-party providers as cited inline and have not been independently audited. Figures have been converted from lakhs to crore and ratios computed by ShareBazaar Online; readers should verify all figures against the company's original filings before relying on them.
Share prices are subject to market risk. Past dividend payments are not a guarantee of future payments. Dividend declarations remain subject to shareholder approval and may be modified or withdrawn. Tax treatment depends on individual circumstances and prevailing law, which may change. Please consult a SEBI-registered investment adviser and a qualified tax professional before making any investment or tax decision.
Neither ShareBazaar Online nor its authors accept any liability for loss arising from the use of this information. Data as on 18 July 2026.