
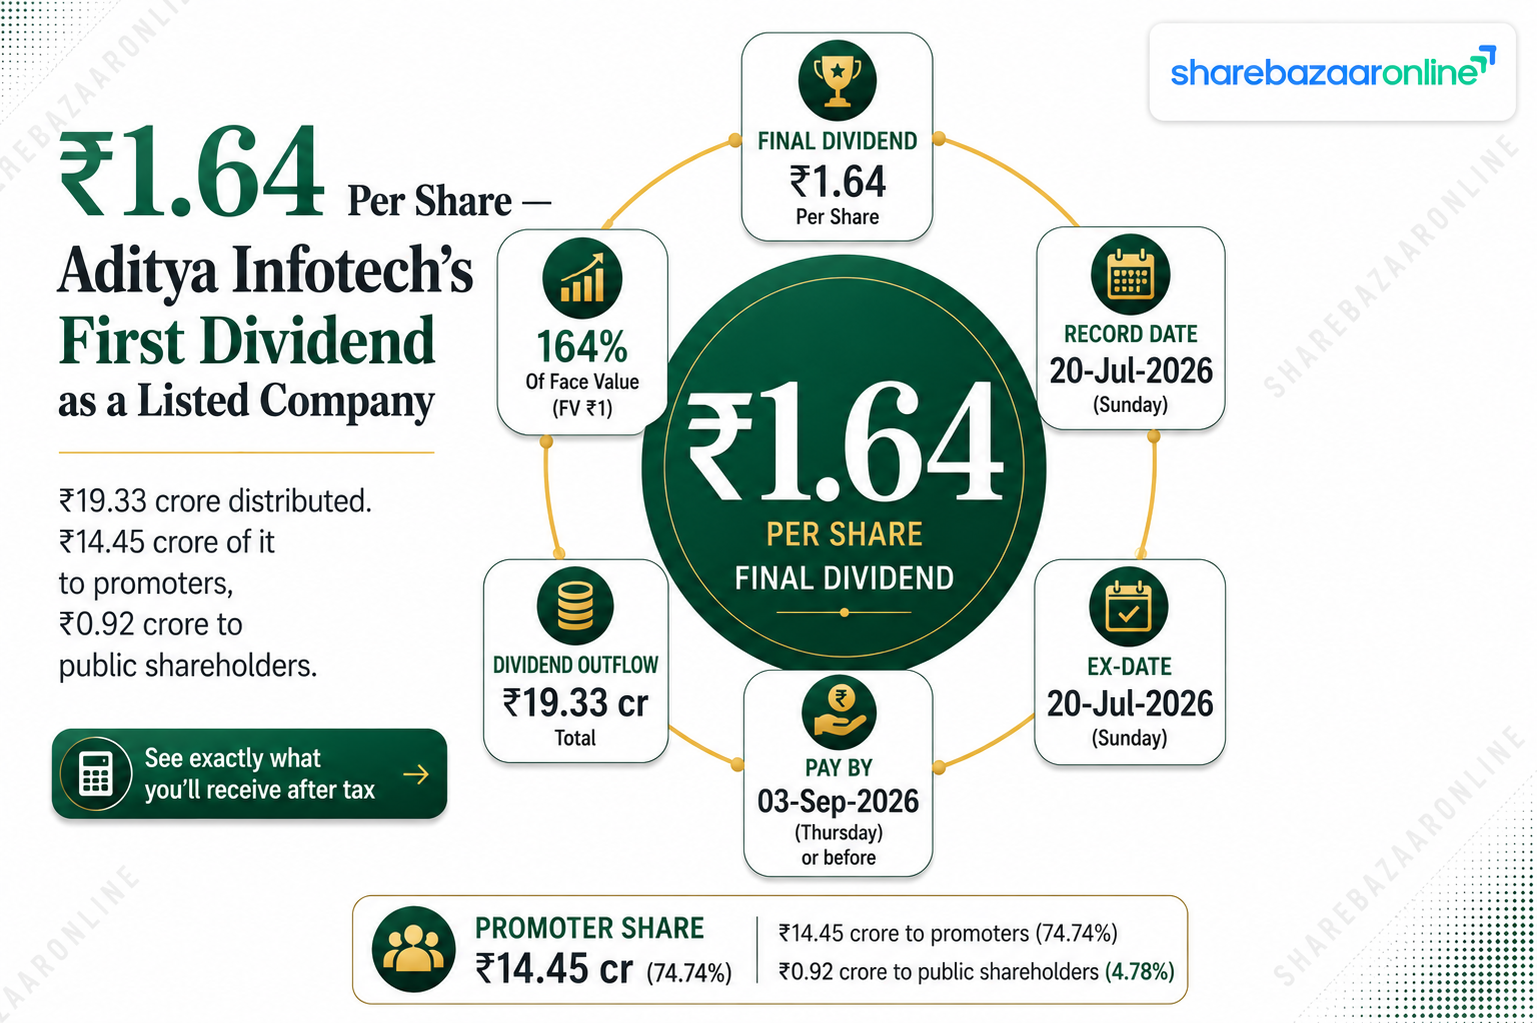
Dividend Status Banner
STATUS: UPCOMING — RECORD DATE NOT YET PASSED
As on 18 July 2026, the record date of 20 July 2026 has not yet passed. Under India's T+1 settlement cycle, the ex-date is the same as the record date. This means Friday, 17 July 2026 was the last trading day on which a purchase would settle in time to appear on the register by 20 July 2026. Investors buying on or after Monday 20 July 2026 will not receive this dividend.
The dividend is also not yet legally declared. A final dividend is only a Board recommendation until shareholders approve it — here, at the 31st AGM on 4 August 2026.
Dividend Snapshot
Company Identity
- Company Name: Aditya Infotech Limited (brand: CP PLUS)
- NSE Symbol: CPPLUS
- BSE Scrip Code: 544466
- ISIN: INE819V01029
- CIN: L74899DL1995PLC066784
- Business: Manufacture, assembly and trading of video security and surveillance equipment
Dividend Terms
- Dividend Type: Final Dividend
- Dividend Per Share: ₹1.64
- Dividend Percentage: 164% of face value
- Face Value: ₹1 per equity share
- Financial Year: FY 2025-26
- AGM Approval Required: Yes — 31st AGM, 4 August 2026
Computed Metrics
- Shares Outstanding: 11,78,50,485 (post 19 May 2026 ESOP allotment)
- Paid-up Share Capital: ₹11.785 crore
- Total Dividend Outflow: ₹19.33 crore
- Dividend Yield at CMP: 0.05%
- Dividend Yield at Announcement: 0.06%
- Payout Ratio (Consolidated): 5.25%
The One Number That Matters
The "164%" headline is a percentage of a ₹1 face value — not a percentage of your investment. At a market price near ₹3,614, ₹1.64 works out to a yield of roughly five paise for every ₹100 invested. This is a token dividend, not an income proposition. Aditya Infotech is being valued as a growth compounder, and this payout is consistent with that.
Dividend Announcement Summary
The Board of Directors of Aditya Infotech Limited met on Wednesday, 27 May 2026 (16:45 to 17:56 IST) and recommended a final dividend of ₹1.64 per equity share for the year ended 31 March 2026. The exchange intimation was filed with NSE and BSE the same evening and signed by Company Secretary Roshni Tandon.
This is the company's first dividend as a listed entity. Aditya Infotech listed on NSE and BSE on 5 August 2025 following an IPO of 1,92,67,928 shares at ₹675 per share, comprising a ₹800 crore offer for sale and a ₹500 crore fresh issue.
Other Board Decisions Same Day
- Audited standalone and consolidated FY26 results approved, with an unmodified (clean) audit opinion from Walker Chandiok & Co LLP.
- Further investment of up to USD 400,000 in wholly-owned subsidiary Aditya Infotech Taiwan Co. Ltd, an R&D entity incorporated 2 February 2026, to be completed on or before 30 September 2026.
Management Commentary on the Dividend
The Board meeting outcome contains no stated rationale for the quantum of the dividend, no dividend policy target, and no forward guidance on future payouts. On these points the disclosure is: "Not Disclosed by Company". Investors should treat the ₹1.64 figure as a one-year decision, not a signalled policy.
Key Dates Timeline
| Event | Date | Status |
|---|---|---|
| Board Meeting Intimation | 22 May 2026 | Completed |
| Announcement Date (Board Meeting) | 27 May 2026 | Completed |
| Record Date Intimation to Exchanges | 8 July 2026 | Completed |
| Last Cum-Dividend Trading Day | 17 July 2026 | Completed |
| Ex-Date | 20 July 2026 | Upcoming |
| Record Date | 20 July 2026 (Monday) | Upcoming |
| TDS Document Submission Cut-off | 24 July 2026 | Upcoming |
| 31st AGM (shareholder approval) | 4 August 2026 (video conferencing) | Upcoming |
| Payment Date (outer limit) | On or before 3 September 2026 — within 30 days of AGM conclusion | Upcoming |
Record date, AGM date and TDS cut-off sourced from the company's 8 July 2026 exchange intimation as reported by NSE/BSE filings feeds. An exact payment date has not been separately notified: "Not Disclosed by Company".
Why Ex-Date and Record Date Are the Same
India moved to T+1 settlement, meaning a trade settles one business day after execution. Because shares now land in your demat account the very next day, the exchanges set the ex-date equal to the record date. In older T+2 days the ex-date fell one day earlier. The practical rule today: you must own the shares at the end of the trading day before the record date.
Dividend Yield Analysis
Yield Computation
- CMP (NSE close, 17 July 2026): ₹3,614.40
- Yield at CMP: ₹1.64 ÷ ₹3,614.40 × 100 = 0.045% (rounds to 0.05%)
- CMP on announcement date (27 May 2026, NSE): ₹2,639.60
- Announcement Yield: ₹1.64 ÷ ₹2,639.60 × 100 = 0.062% (rounds to 0.06%)
- 52-week range: ₹1,015.00 – ₹3,787.00
Prices per NSE data reported by Trendlyne, Business Today and Screener.in.
Yield Reality Check
The yield fell between announcement and today — from 0.06% to 0.05% — and the reason is entirely on the price side. The stock rose roughly 37% from ₹2,639.60 on 27 May to ₹3,614.40 on 17 July. The dividend did not shrink; the denominator grew.
Testing the four causes of an unusual yield: this is not a strong dividend, not a falling share price, not a one-time special dividend, and not weak business performance. It is simply a token first payout from a high-growth, richly-valued stock trading at a reported P/E above 110x and roughly 22-23x book value.
What This Yield Means in Rupee Terms
A ₹10,00,000 position at ₹3,614.40 buys roughly 276 shares. Gross dividend on that position: about ₹453. For a 30%-slab investor, roughly ₹312 after tax. That is less than a single day's typical price movement in this stock. The dividend should be viewed as a governance signal, not a cash return.
Dividend History Analysis
| Financial Year | Dividend Per Share | Total Dividend Paid (Cash Flow) | Listing Status |
|---|---|---|---|
| FY 2025-26 | ₹1.64 (recommended) | ₹19.33 crore (payable FY27) | Listed 5 Aug 2025 |
| FY 2024-25 | Not Disclosed by Company | ₹18.00 crore (paid during FY26) | Unlisted |
| FY 2023-24 | Not Disclosed by Company | ₹18.00 crore (paid during FY25) | Unlisted |
| FY 2016-17 to FY 2022-23 | Not Disclosed by Company | Not Disclosed by Company | Unlisted |
The ₹18.00 crore figures are the "Dividend paid during the year" line in the audited consolidated and standalone cash flow statements for FY26 and FY25. A ten-year per-share history is not available because the company listed only in August 2025; pre-IPO per-share dividend data is not in the filing.
What the History Actually Shows
- Consistency: The company paid exactly ₹18.00 crore in cash dividends in each of FY25 and FY26 as an unlisted entity. That is a flat, unindexed payout.
- Growth trend: ₹18.00 crore → ₹19.33 crore is an increase of 7.4% in absolute rupees. Over the same period consolidated PAT rose 4.7% and, adjusted for FY25's exceptional gain, roughly 258%.
- Special dividends: None declared.
- Cuts or suspensions: None visible in the two disclosed years.
Classification: Irregular Payer (Insufficient Public Track Record)
With only one dividend as a listed company and two years of visible cash-flow data, Aditya Infotech cannot yet be classified as a Consistent Payer. The absolute rupee amount has barely moved (₹18.00 crore to ₹19.33 crore) while profits have transformed. Investors should wait for at least three listed-company cycles before drawing a trend.
Financial Performance Analysis
Consolidated FY26 vs FY25 (₹ Crore)
| Particulars | FY 2025-26 | FY 2024-25 | Change |
|---|---|---|---|
| Revenue from Operations | 4,220.81 | 3,111.87 | +35.6% |
| EBITDA (excl. other income) | 566.13 | 247.33 | +128.9% |
| EBITDA Margin | 13.41% | 7.95% | +546 bps |
| Finance Costs | 30.20 | 41.81 | −27.8% |
| Depreciation & Amortisation | 56.02 | 31.12 | +80.0% |
| Profit Before Exceptional Items & Tax | 492.75 | 185.45 | +165.7% |
| Exceptional Item (one-off gain) | Nil | 248.63 | — |
| Reported PAT | 367.96 | 351.37 | +4.7% |
| PAT excluding exceptional item | 367.96 | 102.74 | +258.2% |
| Basic EPS (₹) | 32.05 | 33.02 | −2.9% |
Operating Leverage — Working In the Company's Favour
Revenue grew 35.6% while EBITDA grew 128.9%. That is textbook positive operating leverage: costs grew slower than sales.
- Employee benefits expense: ₹342.92 cr vs ₹203.33 cr, up 68.7% — faster than revenue, but this includes a one-time ₹7.66 crore charge from the new Labour Codes notified 21 November 2025.
- Other expenses: ₹304.85 cr vs ₹218.77 cr, up 39.3% — broadly tracking revenue.
- Total expenses rose only 27.6% against 35.6% revenue growth, which is where the margin came from.
The EPS Optical Illusion
Reported EPS fell from ₹33.02 to ₹32.05 even though the business more than tripled underlying profit. Two things caused this:
- FY25 contained a ₹248.63 crore non-cash exceptional gain from fair-valuing the previously-held stake in the AIL Dixon joint venture. There is no such gain in FY26.
- The share count rose from 10.98 crore to 11.78 crore after the IPO fresh issue and ESOP allotments, diluting per-share numbers.
Anyone reading only the EPS line would draw the wrong conclusion about FY26.
Standalone vs Consolidated
Consolidated revenue ₹4,220.81 cr vs standalone ₹4,178.85 cr; consolidated PAT ₹367.96 cr vs standalone ₹340.63 cr. The three wholly-owned subsidiaries (AIL Dixon Technologies, Shenzhen CP Plus International, Aditya Infotech Taiwan) contributed ₹29.17 crore of net profit on ₹2,160.71 crore of revenue between them, per the auditor's Other Matters paragraph — indicating large intercompany elimination and thin standalone subsidiary margins. This analysis uses consolidated figures throughout, except where standalone is explicitly labelled.
Cash Flow Analysis
THE MOST IMPORTANT FINDING IN THIS REPORT
Aditya Infotech reported consolidated PAT of ₹367.96 crore in FY26. It generated net operating cash flow of ₹13.48 crore. That is a cash conversion of 3.7% of net profit. In FY25 it was ₹27.21 crore against PAT of ₹351.37 crore.
Profits are an accounting opinion. Cash is a fact. In FY26, the profit was real on paper but almost none of it arrived as cash.
Consolidated Cash Flow Walk (₹ Crore)
| Line Item | FY 2025-26 | FY 2024-25 |
|---|---|---|
| Operating profit before working capital changes | 604.39 | 266.81 |
| Increase in inventories | (236.53) | (69.31) |
| Increase in trade receivables | (381.69) | (312.42) |
| Increase in trade payables | 256.28 | 157.66 |
| Cash from operations post working capital | 127.27 | 78.17 |
| Income tax paid (net) | (113.79) | (50.97) |
| Net Operating Cash Flow (A) | 13.48 | 27.21 |
| Capex (PPE, CWIP, intangibles) | (136.33) | (26.49) |
| Free Cash Flow (OCF − Capex) | (122.85) | (1.28) |
| Net Investing Cash Flow (B) | (140.57) | (1.20) |
| Net Financing Cash Flow (C) | 156.43 | (18.95) |
| Net increase in cash | 29.34 | 7.06 |
| Closing cash and cash equivalents | 165.27 | 135.93 |
Receivables vs Revenue
Trade receivables rose 35.1% to ₹1,404.36 crore, almost exactly in line with revenue growth of 35.6%. On the surface, receivable quality has not deteriorated relative to sales.
But the absolute level is the problem. Receivables of ₹1,404.36 crore against revenue of ₹4,220.81 crore implies roughly 121 days of sales tied up in credit to dealers and distributors. Add inventories of ₹1,103.73 crore (up 26.8%) and the company is carrying about ₹2,508 crore of gross working capital — a figure larger than half its annual revenue. Screener.in reports working capital days rising from 40.8 to 73.9.
The expected credit loss allowance charged this year was ₹15.11 crore, more than double FY25's ₹6.91 crore.
How Is This Dividend Actually Funded?
Testing the four possible sources:
- Current earnings: Accounting profit yes (₹367.96 cr), cash earnings no (₹13.48 cr).
- Cash reserves: Yes — cash and bank balances of ₹199.59 crore comfortably fund ₹19.33 crore.
- Asset sales: No. Proceeds from sale of PPE were only ₹3.30 crore.
- Borrowings: Partly, indirectly. Net financing inflow was ₹156.43 crore, and long-term borrowings rose from ₹14.99 cr to ₹49.10 crore.
Conclusion: This dividend is being paid out of the balance sheet cash pile — much of which is IPO money and fresh borrowing — not out of cash the business generated in FY26. At ₹19.33 crore the amount is small enough that this does not endanger the company. But investors should understand the mechanism, not the headline.
Balance Sheet Strength
Consolidated Position as at 31 March 2026 (₹ Crore)
- Total Assets: 3,990.99 (vs 3,174.54)
- Total Equity: 1,876.86 (vs 1,017.67) — up 84.4% on IPO proceeds
- Cash and cash equivalents: 165.27
- Other bank balances: 34.32
- Total Cash & Bank: 199.59
- Non-current borrowings: 49.10 (vs 14.99)
- Current borrowings: 63.83 (vs 397.86)
- Supplier's credit: 76.07 (vs 52.05)
- Lease liabilities: 67.33
- Goodwill: 534.95
Net Debt and Returns
- Gross borrowings: ₹112.93 crore
- Less cash & bank: ₹199.59 crore
- Net Cash: ₹86.66 crore — the company is net-cash positive
- Including supplier's credit of ₹76.07 cr, net cash narrows to ₹10.59 crore
- Debt-to-Equity: 0.06x — very low
- ROE (PAT ÷ closing equity): 19.6%; on average equity for the year, approximately 25.4%
- ROCE (EBIT ÷ closing capital employed): approximately 26.3%
ROE and ROCE are computed by ShareBazaar Online from the audited FY26 consolidated statements; the company does not disclose these ratios in the results filing. A 19.6% ROE figure is independently reported by HDFC Sky.
Two Balance Sheet Items Worth Flagging
1. Goodwill is 28.5% of equity. The ₹534.95 crore goodwill arose from the AIL Dixon acquisition in FY25. It is unchanged year on year and the company has confirmed the purchase price allocation is now final with no change. Any future impairment would hit reported profits directly without affecting cash.
2. Debt reduction was real. Current borrowings dropped from ₹397.86 crore to ₹63.83 crore — an 84% reduction — funded by the IPO, which earmarked ₹375.00 crore for debt repayment. That entire amount has been utilised. Only ₹11.37 crore of IPO proceeds remains unutilised, parked in fixed deposits under a monitoring account.
Dividend Sustainability Analysis
Coverage Ratios
| Metric | Formula | Result | Read |
|---|---|---|---|
| Dividend Payout Ratio (Consol) | 19.33 ÷ 367.96 | 5.25% | Very conservative |
| Dividend Payout Ratio (Standalone) | 19.33 ÷ 340.63 | 5.67% | Very conservative |
| Dividend Coverage Ratio | ₹32.05 EPS ÷ ₹1.64 | 19.5x | Extremely well covered |
| Cash Coverage | 199.59 ÷ 19.33 | 10.3x | Strong |
| FCF Coverage | (122.85) ÷ 19.33 | Negative | Not covered by FCF |
| OCF Coverage | 13.48 ÷ 19.33 | 0.70x | Below 1x |
Verdict: Moderately Sustainable
The dividend is affordable but not self-funding. It clears every earnings and cash-balance test with enormous room — 19.5x earnings cover, 10.3x cash cover — but fails the two tests that matter most for a recurring payout: operating cash flow covers only 0.70x of it, and free cash flow is negative ₹122.85 crore.
Because the sum involved is only ₹19.33 crore against ₹1,876.86 crore of equity, there is no solvency question. But if the company wanted to raise the payout materially, it would have to fix working capital first.
Four-Factor Test
- Cash position: ₹199.59 crore against a ₹19.33 crore obligation. Pass.
- Free cash flow: Negative ₹122.85 crore. Fail.
- Debt position: Gross borrowings fell from ₹412.85 cr to ₹112.93 cr; net cash positive. Pass.
- Earnings trend: Underlying PAT up 258% ex-exceptional; margins expanded 546 bps. Pass.
Peer Comparison
| Parameter | Aditya Infotech | Dixon Technologies |
|---|---|---|
| FY26 Final Dividend Per Share | ₹1.64 (FV ₹1) | ₹10.00 (FV ₹2) |
| Dividend as % of Face Value | 164% | 500% |
| Approximate Dividend Yield | 0.05% | Under 0.10% |
| FY26 Consolidated Revenue | ₹4,220.81 cr | ₹49,586 cr |
| FY26 Consolidated PAT | ₹367.96 cr | ₹1,644 cr |
| FY26 Revenue Growth | +35.6% | +28% |
| FY26 EBITDA Growth | +128.9% | +69% |
| Approximate Payout Ratio | 5.25% | Approximately 3.7% |
| ROE | 19.6% (closing equity) | Not Disclosed by Company |
| Net Cash / (Net Debt) | Net cash ₹86.66 cr | Not Disclosed by Company |
Dixon Technologies FY26 figures per its 12 May 2026 results announcement as reported by HDFC Sky and DSIJ. Payout ratio for Dixon is a ShareBazaar Online estimate based on the ₹10 final dividend and approximately 6.02 crore shares outstanding. Peer set is indicative; Aditya Infotech has no directly comparable listed pure-play video surveillance company in India.
Sector Benchmark Reading
Indian electronics manufacturing and hardware companies are, as a category, low-yield growth names. Both Aditya Infotech and Dixon pay token dividends well under 0.1% yield and retain over 94% of profits. Investors seeking dividend income should look at FMCG, PSU banks, utilities or IT services, where sector yields commonly sit between 1% and 5%. Judging Aditya Infotech on yield is judging it on the wrong axis.
Promoter Impact Analysis
Shareholding Pattern (March 2026 quarter)
- Promoter & Promoter Group: 74.74%
- DII (Domestic Institutions): 14.74%
- FII (Foreign Institutions): 5.72%
- Public: 4.78%
- Promoter shares pledged: 0%
Shareholding per exchange filings for the quarter ended March 2026, as reported by Bajaj Finserv and Kotak Neo. Note that Choice Broking reports a slightly different split (promoter 76.91%) — investors should verify against the company's own quarterly Regulation 31 filing.
Distribution of the ₹19.33 Crore
- Promoter dividend income: ₹14.45 crore (74.74%)
- DII dividend income: ₹2.85 crore
- FII dividend income: ₹1.11 crore
- Public and retail dividend income: ₹0.92 crore
Is This a Promoter Extraction Event?
Roughly three out of every four rupees distributed goes to the Khemka promoter family. That is a large concentration in percentage terms, and worth stating plainly.
However, the scale argues against reading this as extraction. ₹14.45 crore against a promoter stake worth well over ₹30,000 crore at current prices is immaterial to the promoters personally. Promoters also face the same slab-rate taxation as everyone else, and the top-bracket effective rate on dividend income can exceed 35% including surcharge. If the intent were extraction, a 5.25% payout ratio is a strange way to achieve it. There is also zero promoter pledging, which removes the most common motive for cash-hungry promoter dividend policy.
The more useful observation is what this does not do for minority shareholders: at 0.05% yield, a small investor receives about ₹1.64 for every ₹3,614 invested. The economic benefit to a retail holder is close to nil. The benefit is symbolic — a first listed dividend establishing that the company intends to be a payer.
Capital Allocation Analysis
Could the ₹19.33 Crore Have Been Used Better?
- Reduce debt further: Remaining gross borrowings are ₹112.93 crore. The dividend equals about 17% of that. Given finance costs already fell 27.8% to ₹30.20 crore and the company is net-cash positive, further debt reduction has limited marginal value.
- Increase capex: FY26 capex was ₹136.33 crore, up more than 5x from ₹26.49 crore. The dividend equals about 14% of one year's capex. Management has publicly discussed capacity expansion and new plants in Kadapa and Rajasthan, so reinvestment is already accelerating.
- Fund working capital: This is the strongest counter-argument. The business absorbed ₹618.22 crore into inventories and receivables during FY26. ₹19.33 crore would fund about 11 days of that absorption.
- Conduct a buyback: With the stock at over 20x book value and above 110x earnings, a buyback would be value-destructive. Correctly avoided.
- Retain the cash: Only ₹11.37 crore of IPO proceeds remains unutilised. There is no idle-cash problem that a dividend is solving.
Assessment: The amount is too small for the choice to matter financially either way. Keeping the payout at a 5.25% ratio while capex is scaling and working capital is expanding is a defensible allocation decision. The question worth asking management is not "why so little" but "when does operating cash flow start converting".
Taxation Analysis
How Dividends Are Taxed in India
Since 1 April 2020, Dividend Distribution Tax was abolished and dividends became fully taxable in the hands of the shareholder. There is no exemption limit and no separate concessional rate.
- Dividend is added to "Income from Other Sources" and taxed at your applicable slab rate — 5%, 20%, 30% or higher, plus surcharge and 4% health and education cess.
- TDS under Section 194: The company deducts 10% TDS for resident individuals if total dividend from that company in a financial year exceeds ₹10,000. Below that threshold, no TDS is deducted — but the income is still taxable.
- If PAN is not linked with Aadhaar or PAN is invalid, TDS jumps to 20%.
- Resident individuals whose total income is below the taxable limit can submit Form 15G (or Form 15H if aged 60 or above) to avoid TDS.
- Non-residents face TDS of 20% plus surcharge and cess under Section 195, reducible under an applicable Double Taxation Avoidance Agreement with valid Tax Residency Certificate and Form 10F.
- Under Section 57, you may deduct interest expense up to 20% of the dividend income if you borrowed to buy the shares. No other expense is deductible.
- TDS deducted is not the final tax — it is a credit against your total liability, claimable in your ITR against Form 26AS.
Company-specific deadline: Aditya Infotech has set Friday, 24 July 2026 as the cut-off for receiving tax exemption documents. Submissions after this date may not be processed, resulting in higher deduction. Shareholders holding across multiple accounts under a single PAN will be taxed at the higher applicable rate on the entire holding.
Worked Example — 1,000 Shares, ₹10 Per Share Dividend, 30% Slab
| Step | Calculation | Amount |
|---|---|---|
| Gross Dividend | 1,000 × ₹10 | ₹10,000 |
| TDS under Section 194 | Threshold is "exceeds ₹10,000" — this is exactly at the limit, so nil | ₹0 |
| Tax at 30% slab plus 4% cess | ₹10,000 × 31.2% | ₹3,120 |
| Net Dividend in Hand | ₹10,000 − ₹3,120 | ₹6,880 |
Applying This to Aditya Infotech's Actual ₹1.64 Dividend
| Step | Calculation | Amount |
|---|---|---|
| Holding | 1,000 shares at ₹3,614.40 | ₹36,14,400 invested |
| Gross Dividend | 1,000 × ₹1.64 | ₹1,640 |
| TDS | Below ₹10,000 threshold | ₹0 |
| Tax at 30% plus cess | ₹1,640 × 31.2% | ₹512 |
| Net Dividend | ₹1,640 − ₹512 | ₹1,128 |
| Effective Post-Tax Yield | ₹1,128 ÷ ₹36,14,400 | 0.031% |
To cross the ₹10,000 TDS threshold on this dividend, a shareholder would need to hold more than 6,098 shares — an investment exceeding ₹2.2 crore at current prices. The overwhelming majority of retail holders will face zero TDS but must still declare and pay tax on the amount in their return.
Key Risks
1. Cash Conversion Risk
Operating cash flow of ₹13.48 crore against PAT of ₹367.96 crore is a 3.7% conversion. If receivables and inventory continue expanding faster than collections, the company may need external funding to sustain growth, even with strong reported profits.
2. Customs Litigation Exposure
The Commissioner of Customs, Chennai issued an order dated 13 January 2026 demanding differential duty of ₹10.33 crore plus penalties, aggregating ₹30.86 crore excluding interest, on alleged incorrect concessional duty on 4G router imports. An appeal was filed before CESTAT on 7 April 2026. Only ₹6.00 crore has been deposited under protest. No provision has been made.
3. Noida Land Completion Certificate Risk
The company carries ₹61.68 crore as capital work in progress on leasehold land at Sector 135, Noida. Construction was not completed within the deadline extended to 31 December 2024, partly due to GRAP-4 pollution construction bans in Delhi NCR. The extension application filed on 12 October 2024 remains pending with the Noida Authority, which has raised fresh queries. Approval also requires clearance from the Government of Uttar Pradesh.
4. Goodwill Impairment Risk
₹534.95 crore of goodwill from the AIL Dixon acquisition sits on the balance sheet, equal to 28.5% of total equity and roughly 1.45x annual PAT. Any future write-down would materially dent reported earnings.
5. Valuation and Expectation Risk
The stock trades at a reported P/E above 110x and roughly 22-23x book value, having risen approximately 235% over one year and 256% from its ₹1,015 low of 5 August 2025. At those multiples the market is pricing in sustained hyper-growth. Any quarter of margin slippage carries outsized downside.
6. Concentration and Single-Segment Risk
The Board confirms there are no separate reportable segments under Ind AS 108 — the entire business is security and surveillance equipment, with the majority of sales in India. There is no geographic or product diversification cushion.
7. Labour Code Cost Risk
The four new Labour Codes notified on 21 November 2025 have already cost ₹7.66 crore in FY26 consolidated employee benefit expenses. The company states it "continues to monitor the finalisation of Central and State Rules" — meaning the full recurring cost is not yet known.
8. Import and Supply Chain Risk
Cost of materials consumed jumped to ₹2,031.28 crore from ₹703.83 crore as the business shifted toward manufacturing. With a Shenzhen subsidiary and a Taiwan R&D entity, the group carries exposure to semiconductor supply constraints and currency movement — foreign exchange and translation losses were ₹3.33 crore in FY26 against a gain in FY25.
What To Monitor
1. Operating Cash Flow Conversion in Q1 and Q2 FY27
The single most important metric. Watch whether OCF as a percentage of PAT moves from 3.7% toward a normal 50-70%. Half-yearly cash flow statements will show this.
2. Receivable Days Trajectory
Receivables of ₹1,404.36 crore represent roughly 121 days of sales. Also track the expected credit loss allowance, which doubled to ₹15.11 crore. Rising ECL against flat receivable days would signal dealer channel stress.
3. EBITDA Margin Durability
Margin expanded 546 basis points to 13.41% in one year. Watch whether the Q4 FY26 exit run-rate holds. A margin that was driven by a favourable input cycle rather than structural mix shift will mean-revert.
4. CESTAT Outcome on the Customs Appeal
Track disposal of the appeal filed 7 April 2026. An adverse ruling would crystallise up to ₹30.86 crore plus interest, against which only ₹6.00 crore is deposited.
5. Noida Authority Completion Certificate
Watch for an exchange announcement confirming the extension and completion certificate. Continued delay keeps ₹61.68 crore of capital work in progress non-productive and unamortised.
6. Corelink Cable JV Execution
The 50:50 joint venture with Orient Cables (India) Limited, agreed 16 April 2026, is still in incorporation. Track first-year capital commitment, capacity and whether it drags on consolidated margins during ramp-up.
7. Capacity Expansion Capex Discipline
Capex rose to ₹136.33 crore from ₹26.49 crore, with new plants discussed for Kadapa and Rajasthan. Watch capex-to-revenue ratio and whether incremental capacity is backed by order visibility.
8. FY27 Dividend Decision
The FY27 Board recommendation, likely around May 2027, will reveal whether ₹1.64 was a one-off gesture or the start of a policy. Watch specifically for whether the company publishes a formal Dividend Distribution Policy with a stated payout band.
Conclusion
Positives
- Underlying PAT excluding FY25's exceptional gain grew 258.2%.
- EBITDA margin expanded 546 basis points to 13.41%.
- Gross borrowings cut from ₹412.85 crore to ₹112.93 crore; company is net-cash positive by ₹86.66 crore.
- Dividend covered 19.5x by earnings and 10.3x by cash.
- Clean, unmodified audit opinion from Walker Chandiok & Co LLP on both standalone and consolidated results.
- Zero promoter pledging; DII holding of 14.74% signals institutional confidence.
- Nearly all IPO proceeds deployed as promised — only ₹11.37 crore pending.
Negatives
- Operating cash flow of ₹13.48 crore is just 3.7% of reported profit.
- Free cash flow is negative ₹122.85 crore. The dividend is not funded by cash the business generated.
- Working capital days rose from 40.8 to 73.9; receivables now ₹1,404.36 crore.
- Yield of 0.05% is economically negligible for income investors.
- 74.74% of the payout flows to promoters.
- Goodwill of ₹534.95 crore is 28.5% of equity, unimpaired and untested by a downturn.
- Unprovided customs demand of ₹30.86 crore and unresolved Noida land certificate.
- No dividend policy, no rationale and no guidance disclosed.
The Honest Summary
Aditya Infotech's first listed dividend is a symbolic gesture from a genuinely improving business with a genuine cash conversion problem. The operating story is strong: revenue up 35.6%, margins up 546 basis points, debt cut by 73%, underlying profit up 258%. The cash story is not: ₹13.48 crore of operating cash flow and negative free cash flow of ₹122.85 crore.
A ₹19.33 crore payout is far too small to be affected by that gap. But it is large enough to be a signal — and the signal is that management is prioritising growth and reinvestment over distribution, which at a 5.25% payout ratio is exactly what the numbers say they should do. Investors should evaluate this stock on cash conversion and margin durability, not on 164%.
Frequently Asked Questions
What dividend has Aditya Infotech announced for FY 2025-26?
What is the dividend yield on Aditya Infotech shares?
What is the record date for the Aditya Infotech dividend?
What is the ex-date and why does it matter?
When will the Aditya Infotech dividend be paid?
Who is eligible to receive this dividend?
How will this dividend be taxed?
Is the Aditya Infotech dividend sustainable?
What is Aditya Infotech's dividend history?
What should investors monitor after this dividend?
Why did EPS fall to ₹32.05 when the business grew so strongly?
How much of this dividend goes to the promoters?
Does 164% mean I get 164% return on my investment?
What is the difference between a final dividend and an interim dividend?
Is buying just before the record date a way to earn the dividend quickly?
Disclaimer
This report is published by ShareBazaar Online for informational and educational purposes only. It does not constitute investment advice, a recommendation, or an offer to buy or sell any security. ShareBazaar Online is not a SEBI-registered investment adviser or research analyst.
All company-specific financial data is sourced from the audited standalone and consolidated financial results of Aditya Infotech Limited for the year ended 31 March 2026, filed with NSE and BSE on 27 May 2026. Market prices, shareholding data and peer figures are sourced from public market data providers as cited within the report and were current as at 17 July 2026; prices change continuously and should be independently verified.
Ratios described as computed by ShareBazaar Online — including yield, payout ratio, coverage ratios, free cash flow, net debt, ROE and ROCE — are our own calculations from the audited statements and are not figures disclosed by the company. Different computation conventions will produce different results.
The dividend discussed is a Board recommendation subject to shareholder approval at the AGM on 4 August 2026 and may be modified or not approved. Taxation commentary reflects our understanding of Indian income tax law as at the date of publication and is general in nature; readers should consult a qualified chartered accountant or tax adviser regarding their own circumstances.
Investments in securities are subject to market risks. Past performance is not indicative of future results. Readers should conduct their own due diligence and consult a SEBI-registered financial adviser before making any investment decision. ShareBazaar Online and its authors accept no liability for any loss arising from reliance on this report.