
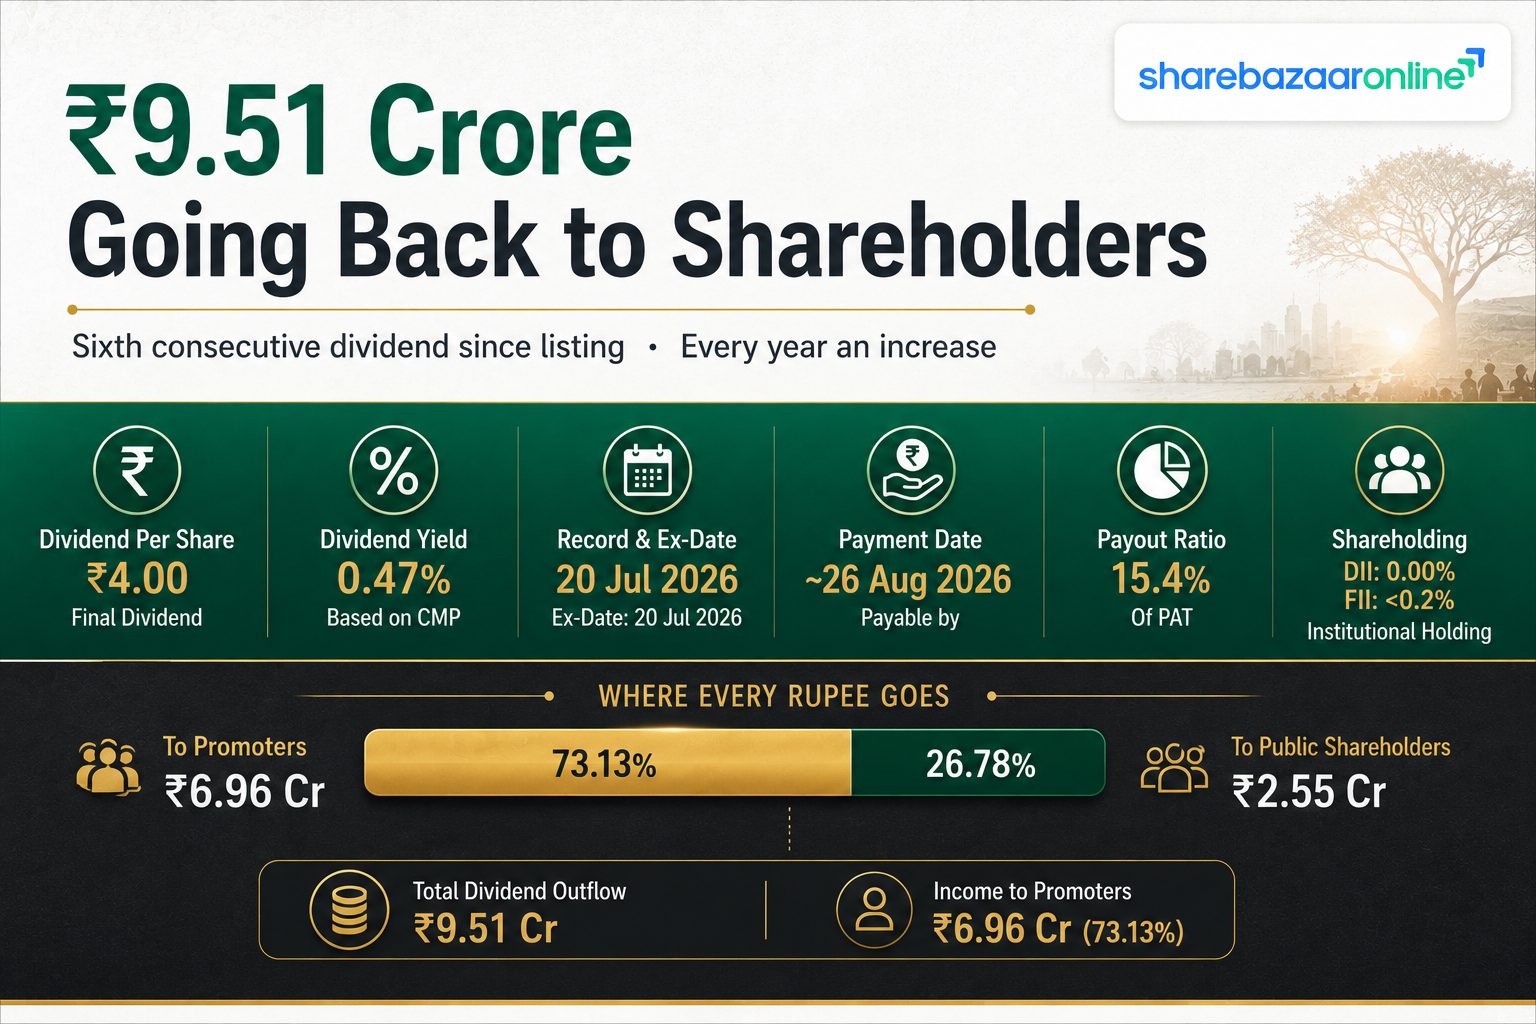
Dividend Status Banner
STATUS: UPCOMING — RECORD DATE NOT YET PASSED
As on 18 July 2026, the record date of 20 July 2026 for the NDR Auto Components final dividend of ₹4.00 per share has not yet passed. Shareholders whose names appear in the register of members on that date are eligible.
Two cautions before you act on this. First, the dividend is recommended, not declared — it requires shareholder approval at the 7th AGM scheduled for 27 July 2026. Second, the ex-date and record date fall on the same day (20 July 2026) under the T+1 settlement cycle, which means the last day to purchase shares with dividend entitlement is the previous trading session, 17 July 2026 — which has already passed.
What this means in plain language
If you did not already own NDRAUTO shares at the close of 17 July 2026, buying now will not get you this ₹4 dividend. You will still own the stock, but the dividend belongs to whoever held it before the ex-date. This is a factual timeline point, not a view on the stock.
Dividend Snapshot
COMPANY IDENTIFIERS
Company: NDR Auto Components Limited
NSE Symbol: NDRAUTO
BSE Scrip Code: 543214
ISIN: INE07OG01012
CIN: L29304DL2019PLC347460
Sector: Auto Ancillaries — Seating Systems
DIVIDEND TERMS
Dividend Type: Final Dividend
Dividend Per Share: ₹4.00
Dividend Percentage: 40% of face value
Face Value: ₹10 per share
Financial Year: FY2025-26 (ended 31 March 2026)
AGM Approval Required: Yes — 7th AGM, 27 July 2026
SIZE OF THE PAYOUT
Total Dividend Outflow: ₹9.51 Crore (₹951.41 lakh, as stated in Note 8 of the audited results)
Shares Outstanding: 2,37,85,300 equity shares
Paid-up Share Capital: ₹23.79 Crore
Previous Year Outflow: ₹6.48 Crore (dividend paid during FY26 cash flow)
YIELD & COVERAGE HEADLINES
Dividend Yield (at ₹850 CMP): 0.47%
Payout Ratio (Consolidated): 15.4%
Dividend Coverage (Consol EPS): 6.51 times
Cash Coverage: 2.44 times
Free Cash Flow Coverage: Negative — FCF was minus ₹36.3 Crore
Dividend Announcement Summary
The Board of Directors of NDR Auto Components met on 11 May 2026 between 12:15 p.m. and 1:40 p.m. and, under Regulation 43 of the SEBI LODR Regulations, recommended a final dividend of 40%, that is ₹4.00 on each equity share of ₹10 face value, for the year ended 31 March 2026. The company states the dividend will be paid within 30 days of declaration, once shareholders approve it.
Note 8 to the audited standalone results quantifies the commitment at ₹951.41 lakh, or ₹9.51 Crore. The same figure appears in Note 10 of the consolidated results, so there is no ambiguity about the size of the outflow.
Other board decisions the same day
- Audited standalone and consolidated results for Q4 and FY26 approved, with an unmodified audit opinion from S.R. Batliboi & Co. LLP
- Re-appointment of three Whole-time Directors — Mr Pranav Relan, Mr Ayush Relan and Mr Rajat Bhandari — each for three years, subject to shareholder approval
- Transfer of the Seat Trim business to wholly owned subsidiary NDR Auto Components South Pvt Ltd by slump sale, valued at ₹9.48 Crore
- Transfer of the Sunshade business to joint venture NDR Hayashi Automotive India Pvt Ltd by slump sale, valued at ₹9.44 Crore
- Investment of ₹6.00 Crore in the rights issue of NDR Hayashi Automotive India Pvt Ltd
Why the restructuring matters to a dividend reader
On the same day it committed ₹9.51 Crore to shareholders, the board also committed ₹6.00 Crore of fresh cash to a joint venture. It simultaneously moved two revenue streams — Seat Trim at ₹11.51 Crore of revenue (1.4% of turnover) and Sunshade at ₹23.12 Crore (2.81%) — out of the listed entity into a subsidiary and a JV respectively.
The Seat Trim move stays inside the consolidated group, so consolidated numbers are unaffected. The Sunshade move goes to a JV, which is equity-accounted rather than fully consolidated. In practical terms, roughly ₹23 Crore of revenue will stop appearing as the group's own topline and will instead show up only as a share of profit. Readers comparing FY27 revenue against FY26 should expect this optical drag.
Key Dates Timeline
| EVENT | DATE | STATUS |
|---|---|---|
| Board Meeting / Announcement | 11 May 2026 | Completed |
| Last day to buy with entitlement | 17 July 2026 | Passed |
| Ex-Dividend Date | 20 July 2026 | Upcoming |
| Record Date / Cut-off Date | 20 July 2026 | Upcoming |
| 7th Annual General Meeting (VC/OAVM) | 27 July 2026 | Upcoming |
| Payment Date | Not Disclosed by Company — payable within 30 days of declaration, so on or before approximately 26 August 2026 | Pending |
Understanding record date versus ex-date
The record date is the day the company freezes its shareholder register to decide who gets paid. The ex-date is the first day the share trades without the right to that dividend. Since India moved to a T+1 settlement cycle, a trade settles the next working day, so the ex-date and record date now typically fall on the same calendar day. To be on the register on 20 July, the purchase had to be executed by 17 July 2026, the preceding trading session.
Dividend Yield Analysis
YIELD AT CURRENT MARKET PRICE
Latest traded price used: ₹850.00 (NSE close, 9 July 2026, per Bajaj Broking market data). Investing.com data shows the stock closed at ₹887.80 on 3 July 2026, giving a sense of the recent range.
Calculation: ₹4.00 ÷ ₹850.00 × 100 = 0.47%
At ₹887.80 the yield would be 0.45%. Either way, the yield sits below half a percent.
YIELD AT ANNOUNCEMENT DATE PRICE
The exact NSE closing price on 11 May 2026 is Not Disclosed by Company and could not be verified from a primary exchange source for this report.
For context, third-party market data shows the stock at approximately ₹703 on 3 May 2026 and ₹784.65 on 10 June 2026. Against a price in that band, the announcement-date yield would have been roughly 0.51% to 0.57%. Treat this as indicative, not verified.
Yield Reality Check — what is actually driving this number
A 0.47% yield is low in absolute terms, and it is important to be precise about why. It is not because the dividend was cut. The dividend was raised 45.5%, from ₹2.75 to ₹4.00 per share. The yield is low because the share price is high relative to the payout. At roughly 31 to 34 times earnings, the market is pricing NDRAUTO as a growth compounder, and a company on that multiple mathematically cannot produce a large yield while retaining most of its profit.
There is a second, less comfortable observation. The stock is down approximately 18.5% over the past year and sits roughly 30% below its 52-week high of ₹1,220. In a falling-price scenario, yield normally rises. Here it has stayed under 0.5% even after a 45% dividend increase and a 30% price decline — which tells you how small the payout is relative to the market capitalisation of roughly ₹2,020 Crore. The dividend is a rounding item, not an income proposition.
Dividend History Analysis
DIVIDEND TRACK RECORD SINCE LISTING
| FINANCIAL YEAR | DIVIDEND / SHARE | EX-DATE | GROWTH |
|---|---|---|---|
| FY2020-21 | ₹0.25 | 14 Sep 2021 | First payout |
| FY2021-22 | ₹0.63 | 22 Jun 2022 | +152% |
| FY2022-23 | ₹1.25 | 12 Jul 2023 | +98% |
| FY2023-24 | ₹1.88 | 15 Jul 2024 | +50% |
| FY2024-25 | ₹2.75 | 3 Jul 2025 | +46% |
| FY2025-26 | ₹4.00 | 20 Jul 2026 | +45.5% |
Historical per-share figures for FY21 to FY25 sourced from TipRanks dividend history. The company has executed two stock splits since listing, so older per-share amounts may be presented on a split-adjusted basis; the FY25 figure of ₹2.75 is corroborated by Business Standard, which records the latest dividend at 27.50% of face value.
Classification: Consistent Payer
NDR Auto Components listed in July 2020 and has paid a dividend in every one of the six financial years since. There has been no cut, no suspension and no skipped year. Every single year the amount has increased, and the compounded growth from ₹0.25 to ₹4.00 over five years works out to roughly 74% per annum.
On the raw consistency test, this is a clean record. It classifies as a Consistent Payer, not cyclical and not irregular.
The qualifier a reader should hold on to
Six years is a short history for judging dividend reliability, and critically, the company has never been tested through a downturn. It listed in 2020 and has grown revenue and profit in essentially a straight line since. There is no evidence yet of how the board behaves when earnings fall.
There have been no special dividends and no buybacks in this period. Every rupee returned has come through the ordinary final dividend route.
Financial Performance Analysis
CONSOLIDATED FY26 VERSUS FY25 (₹ CRORE)
| PARTICULARS | FY26 | FY25 | GROWTH |
|---|---|---|---|
| Revenue from Operations | 822.54 | 712.78 | +15.4% |
| Cost of Materials Consumed | 615.11 | 544.22 | +13.0% |
| Employee Benefits Expense | 28.68 | 21.61 | +32.7% |
| Other Expenses | 90.21 | 75.21 | +19.9% |
| Depreciation & Amortisation | 21.10 | 16.12 | +30.9% |
| EBITDA (computed) | 93.57 | 77.65 | +20.5% |
| Share of Profit — Associate | 11.94 | 9.40 | +27.1% |
| Share of Profit — Joint Ventures | (0.85) | 0.22 | Turned to loss |
| Exceptional Item (Labour Codes) | 0.65 | Nil | New |
| Profit Before Tax | 79.63 | 67.91 | +17.3% |
| Profit After Tax | 61.94 | 53.26 | +16.3% |
| Basic EPS (₹) | 26.04 | 22.39 | +16.3% |
All figures converted from the ₹ lakh presentation in the audited results to ₹ Crore. EBITDA computed as total income less total expenses, adding back depreciation and finance costs.
Operating Leverage — positive, and here is where it came from
Revenue rose 15.4% while EBITDA rose 20.5%. Profits grew faster than sales, which is the definition of positive operating leverage.
The single biggest driver is raw material cost discipline. Material cost grew only 13.0% against 15.4% revenue growth, so material cost as a share of revenue fell from 76.4% to 74.8%. That 160 basis point improvement on a ₹822 Crore base is worth roughly ₹13 Crore at the gross margin line, and it is essentially the whole story of the margin expansion.
EBITDA margin improved from 10.89% to 11.38%.
The cost lines that ran ahead of revenue
Two lines grew materially faster than the topline and deserve monitoring:
- Employee costs up 32.7% against 15.4% revenue growth. Staff cost as a share of revenue rose from 3.03% to 3.49%. Part of this is the new Labour Codes effective 21 November 2025, which the company has separately provided for as a ₹0.65 Crore exceptional item covering gratuity and compensated absences.
- Depreciation up 30.9%, reflecting the large capex programme. Gross property, plant and equipment on the consolidated balance sheet jumped from ₹124.13 Crore to ₹201.59 Crore, and right-of-use assets from ₹28.79 Crore to ₹67.74 Crore. Depreciation will keep climbing as these assets run a full year.
The joint venture line also flipped, from a ₹0.22 Crore profit to a ₹0.85 Crore loss, as new JVs absorb start-up costs.
Consolidated versus Standalone — a ₹8.9 Crore gap that matters
Revenue is identical in both sets (₹822.54 Crore), because the subsidiaries reported nil revenue in FY26 per the auditor's Other Matter paragraph. But profit differs sharply: standalone PAT is ₹53.05 Crore (EPS ₹22.30) while consolidated PAT is ₹61.94 Crore (EPS ₹26.04).
The entire gap comes from the share of profit of associate Bharat Seats Limited, at ₹11.94 Crore, offset by JV losses. This is an important nuance for a dividend reader: a meaningful slice of consolidated earnings is equity-accounted profit sitting in another company's books, not cash the parent controls. The parent does receive some of it as dividend — the cash flow shows ₹1.98 Crore of dividend received from the associate in FY26. So of the ₹11.94 Crore of associate profit recognised, only about 17% arrived as actual cash.
Under Indian company law, dividends are paid out of the standalone profits of the company. On that basis the payout ratio is 17.9%, not 15.4%.
Cash Flow Analysis
FLAGGED FINDING — APPARENT PRESENTATION ERROR IN THE CONSOLIDATED CASH FLOW STATEMENT
The consolidated cash flow statement as filed shows "Cash generated from operating activities" of minus ₹36.55 Crore and "Net cash flows from operating activities" of minus ₹54.52 Crore. Taken at face value, that would mean the group burned ₹54 Crore from operations while declaring a ₹9.51 Crore dividend — an alarming picture.
It does not reconcile. Adding the three reported sections gives operating minus ₹54.52 Crore, investing minus ₹59.21 Crore and financing minus ₹13.61 Crore, totalling minus ₹127.34 Crore. But the statement's own closing line shows a net decrease of only ₹35.70 Crore, matching the movement in cash from ₹50.80 Crore to ₹15.10 Crore.
The arithmetic shows the filed subtotal has omitted the operating profit before working capital changes of ₹91.64 Crore. Restoring it: ₹91.64 Crore minus working capital outflow of ₹36.55 Crore equals ₹55.09 Crore generated, less tax paid of ₹17.97 Crore, giving net operating cash flow of approximately ₹37.12 Crore. That figure reconciles the statement exactly.
Our corrected figure is independently corroborated: Simply Wall St's analysis of NDRAUTO reports negative free cash flow of ₹363 million, or ₹36.3 Crore — which is precisely ₹37.12 Crore of operating cash flow less ₹73.44 Crore of capex. The rest of this section uses the corrected figure.
OPERATING CASH FLOW VERSUS NET PROFIT (₹ CRORE)
| MEASURE | FY26 | FY25 |
|---|---|---|
| Consolidated PAT | 61.94 | 53.26 |
| Consol OCF (corrected) | 37.12 | 9.70 |
| OCF as % of PAT | 60% | 18% |
| Standalone PAT | 53.05 | 45.08 |
| Standalone OCF | 37.50 | 83.82 |
| Standalone OCF as % of PAT | 71% | 186% |
Reading the cash quality
Reported profit is an accounting judgement. Cash is not. The gap between the two is where a dividend reader should look first.
On the standalone books the picture deteriorated sharply. In FY25 the company converted ₹100 of profit into ₹186 of operating cash. In FY26 it converted ₹100 of profit into only ₹71 of cash — and operating cash flow fell in absolute terms from ₹83.82 Crore to ₹37.50 Crore, a 55% decline, in a year when profit rose 17.7%.
That divergence is the single most important number in this filing, and it is nowhere in the headline announcement.
Why cash conversion fell — working capital, line by line
Operating profit before working capital changes was actually higher in FY26 at ₹91.64 Crore versus ₹74.12 Crore. The entire deterioration came from working capital, which consumed ₹36.55 Crore in FY26 against generating cash in FY25. The main movements on the standalone statement:
- Other financial assets absorbed ₹16.96 Crore — the largest single drag, and a sixfold jump from ₹0.51 Crore last year
- Trade payables reversed by ₹6.03 Crore, against a ₹29.72 Crore inflow in FY25. In simple terms, the company had been funding itself with supplier credit and that tailwind stopped. This swing alone is worth ₹35.75 Crore year on year
- Other liabilities absorbed ₹6.48 Crore versus a ₹12.00 Crore inflow prior year
- Contract liabilities fell ₹5.01 Crore
- Inventories absorbed ₹3.43 Crore and receivables ₹7.34 Crore
Receivables versus revenue — the good news
Trade receivables rose from ₹93.48 Crore to ₹100.82 Crore, up 7.8%, against revenue growth of 15.4%. Receivables grew at half the rate of sales.
Debtor days improved from roughly 47.9 days to 44.7 days. There is no sign here of revenue being manufactured through loose credit terms — a common red flag in auto ancillaries chasing volume. Collection quality is intact.
Free Cash Flow — the number that decides the funding question
Consolidated capex in FY26 was ₹73.44 Crore on property, plant, equipment, intangibles and capital work in progress.
Free Cash Flow = ₹37.12 Crore operating cash flow minus ₹73.44 Crore capex = minus ₹36.32 Crore.
On the standalone books: ₹37.50 Crore minus ₹61.54 Crore capex = minus ₹24.04 Crore.
So how is this dividend actually being funded?
The honest answer is from cash reserves, not from surplus cash generation. Free cash flow was negative in FY26, so by definition the ₹9.51 Crore payout cannot be covered by cash left over after investment.
The balance sheet confirms it. Consolidated cash and cash equivalents fell from ₹50.80 Crore to ₹15.10 Crore, a drawdown of ₹35.70 Crore. Including other bank balances, total liquid resources fell from ₹62.87 Crore to ₹23.25 Crore. The company also recovered ₹17.00 Crore of loans from related parties during the year, which helped fund the gap.
To be fair and precise: the dividend is not funded by borrowings — the company reports zero borrowings and repaid nothing during FY26 because there was nothing to repay. Nor is it funded by asset sales; proceeds from sale of assets were a negligible ₹0.19 Crore. It is funded by drawing down an accumulated cash pile while running an aggressive expansion programme. That is a legitimate choice, but readers should understand it is a choice, not an overflow.
Balance Sheet Strength
CONSOLIDATED POSITION (₹ CRORE)
| ITEM | 31-MAR-26 | 31-MAR-25 |
|---|---|---|
| Total Assets | 563.02 | 485.87 |
| Total Equity | 357.72 | 302.31 |
| Borrowings | Nil | Nil |
| Lease Liabilities (total) | 32.41 | 61.70 |
| Cash & Equivalents | 15.10 | 50.80 |
| Other Bank Balances | 8.15 | 12.07 |
| Total Liquid Resources | 23.25 | 62.87 |
| Investments in Associate/JV | 82.52 | 63.47 |
| Book Value per Share (₹) | 150.40 | 127.10 |
Return ratios (computed)
ROE (consolidated): ₹61.94 Cr PAT on average equity of ₹330.02 Cr = 18.8%
ROCE (approximate): EBIT of ₹82.91 Cr on capital employed of ₹390.13 Cr = 21.3%
ROCE is flattered somewhat because consolidated EBIT includes ₹11.94 Crore of equity-accounted associate profit while the associate's own capital sits in a single investment line. Excluding the associate contribution, the underlying operating ROCE is closer to 18%.
Debt-Equity: Zero on borrowings; 0.09x including lease liabilities
Current Ratio: ₹181.12 Cr current assets over ₹148.20 Cr current liabilities = 1.22x
The honest read on balance sheet strength
There is genuine strength here. Zero borrowings is not a small thing in a capital-intensive, cyclical industry, and it means the dividend is not being funded by leverage. Equity grew ₹55.41 Crore in the year against a ₹6.48 Crore dividend paid, so retained earnings are compounding.
But the liquidity direction is the concern. Cash and equivalents fell 70%, from ₹50.80 Crore to ₹15.10 Crore. Total liquid resources fell 63% to ₹23.25 Crore. Against that, the company has committed ₹9.51 Crore to dividend and a further ₹6.00 Crore to the JV rights issue — ₹15.51 Crore of commitments against ₹23.25 Crore of liquid resources, or two-thirds of the entire cash cushion. The current ratio of 1.22x is adequate but not comfortable, and it has slipped from 1.39x.
There is also a contingent tax exposure. Following an Income Tax search under Section 132 in FY2023-24, demands stand reduced to ₹3.67 Crore for AY2020-21 to AY2024-25, with a further ₹1.34 Crore including penalties for AY2022-23 still awaiting order. Management expects a favourable outcome and has made no provision, and the auditor has included an Emphasis of Matter paragraph on it — while keeping the opinion unmodified.
Dividend Sustainability Analysis
THE FOUR SUSTAINABILITY TESTS
| TEST | RESULT | VERDICT |
|---|---|---|
| Earnings Coverage | EPS ₹26.04 ÷ DPS ₹4.00 = 6.51x | Comfortable |
| Cash Coverage | ₹23.25 Cr ÷ ₹9.51 Cr = 2.44x | Adequate but thinning |
| Free Cash Flow Coverage | FCF minus ₹36.32 Cr = Negative | Fails |
| Debt Position | Zero borrowings | Strong |
Classification: Moderately Sustainable
This is not a distressed dividend. Earnings cover it 6.5 times over, the payout ratio of 15.4% is low by any standard, there is no debt, and profit is growing at a healthy 16.3%.
Equally, it is not a fully self-funding dividend. Free cash flow was negative ₹36.32 Crore. The payout is being met from an accumulated cash pile that shrank 63% in a single year while capex ran at ₹73.44 Crore, nearly double the year's operating cash flow.
What would change the classification
Upgrade to Sustainable if FY27 shows operating cash flow recovering toward the ₹70 to ₹90 Crore range as the capex cycle normalises, with working capital stabilising and cash balances rebuilding above ₹40 Crore.
Downgrade if capex stays above ₹70 Crore for a second year while operating cash flow stays near ₹37 Crore, because that would mean a third consecutive year of cash drawdown against a rising dividend. The company has publicly targeted ₹3,000 Crore of revenue by FY2030 against ₹822 Crore today, which implies the heavy capex is not finished.
The tension, stated plainly
A company targeting a 3.6-fold revenue increase in four years needs cash. A company raising its dividend 45.5% is sending cash out. Both of those things happened in the same board meeting, alongside a ₹6.00 Crore JV commitment. The ₹9.51 Crore dividend is small enough that it does not endanger the growth plan — it is roughly 13% of one year's capex. But it is fair to observe that the dividend increase outran the cash generation that year.
Peer Comparison
NDRAUTO VERSUS THE RELAN-FAMILY COMPARABLE
| METRIC | NDR AUTO | SHARDA MOTOR |
|---|---|---|
| Latest Dividend per Share | ₹4.00 | ₹32.50 |
| Dividend Yield | 0.47% | 1.71% to 3.46% depending on reference price |
| Payout Ratio | 15.4% consolidated | Not verified for this report |
| ROE | 18.8% | Not verified for this report |
| Market Cap | ₹2,020 Cr approx | ₹5,398 Cr to ₹5,598 Cr approx |
| Borrowings | Zero | Not verified for this report |
Sharda Motor figures compiled from Upstox, Investing.com, IndMoney and Choice India market data. Yield varies by source because reference prices differ. Where a figure could not be verified from a reliable source at the time of writing it has been marked accordingly rather than estimated.
Why Sharda Motor is the right comparison
Both companies trace back to the same promoter lineage — the Relan family, whose founder Late Shri N.D. Relan started in stockbroking in the 1930s before the group moved into automotive manufacturing, establishing Bharat Seats Limited and Sharda Motor Industries. Bharat Seats is NDR Auto's associate company and contributes ₹11.94 Crore of its consolidated profit.
Sharda Motor operates in emissions and suspension systems rather than seating, so the businesses are not identical, but the capital allocation philosophies of related promoter groups make for a fair contrast.
The contrast in one line
Sharda Motor pays out at a yield roughly four to seven times NDR Auto's. NDR Auto is a smaller company in the middle of an aggressive capacity build with a ₹650 Crore order book and a ₹3,000 Crore FY2030 revenue ambition; Sharda Motor is a larger, more mature business.
Neither approach is right or wrong. But an investor who bought NDRAUTO expecting Sharda-like income has misread the company. NDR Auto is retaining 84.6% of its earnings and putting them into plant. Broader auto ancillary peers include Samvardhana Motherson, Bosch, Uno Minda, Sona BLW, Endurance Technologies, Exide and ZF Commercial Vehicle Control Systems, per Business Today's peer classification.
Promoter Impact Analysis
DISTRIBUTION OF THE ₹9.51 CRORE
| SHAREHOLDER GROUP | HOLDING | DIVIDEND |
|---|---|---|
| Promoter & Promoter Group | 73.13% | ₹6.96 Cr |
| Foreign Institutional Investors | 0.07% to 0.18% | Under ₹0.02 Cr |
| Domestic Institutional Investors | 0.00% | Nil |
| Public & Retail | 26.78% | ₹2.55 Cr |
Shareholding pattern per Bajaj Broking and Screener.in market data. FII figure varies slightly across data providers.
What the split tells you
Roughly 73 paise of every rupee of this dividend goes to the promoter family. In absolute terms the promoter group receives ₹6.96 Crore and the entire public shareholder base shares ₹2.55 Crore.
This is a neutral structural fact, not an accusation. At a 15.4% payout ratio there is no evidence of cash being stripped out for promoter benefit — if that were the intent, the payout would be far higher. The promoters are leaving ₹52 Crore of their share of profit inside the company.
Notably, the three Whole-time Directors re-appointed at this same meeting — Mr Pranav Relan, Mr Ayush Relan and Mr Rajat Bhandari — each disclose Nil personal shareholding in the company.
The institutional absence is the more interesting signal
DII holding is zero. FII holding is under 0.2%. Combined institutional ownership is effectively nil in a company with a ₹2,000 Crore market capitalisation and 18.8% ROE. Business Standard data shows only a handful of PGIM India Midcap Fund schemes holding roughly 45,437 shares each.
The practical consequence for a dividend-focused reader is liquidity. Daily volumes shown across data providers run in the low thousands to low tens of thousands of shares — one session showed just 1,125 shares traded. In a thinly traded stock, exiting a position around the ex-date can cost more in price impact than the entire ₹4 dividend is worth.
Taxation Analysis
How dividends are taxed in India today
Since the Finance Act 2020 abolished Dividend Distribution Tax, dividends are taxed entirely in the hands of the shareholder. The company no longer pays tax on your behalf.
- Dividend is added to "Income from Other Sources" and taxed at your applicable slab rate
- A 5% investor pays 5%; a 30% slab investor pays 30%, plus applicable surcharge and 4% health and education cess
- TDS under Section 194: the company deducts 10% at source if total dividend from that company in the financial year exceeds ₹10,000
- If PAN is not furnished or is inoperative, TDS rises to 20%
- Investors below the taxable threshold can file Form 15G, or Form 15H if a senior citizen, to avoid TDS
- TDS is not the final tax. It is a credit against your total liability, adjusted when you file your return
- Interest expense on money borrowed to buy shares is deductible against dividend income, capped at 20% of the dividend
Tax rules and thresholds are subject to change by the Finance Act. Confirm the position applicable to your circumstances with a qualified tax adviser before acting.
WORKED EXAMPLE — 1,000 SHARES, 30% SLAB
| Shares held | 1,000 |
| Dividend per share | ₹4.00 |
| Gross Dividend | ₹4,000 |
| TDS deducted at source | Nil — below the ₹10,000 threshold |
| Amount credited to bank | ₹4,000 |
| Tax at 30% plus 4% cess | ₹1,248 |
| Net Dividend after tax | ₹2,752 |
| Investment at ₹850 per share | ₹8,50,000 |
| Pre-tax yield | 0.47% |
| Post-tax effective yield | 0.32% |
When TDS actually kicks in for this dividend
At ₹4.00 per share, you would need to hold more than 2,500 shares for your dividend to cross the ₹10,000 TDS threshold. That is an investment of roughly ₹21.25 lakh at ₹850 per share.
Illustration at 3,000 shares:
- Gross dividend: ₹12,000
- TDS at 10%: ₹1,200
- Credited to bank: ₹10,800
- Final tax at 30% plus cess: ₹3,744
- Balance payable at filing: ₹2,544
- Net in hand: ₹8,256
The uncomfortable arithmetic for a high-slab investor: a 0.32% post-tax yield is well below what a savings bank account pays. This dividend is not an income strategy.
Key Risks
1. Single-customer and single-segment concentration
Note 2 of the results confirms the company operates in one reportable business segment and one geography, India. Its corporate office is inside the Maruti Joint Venture Complex, Gurugram, and reported order momentum is described as driven by Maruti Suzuki orders. A slowdown at one customer flows almost undiluted into revenue.
2. Cash conversion deterioration
Standalone operating cash flow fell 55%, from ₹83.82 Crore to ₹37.50 Crore, in a year profit rose. Cash and equivalents dropped 70%. If working capital does not normalise in FY27, the company would be funding both capex and a rising dividend from a shrinking base.
3. Capex outrunning internal accruals
FY26 capex of ₹73.44 Crore was roughly double operating cash flow. Gross PPE rose from ₹124.13 Crore to ₹201.59 Crore. If the ₹3,000 Crore FY2030 revenue target requires continued spending at this pace, the company may eventually need external funding — and a debt-free balance sheet is one of its main current strengths.
4. Unresolved Income Tax search proceedings
A Section 132 search took place in FY2023-24. Demands now stand at ₹3.67 Crore for AY2020-21 to AY2024-25 after CIT(Appeals) relief, with ₹1.34 Crore including penalties for AY2022-23 still pending. No provision has been made. The auditor carries this as an Emphasis of Matter in both standalone and consolidated reports. An adverse ruling would hit the same cash pool funding the dividend.
5. Earnings dependence on an equity-accounted associate
Bharat Seats Limited contributes ₹11.94 Crore, roughly 19%, of consolidated PAT — but only ₹1.98 Crore of that arrived as cash dividend. NDR Auto does not control Bharat Seats' payout policy. A weak year at the associate would dent headline consolidated EPS without any operational change at NDR Auto itself.
6. Restructuring reduces reported topline
The Sunshade slump sale moves ₹23.12 Crore, or 2.81% of turnover, to an equity-accounted JV. Combined with the JV share of profit already turning to a ₹0.85 Crore loss, near-term consolidated numbers may look softer even if the underlying businesses perform.
7. Very low trading liquidity
With institutional ownership near zero and daily volumes running from around 1,125 shares to a few tens of thousands, the bid-ask spread and price impact can easily exceed the ₹4 dividend. This is a structural risk for anyone treating the dividend as a tradeable event.
8. Cost inflation on employee and lease lines
Employee costs rose 32.7% against 15.4% revenue growth, and the New Labour Codes effective 21 November 2025 have already triggered a ₹0.65 Crore exceptional charge. The company itself states it will continue to monitor further clarifications, meaning additional adjustments are possible. Right-of-use assets more than doubled to ₹67.74 Crore, locking in higher depreciation and lease interest.
What To Monitor
1. Operating cash flow in the FY27 half-year
The single most important number. Standalone OCF needs to move back toward and above ₹60 Crore on an annualised basis for the dividend to become self-funding. Watch specifically whether the ₹16.96 Crore absorbed by other financial assets reverses.
2. Trade payables trajectory
The swing from a ₹29.72 Crore inflow to a ₹6.03 Crore outflow was the biggest single cash drag. If supplier credit continues tightening, cash conversion stays weak regardless of profit growth.
3. Capital work in progress conversion
Consolidated CWIP stands at ₹19.35 Crore against ₹27.70 Crore a year earlier, while gross PPE jumped ₹77 Crore — so projects are commissioning. Watch whether the ₹650 Crore order book converts into revenue at the margins these new assets were justified on.
4. Material cost as a percentage of revenue
The improvement from 76.4% to 74.8% drove the whole margin story. Steel and fabric price movements, and whether the annual customer price revisions referenced in Note 6 land favourably, will determine if this holds.
5. Outcome of the AY2022-23 tax order
The CIT(Appeals) order for AY2022-23, covering ₹1.34 Crore including penalties, is still awaited. Watch whether this and the residual ₹3.67 Crore resolve favourably or force a provision that would hit reported profit and cash.
6. Performance of the new joint ventures
JV share of profit turned from +₹0.22 Crore to minus ₹0.85 Crore. With the Sunshade business and a further ₹6.00 Crore equity now going into NDR Hayashi, track whether these move to profit or continue to drag consolidated earnings.
7. Bharat Seats' own results and dividend policy
Nearly a fifth of consolidated profit comes from this associate, yet only ₹1.98 Crore came through as cash. If Bharat Seats raises its own payout, NDR Auto's cash position improves without any operational change.
8. Whether the corrected cash flow figure is restated
Given the arithmetic inconsistency identified in the consolidated cash flow statement, watch the full annual report and any subsequent exchange filing for a corrected or clarified presentation. Readers should verify against the final published annual report before relying on either version.
Conclusion
The Positives
- Sixth consecutive dividend since listing, with an increase every single year and a 45.5% rise this year
- Zero borrowings — the dividend is not funded by debt
- Earnings cover the payout 6.51 times; payout ratio of just 15.4% leaves large headroom
- Revenue up 15.4%, EBITDA up 20.5%, PAT up 16.3% — genuine positive operating leverage
- Material cost ratio improved 160 basis points to 74.8% of revenue
- Receivables grew at half the rate of revenue; debtor days improved to 44.7
- Unmodified audit opinion from S.R. Batliboi & Co. LLP
- ROE of 18.8% and book value per share up from ₹127 to ₹150
The Negatives
- Free cash flow was negative ₹36.32 Crore — the dividend is not covered by cash generation
- Standalone operating cash flow fell 55% even as profit rose 17.7%
- Cash and equivalents fell 70%, from ₹50.80 Crore to ₹15.10 Crore
- Yield of 0.47%, or 0.32% post-tax at the 30% slab — below a savings account
- Capex of ₹73.44 Crore was roughly double operating cash flow
- Employee costs grew 32.7%, more than twice revenue growth
- Unresolved tax demands of ₹5.01 Crore in aggregate with no provision made
- Institutional ownership effectively zero; very thin trading liquidity
- An apparent arithmetic inconsistency in the filed consolidated cash flow statement
Where that leaves a reader
NDR Auto Components has done what a growing company is supposed to do: grown revenue and profit, kept debt at zero, improved gross margins, and shared a small and rising slice with shareholders. On the numbers that make headlines, the year was good.
Underneath, the cash story is more strained than the profit story. Profit rose while cash generation halved, and the company funded a record capex year, a higher dividend and a JV investment by running its cash balance down by 63%. That is a defensible allocation choice for a business chasing a ₹3,000 Crore revenue target, but it means this dividend was paid from savings rather than from surplus.
For anyone reading this as an income opportunity, the arithmetic is unforgiving: 0.32% net at the top slab. This dividend is best understood as a signal of board confidence and a modest sweetener on a growth holding, not as a source of income. We present the positives, the negatives, the risks and the monitoring factors. The decision is yours.
Frequently Asked Questions
What dividend has NDR Auto Components announced for FY2025-26?
What is the dividend yield on NDRAUTO at the current price?
What is the record date for the NDR Auto Components dividend?
What is the ex-date, and have I missed it?
When will the dividend actually be paid?
Who is eligible to receive this dividend?
Is the dividend guaranteed now that the board has recommended it?
How is this dividend taxed in my hands?
Is this dividend sustainable?
What is NDR Auto Components' dividend history?
Why did the dividend go up 45% when operating cash flow went down?
How much of this dividend goes to the promoters?
What else did the board decide alongside the dividend?
Should I look at consolidated or standalone numbers for this dividend?
What should investors monitor from here?
Disclaimer
This article is published by ShareBazaar Online for information and educational purposes only. It does not constitute investment advice, nor a recommendation, offer or solicitation to buy or sell any security. ShareBazaar Online is not a SEBI-registered investment adviser or research analyst.
All company-specific figures are derived from the exchange intimation and audited financial results filed by NDR Auto Components Limited with BSE Limited and the National Stock Exchange of India Limited on 11 May 2026. Market prices, shareholding data, peer figures and historical dividend records are sourced from third-party providers as cited within the article and were current at the time of writing; these may since have changed. Ratios described as computed are our own calculations from the filed statements and are shown with their workings.
Readers should note that this report identifies an apparent arithmetic inconsistency in the consolidated cash flow statement as filed. Our corrected figure is presented transparently along with the reconciliation supporting it, but readers should independently verify against the company's final annual report before relying on either figure.
The dividend described is recommended and subject to shareholder approval at the Annual General Meeting. Dividend amounts, record dates, payment dates and tax treatment are subject to change. Tax positions vary by individual circumstance and are subject to amendment by the Finance Act.
Investments in securities are subject to market risks. Past dividend performance is not indicative of future payouts. Please read all scheme and offer documents carefully and consult a SEBI-registered investment adviser and a qualified tax professional before making any investment decision. ShareBazaar Online and its authors accept no liability for any loss arising from the use of this information.