
ShareBazaar Online · Dividend Research
Nelcast Limited Final Dividend FY2025-26 — ₹0.70 per Share (35%): Full Analysis
NSE: NELCAST | BSE: 532864 | ISIN: INE189I01024 | Face Value: ₹2 | Published: 18 July 2026
Dividend Status
Record date is 20 July 2026 — not yet passed as of publication (18 July 2026).
This is a recommended final dividend and is subject to shareholder approval at the 44th AGM on 27 July 2026. If approved, it will be paid within 30 days of declaration (on or before ~26 August 2026). Under India's T+1 settlement, the ex-date and record date effectively coincide; the last cum-dividend trading session is expected on or around 17 July 2026. Investors should verify the exchange-notified ex-date before trading.
Dividend Snapshot
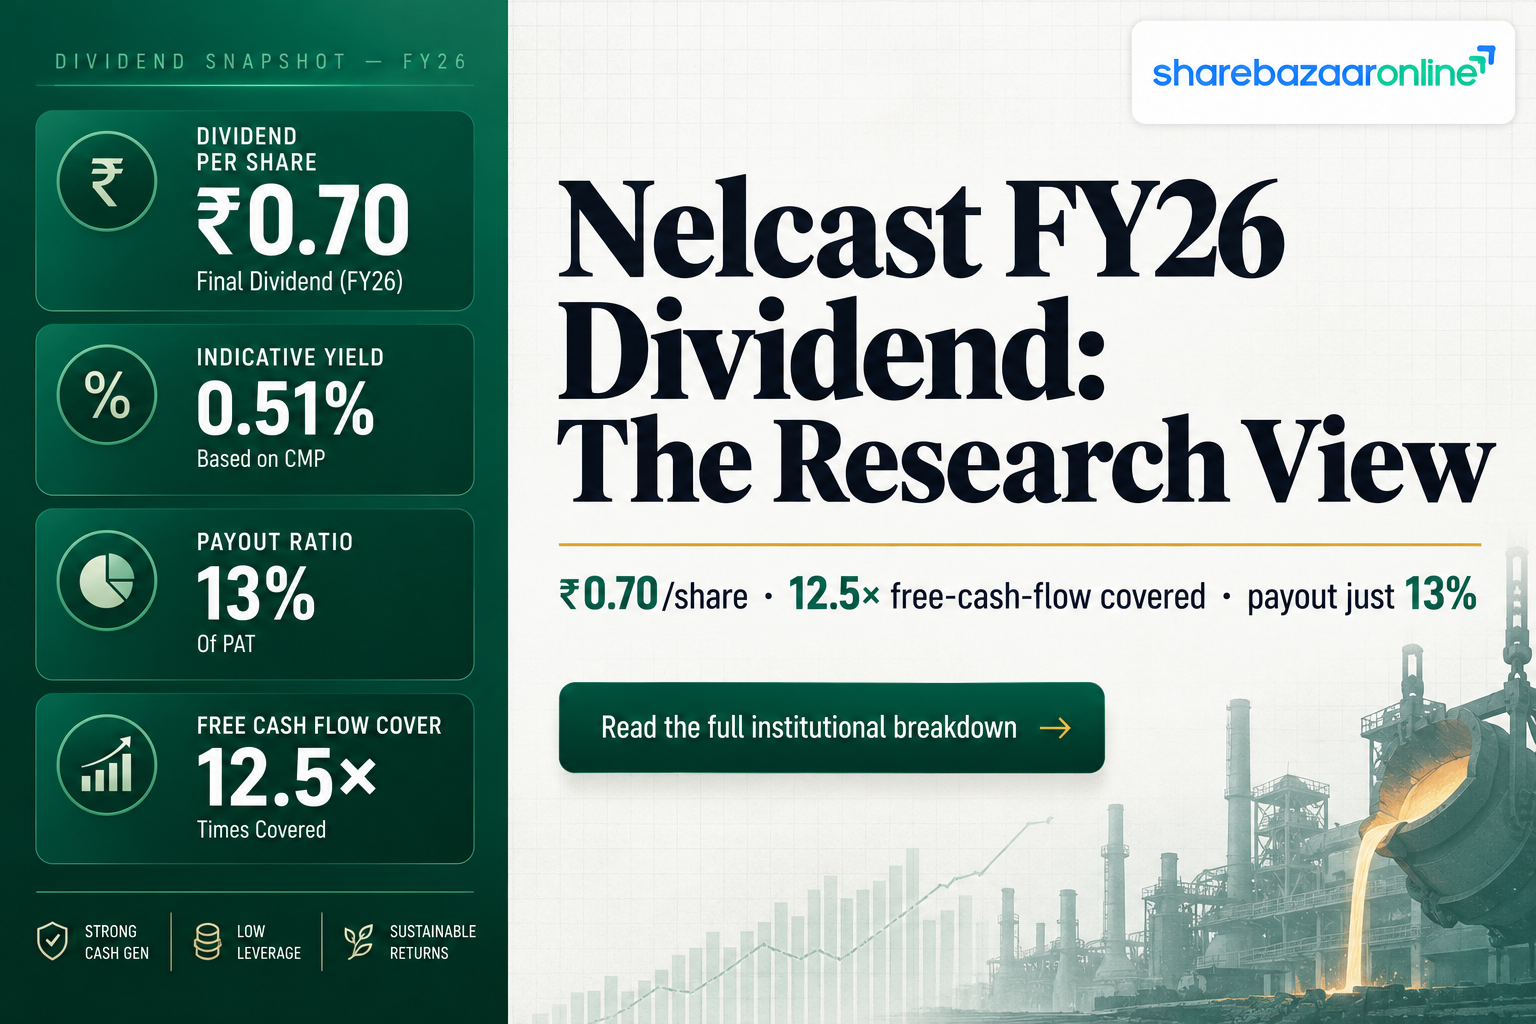
Dividend Per Share
₹0.70
i.e. 35% on face value of ₹2
Dividend Type
Final Dividend
For FY2025-26 · subject to AGM approval
Dividend Yield
~0.51%
At CMP of ~₹137 (early-mid July 2026)
Total Dividend Outflow
~₹6.1 Cr
On ~8.71 crore shares
Record Date
20 Jul 2026
Book closure: 21–27 July 2026
Payment Date
By ~26 Aug 2026
Within 30 days of AGM (27 Jul 2026)
Dividend Announcement Summary
On 18 May 2026, the Board of Directors of Nelcast Limited recommended a final dividend of ₹0.70 per equity share (35%) of ₹2 paid-up value for the financial year 2025-26. The payout is subject to shareholder approval at the ensuing 44th Annual General Meeting and, if approved, will be paid within 30 days of declaration.
The recommendation came alongside Nelcast's Q4 & FY26 results. For the year, the company reported consolidated revenue of about ₹1,328 crore and net profit of ₹48.4 crore (up ~30% year-on-year), with EPS of ₹5.57. Managing Director & CEO Deepak Reddy Ponnavolu pointed to healthy domestic demand in the medium & heavy commercial vehicle (M&HCV) and tractor segments and a gradual recovery in exports. (Financial figures sourced from public filings and market data providers.)
Board Recommendations & Approvals
- Board recommendation: ₹0.70/share final dividend for FY2025-26.
- AGM approval requirement: Yes — dividend is subject to members' approval at the 44th AGM.
- 44th AGM date: 27 July 2026.
- Record date: 20 July 2026; register of members closed 21–27 July 2026.
Key Dates Timeline
Announcement Date
18-05-2026
Ex-Date (T+1, expected)
~17-07-2026
Not separately disclosed by company
Record Date
20-07-2026
Book Closure
21-07 to 27-07-2026
44th AGM
27-07-2026
Payment Date
By ~26-08-2026
Within 30 days of declaration
Dividend Yield Analysis
Yield at Current Price
~0.51%
₹0.70 ÷ ~₹137 CMP × 100
Yield at Announcement Price
~0.50%
₹0.70 ÷ ~₹140 (18 May 2026 close) × 100
Reality check on the yield
At roughly 0.51%, Nelcast is a low-yield stock, not an income play. The reason is simple and healthy: the company keeps its payout ratio low (~13%) and re-invests the bulk of profits back into the business. This is very different from a "high yield" that appears because a share price has crashed. Here the yield is low because the dividend is modest relative to a share price that has re-rated (the stock is near a P/E of ~24.7). For context, the dividend was raised from ₹0.50 (FY25) to ₹0.70 (FY26) — a 40% hike — but the absolute rupee amount is still small on a ~₹137 share.
Dividend History Analysis
| Financial Year | Dividend / Share | % on FV ₹2 | Payout Ratio |
|---|---|---|---|
| FY26 (current) | ₹0.70 | 35% | ~13% |
| FY25 | ₹0.50 | 25% | ~12% |
| FY24 | ₹0.50* | 25% | ~6% |
| FY23 | ₹0.40* | 20% | ~12% |
| FY22 | ₹0.30* | 15% | ~18% |
| FY21 | ₹0.20* | 10% | ~19% |
| FY20 | NIL | 0% | 0% (Covid) |
| FY19 | ~₹1.00* | 50% | ~23% |
| FY18 | ~₹1.00* | 50% | ~23% |
| FY17 | ~₹0.90* | 45% | ~23% |
| FY16 | ~₹0.80* | 40% | ~22% |
*Figures marked with an asterisk are derived from disclosed payout ratios × reported EPS and may vary slightly from the exact declared per-share value. FY25 and FY26 per-share amounts are confirmed from filings.
Classification: Cyclical Payer
Nelcast has paid dividends in most years, but the payout tracks the auto-cycle. Dividends peaked near ₹1.00 (FY17–FY19), were suspended entirely in FY20 during Covid, resumed small at ₹0.20 (FY21), and have been climbing back since — ₹0.30 → ₹0.40 → ₹0.50 → ₹0.50 → ₹0.70 (FY26).
Key takeaway
The current ₹0.70 is the highest since Covid but is still below the pre-Covid peak of ~₹1.00. The trend is recovering, not record-breaking. The FY20 suspension is an important reminder that this payout is not guaranteed in a downturn.
Financial Performance Analysis
| Consolidated (₹ Cr) | FY24 | FY25 | FY26 |
|---|---|---|---|
| Revenue | 1,267 | 1,252 | 1,328 |
| Operating Profit (EBITDA) | 92 | 89 | 110 |
| Operating Margin (OPM) | 7% | 7% | 8% |
| Interest Cost | 32 | 35 | 33 |
| Net Profit (PAT) | 54 | 37 | 48 |
| EPS (₹) | 6.25 | 4.29 | 5.57 |
Operating Leverage: FY26 was a margin recovery year
Revenue rose ~6% in FY26 (₹1,252 → ₹1,328 Cr), but EBITDA jumped ~24% (₹89 → ₹110 Cr) and PAT rose ~30% (₹37 → ₹48 Cr). Profits grew far faster than sales — a sign of positive operating leverage as margins improved (OPM 7% → 8%; management cited EBITDA/kg gains and cost optimisation).
The caution flag: FY25 was weak first
The FY26 "30% growth" looks strong partly because FY25 was a poor base — PAT had fallen from ₹54 Cr (FY24) to ₹37 Cr (FY25). Even after the FY26 rebound, PAT (₹48 Cr) is still below the FY24 level (₹54 Cr). Interest of ₹33 Cr continues to eat into a big chunk of a ₹65 Cr pre-tax profit — the business is fairly leveraged.
Cash Flow Analysis
Operating Cash Flow (FY26)
₹92 Cr
vs PAT of ₹48 Cr → cash conversion is strong (CFO/OP ~95%)
Free Cash Flow (FY26)
₹76 Cr
Comfortably positive after capex
Is the dividend funded by real cash? Yes.
Cash is fact; profit is an opinion — so we check. In FY26, Nelcast generated ₹92 Cr of operating cash flow and ₹76 Cr of free cash flow. The entire dividend outflow is only about ₹6.1 Cr. That means the dividend is funded out of current-year free cash flow with an FCF coverage of ~12.5× — not from borrowings, not from asset sales, not from cash reserves. This is a genuinely well-covered payout.
One watch-point on working capital: debtor days are high at ~98 and inventory days ~120. Receivables have grown broadly with revenue, so it is not alarming yet, but a foundry serving auto OEMs ties up meaningful working capital — which is exactly why free cash flow, not reported profit, is the number that matters for dividend safety.
Balance Sheet Strength
Net Worth (FY26)
~₹596 Cr
Equity ₹17 Cr + Reserves ₹579 Cr
Total Borrowings (FY26)
~₹257 Cr
Down from ₹294 Cr in FY25 (debt reduced)
Debt-to-Equity
~0.4×
Moderate; comfortable but not debt-free
Liquid Investments
~₹24 Cr
Standalone cash balance: Not separately disclosed in summary data
The balance sheet is reasonably healthy but leveraged. Encouragingly, borrowings fell from ₹294 Cr to ₹257 Cr in FY26 even as the dividend was raised — management is de-leveraging and paying more at the same time. However, this is not a net-cash company: it still carries roughly ₹230–250 Cr of net debt and pays ~₹33 Cr of annual interest. The dividend is tiny next to the debt, so the two are not in direct conflict, but a foundry is capital-intensive and the debt is worth monitoring through the cycle.
Dividend Sustainability Analysis
Dividend Coverage (EPS ÷ DPS)
~8.0×
₹5.57 ÷ ₹0.70
FCF Coverage
~12.5×
₹76 Cr FCF ÷ ₹6.1 Cr outflow
Verdict: Sustainable (at current low payout)
On the numbers, this dividend is highly sustainable: earnings cover it ~8×, free cash flow covers it ~12.5×, the payout ratio is only ~13%, and debt is being reduced. There is a very large cushion. The important nuance for readers is that this comfort comes from the dividend being small, not from the business being rock-solid. Earnings are cyclical (the FY20 suspension and the FY25 dip prove it), so a sharp auto downturn could still see the dividend trimmed — but the current ₹0.70 has plenty of room to be maintained in a normal year.
Peer Comparison
| Company | CMP | Div/Share (FY26) | Yield | Payout | ROE | P/E |
|---|---|---|---|---|---|---|
| Nelcast | ~₹137 | ₹0.70 | ~0.51% | ~13% | 8.4% | 24.7 |
| M M Forgings | ~₹448 | ₹4.00 | ~0.9% | ~20% | ~10% | 20.7 |
| Menon Bearings | ~₹129 | ₹2.00 | ~1.6% | ~41% | ~16% | ~26 |
| Steelcast | ~₹230 | Not captured | ~0.5–1% | — | high | 25.7 |
Peer figures are approximate, sourced from public market-data providers around mid-2026, and use each company's own face value. Not a like-for-like recommendation; shown for context only.
Against auto-ancillary peers, Nelcast has the lowest dividend yield (~0.51%) and the lowest payout ratio (~13%), driven partly by its lower return on equity (~8.4% vs ~10–16% for peers). Peers like Menon Bearings (higher ROE, ~41% payout, ~1.6% yield) reward income investors more. Nelcast is best understood as a cyclical recovery / re-investment story with a token dividend, rather than a peer-beating dividend payer.
Promoter Impact Analysis
Promoter Holding
74.87%
FII 0.36% · DII 0.11% · Public 24.65% (Mar 2026)
Estimated Promoter Dividend Income
~₹4.57 Cr
74.87% × ₹6.1 Cr total outflow
With promoters owning 74.87% (close to the 75% regulatory ceiling), roughly ₹4.57 Cr of the ₹6.1 Cr dividend flows to the promoter group, and about ₹1.5 Cr to public/minority shareholders. Because ownership is highly concentrated, most of the payout benefits the promoter family. For minority investors this is not negative in itself — the dividend is paid pro-rata to everyone — but it does mean promoters have a direct interest in the dividend policy, and the low payout ratio suggests the family currently prefers re-investment and de-leveraging over large cash distributions.
Taxation Analysis
How dividends are taxed in India (FY2025-26)
- Dividend income is fully taxable in the investor's hands at their applicable income-tax slab rate (Dividend Distribution Tax was abolished from FY2020-21).
- Under Section 194, the company deducts TDS at 10% only if total dividend from that company in a year exceeds ₹10,000 (threshold raised from ₹5,000 in Budget 2025). Without a valid PAN, TDS is 20%.
- You can claim TDS as a credit against your final tax; it is not the final liability. Report gross dividend under "Income from Other Sources" (Schedule OS).
- Form 15G/15H can be filed by those below the taxable limit to avoid TDS. Non-residents face 20% + cess under Section 195, subject to DTAA relief.
Worked example (generic, ₹10/share)
Investor owns 1,000 shares, dividend ₹10/share, tax slab 30%:
- Gross dividend = 1,000 × ₹10 = ₹10,000
- TDS @10% (crosses ₹10,000? equals it → no TDS at exactly ₹10,000; assume above) = ₹1,000
- Tax @30% + 4% cess = ₹3,120
- Net in hand after tax = ₹6,880
- Effective post-tax yield if bought at ₹137/share (₹1,37,000): ~5.0% on this illustrative ₹10 dividend
Nelcast-specific example (₹0.70/share)
Investor owns 1,000 shares of Nelcast, dividend ₹0.70/share, slab 30%:
- Gross dividend = 1,000 × ₹0.70 = ₹700
- TDS = Nil (well below ₹10,000)
- Tax @30% + 4% cess = ₹218
- Net in hand = ~₹482
- Post-tax yield on ~₹1,37,000 invested: ~0.35%
Tax figures are illustrative; actual tax depends on your total income and slab. ShareBazaar Online is not a tax advisor — consult a qualified professional.
Key Risks
1. Cyclical demand
Revenue depends heavily on M&HCV, tractor and off-highway cycles. A slowdown directly hits volumes, margins and — as FY20 showed — the dividend itself.
2. Customer concentration
As a jobbing foundry supplying a few large auto OEMs, loss or de-stocking by a key client can materially swing quarterly results.
3. Leverage & interest cost
~₹257 Cr of borrowings and ~₹33 Cr annual interest absorb roughly a third of pre-tax profit. Rising rates or falling profits would squeeze coverage.
4. Thin margins & input costs
OPM is only ~8%. Pig iron, scrap, coke and power price inflation can compress margins quickly if not passed on to OEMs.
5. Working-capital intensity
Debtor days ~98 and inventory days ~120 tie up cash; any stretch in receivables can hurt the free cash flow that funds dividends.
6. Export & tariff exposure
Exports to the US/Europe add currency and tariff risk; management has flagged export softness and tariff developments as swing factors.
What To Monitor
1. EBITDA margin & EBITDA/kg
The FY26 story is margin recovery. Watch whether OPM holds above ~8–9% and EBITDA/kg keeps improving quarter on quarter.
2. Debt trajectory
Borrowings fell ₹294→₹257 Cr. Continued de-leveraging (and D/E moving below 0.3×) would strengthen the dividend base.
3. Volume/tonnage & capacity utilisation
Track castings tonnage and utilisation — the clearest read on the underlying auto cycle for a foundry.
4. Working-capital / debtor days
Watch whether debtor days (~98) and the cash-conversion cycle stay controlled, keeping free cash flow healthy.
5. Export recovery & new products
Management is banking on export recovery and a new-product pipeline; monitor export revenue share and order wins.
6. Payout ratio trend
A rising payout (from ~13%) toward peer levels would signal management's growing confidence in earnings durability.
Conclusion
Positives
The ₹0.70 dividend is a 40% hike over FY25 and the highest since Covid; it is backed by strong cash generation (₹92 Cr OCF, ₹76 Cr FCF), an ~8× earnings and ~12.5× FCF coverage, a margin-recovery year (PAT +30%), and falling debt. Payout is conservative at ~13%, leaving a big safety cushion.
Negatives & caveats
The yield is only ~0.51% — this is not an income stock. Earnings are cyclical (dividend was suspended in FY20; PAT dipped in FY25 and is still below FY24). ROE (~8.4%) trails peers, the business is working-capital heavy and still carries ~₹230–250 Cr net debt, and ~75% of the payout goes to promoters. The dividend is well-covered because it is small.
This report presents facts, positives, negatives, risks and monitoring points only. It does not contain any buy, sell or hold recommendation — the decision is yours.
Frequently Asked Questions
What dividend has Nelcast announced for FY2025-26?
What is the dividend yield of Nelcast?
What is the record date for the Nelcast dividend?
What is the ex-date?
When will the dividend be paid?
Who is eligible to receive the dividend?
How is this dividend taxed?
Is the Nelcast dividend sustainable?
What is Nelcast's dividend history?
What is the total dividend outflow and how much goes to promoters?
How does Nelcast compare with peers on dividends?
What should investors monitor going forward?
Is the dividend confirmed or does it need approval?
Disclaimer
This analysis is prepared by ShareBazaar Online for informational and educational purposes only and is not investment, tax or legal advice. It contains no buy, sell or hold recommendation. Company-disclosed facts (dividend, dates, AGM) are drawn from Nelcast Limited's stock-exchange filing dated 18 May 2026; financial, price, shareholding, peer and tax figures are sourced from public market-data providers and statutory sources and may contain errors, revisions or timing differences — several older per-share dividend figures are derived from payout ratios and are approximate. Market prices are indicative and change continuously. Equity investments carry risk of loss. Please verify all figures independently and consult a SEBI-registered adviser and a qualified tax professional before making any decision.