
STATUS: BUYBACK COMPLETED & EXTINGUISHED
This is a concluded corporate action, not a live opportunity. The Fairchem Organics tender-offer buyback closed on 14 January 2026, settlement is complete, and 4,25,000 equity shares have been extinguished. The company filed its Post Buyback Public Announcement on 22 January 2026. Everything below is a historical analysis for record and learning. There is no way to tender shares today.
Fairchem Organics Buyback — At a Glance
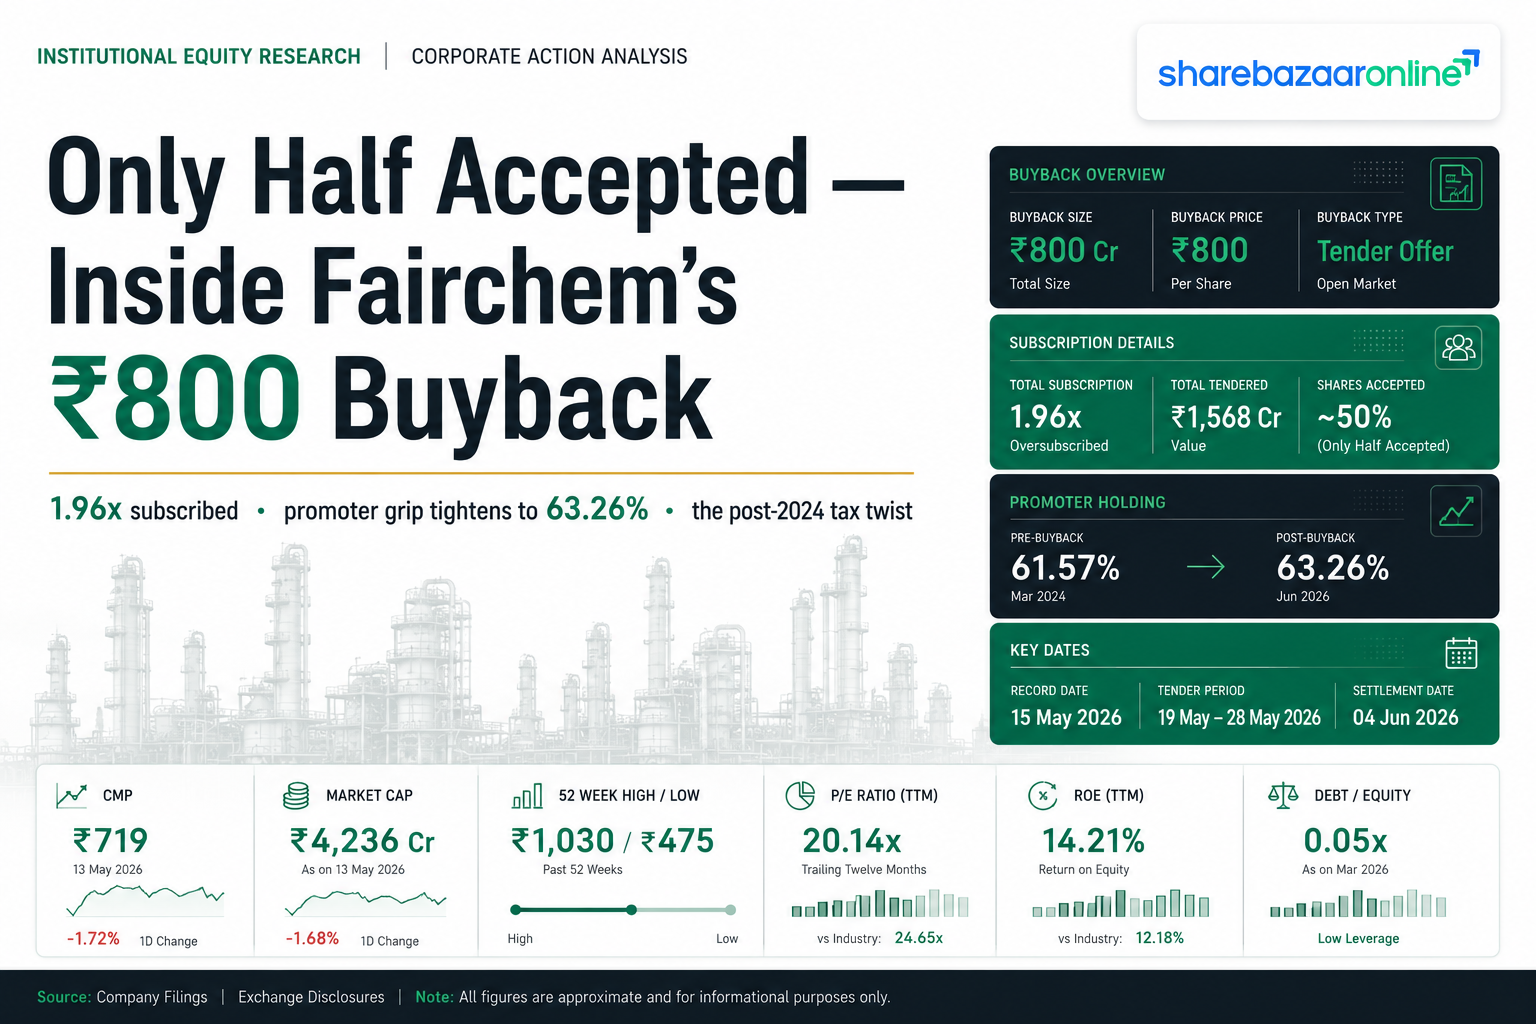
Fairchem Organics Limited (NSE: FAIRCHEMOR | BSE: 543252), a Fairfax-backed speciality oleo-chemicals maker, bought back 4,25,000 shares at a fixed ₹800 per share through the tender-offer route. Here is the whole deal in one screen.
Buyback Price
₹800
per share, fixed
Premium
20.85%
over ₹662 at announcement
Offer Size
₹34 Cr
4,25,000 shares
% of Equity
3.26%
of pre-buyback capital
Overall Subscription
1.96x
≈51% acceptance
Record Date
5 Jan
2026
Tender Window
8–14 Jan
2026 (closed)
Promoter Response
Opted Out
stake rose to 63.26%
Announcement CMP ₹662 as per Business Standard quote around the 20–24 November 2025 board-meeting window. Latest market price near ₹750 (NSE, early July 2026).
What Actually Happened — In Plain English
A buyback is when a company uses its own cash to purchase its shares from existing shareholders and then cancels them. Fewer shares remain, so each surviving share represents a slightly larger slice of the company. Fairchem chose the tender offer route: instead of buying quietly from the open market, it invited shareholders to formally offer (“tender”) their shares at a set price of ₹800, well above the roughly ₹662 the stock was trading at when the board approved the plan on 20 November 2025.
Only shareholders on the company’s books as of the record date (5 January 2026 — the cut-off that decides who is eligible) could participate. Because Fairchem set aside only ₹34 crore for the whole exercise but many more shares were offered to it, the buyback worked on a proportionate basis: the company accepted a fixed fraction of what each holder tendered and returned the rest. The proportion accepted is the acceptance ratio, and it is the single most important number for anyone who took part — far more important than the headline premium.
The tendering window ran from 8 to 14 January 2026. Once closed, accepted shares were paid for at ₹800 and permanently extinguished (cancelled), shrinking the company’s share count from 1,30,20,902 to 1,25,95,902. The whole thing is now finished.
Buyback Timeline
| Event | Date | What It Meant |
|---|---|---|
| Board approval | 20 Nov 2025 | Board cleared ₹34 Cr buyback at ₹800; promoters declared they would not participate. |
| Shareholder approval | Dec 2025 | Special resolution passed by postal ballot (intimated 26 Dec 2025). |
| Public Announcement | 30 Dec 2025 | Formal announcement of the approved buyback published. |
| Record date & ex-date | 5 Jan 2026 | Eligibility cut-off. Last day to buy with entitlement was 2 Jan 2026 (3–4 Jan were holidays). |
| Tender window opens | 8 Jan 2026 | Eligible holders could tender shares via their broker. |
| Tender window closes | 14 Jan 2026 | Offer closed, oversubscribed 1.96 times. |
| Post Buyback Announcement | 22 Jan 2026 | Final results filed; shares extinguished. Published in newspapers 23 Jan 2026. |
The Numbers That Matter — A Business in Sharp Decline
This is where Fairchem’s buyback becomes genuinely interesting — and where most coverage stops short. The buyback was sized against the March 2025 (FY25) balance sheet, but it was executed while the FY26 business was falling apart. Look at the trajectory:
| Metric (₹ Crore) | FY24 | FY25 | FY26 | FY25→FY26 |
|---|---|---|---|---|
| Revenue from operations | ~618 | 537.90 | 459.65 | −14.6% |
| Operating profit (EBITDA) | n/a | ~42.8 | ~21.6 | −49.5% |
| Operating margin (OPM) | n/a | 7.95% | 4.70% | −325 bps |
| Profit before tax (PBT) | n/a | 29.91 | 8.20 | −72.6% |
| Net profit (PAT) | ~40.7 | 21.97 | 5.54 | −74.8% |
| Dividend per share | ₹7.50* | ₹7.50 | ₹1.00 | −86.7% |
Source: Capital Market / audited results compilation. FY24 figures are approximate, derived from disclosed year-on-year change (FY25 revenue −13% and PAT −46% versus FY24). EBITDA derived from disclosed OPM. *FY24 dividend approximate.
The operating-leverage story
A 14.6% fall in revenue turned into a 49.5% fall in EBITDA and a 74.8% collapse in net profit. That gap is the definition of negative operating leverage: Fairchem runs a capital-intensive chemical plant with large fixed costs, so when selling prices per tonne dropped across dimer acid, linoleic acid and related products — while raw-material costs stayed comparatively firm — the margin had nowhere to hide. Operating margin was squeezed 325 basis points, from 7.95% to 4.70%. No buyback repairs a margin like that.
The timing is the headline. In the very quarter the buyback was being organised — Q3 FY26 (Oct–Dec 2025) — Fairchem slipped to a net loss of ₹0.10 crore on sales down 11.8%. The quarter before that (Q2 FY26) net profit had already crashed 80.8%. In short, the company was returning ₹34 crore to shareholders in the same three months it stopped making money.
Where Did the ₹34 Crore Come From?
Reported profit is an opinion; cash is a fact — so the honest question is whether this buyback was paid for out of the year’s earnings or out of the balance sheet. The arithmetic answers it plainly.
Cash returned via buyback
₹34.0 Cr
FY26 net profit
₹5.54 Cr
Buyback vs FY26 profit
6.1x
The buyback consumed roughly six years of FY26 earnings in a single stroke. Even measured against the stronger FY25 (the year it was sized on), ₹34 crore was about 1.5 times that year’s entire net profit. Add the FY25 dividend of ₹7.50 per share (roughly ₹9.8 crore) paid out in the same window, and it is clear this capital return was funded from accumulated reserves built during the FY22–FY24 upcycle, not from current operations. That is a legitimate use of a healthy balance sheet — but readers should not mistake it for the company having earned this money recently.
Data note: Line-item operating cash flow and trade-receivables figures are not disclosed inside the buyback documents themselves and the granular audited cash-flow statement is behind paywalls at the time of writing — recorded here as “Not Disclosed by Company” in the public buyback filings. The funding conclusion above rests on published profit, dividend and buyback figures, which are sufficient to establish that the payout exceeded current-year earnings several times over.
The Acceptance Ratio — Your Real Return
The offer was oversubscribed 1.96 times overall — roughly twice as many shares were offered as the company was willing to buy. That means the ₹800 price only applied to about half of what most people tendered. Here is how the two investor buckets fared. (SEBI reserves at least 15% of every buyback for small shareholders — those holding shares worth up to ₹2 lakh on the record date — which is why they got a better deal.)
| Category | Shares Reserved | Valid Shares Tendered | Times Subscribed | Approx. Acceptance |
|---|---|---|---|---|
| Small Shareholders | 90,228 | 1,29,567 | 1.44x | ~70% |
| General Category | 3,34,772 | 7,03,817 | 2.10x | ~48% |
| Total | 4,25,000 | 8,33,384 | 1.96x | ~51% |
Never confuse the headline premium with your return. The right measure is the blended pre-tax return = Premium % × Acceptance Ratio %, because only the accepted portion earns the premium; the rest comes back to you at the market price. Using the announcement premium of 20.85%:
| Scenario | Acceptance | Blended Pre-Tax Return* |
|---|---|---|
| Best case (small shareholder) | ~70% | ~14.6% |
| Base case (overall) | ~51% | ~10.6% |
| Worst case (general category) | ~48% | ~9.9% |
| ACTUAL OUTCOME | materialised | Small holders landed near the best case (~14.6%); larger holders near the worst (~9.9%) — all before tax. |
*Simplified model assuming unaccepted shares are sold back at the ₹662 reference price. In reality the stock recovered after the buyback (to ~₹750 by July 2026), so holders of unaccepted shares actually gained on that leftover portion — a rare tailwind. The tax treatment below still applies to the accepted portion.
The Tax Reality (Post-October 2024) — Read This Before You Cheer
Since 1 October 2024, the tax rules on buybacks changed completely, and they quietly demolish most of the arbitrage for higher-income investors. Three things now happen:
- The entire ₹800 buyback proceeds are treated as a deemed dividend and taxed at your personal slab rate — not as capital gains.
- You get no deduction for what you paid to buy the shares against that dividend.
- Instead, your purchase cost becomes a capital loss, which you may carry forward for up to 8 assessment years to set off against future capital gains — useful only if you actually have such gains.
Worked example — a 30% slab investor, per accepted share
| Buyback proceeds (deemed dividend) | ₹800.00 |
| Less: tax at 30% slab + 4% cess (≈31.2%) | − ₹249.60 |
| Net cash from the dividend | ₹550.40 |
| Less: original cost paid to acquire the share (~₹662) | − ₹662.00 |
| Immediate cash position | − ₹111.60 |
| Add back: value of ₹662 capital loss, if usable (₹82.75 at 12.5% LTCG → ₹132.40 at 20% STCG) | + ₹82.75 to ₹132.40 |
| Net economic outcome per accepted share | −₹28.85 to +₹20.80 |
Read that plainly: an investor who bought near the tender-eligibility price and sits in the top bracket saw the flashy 20.85% premium shrink to roughly break-even — anywhere from a small loss to a token gain — on the accepted shares, and only if the carried-forward capital loss can be promptly used. For top-bracket investors, the buyback arbitrage largely disappears. The maths is far kinder to investors in lower slabs (or with a very low cost basis), for whom the slab-rate dividend bites less.
Promoters Sat It Out — And Quietly Tightened Their Grip
Fairchem’s promoter group (led by institutional promoter Fairfax India Holdings) chose not to tender a single share. That decision has two separate effects, and both are true at once:
Effect 1 — Bigger slice for everyone else
By abstaining, the promoters freed up their share of the buyback for public shareholders, raising the entitlement and acceptance available to non-promoters. Small shareholders in particular benefited from a healthier ~70% acceptance.
Effect 2 — Free control creep
Because the total share count shrank while the promoters’ own count stayed at 79,67,823, their stake rose from 61.19% to 63.26% — a +2.07 percentage-point increase in control without spending a single rupee. The buyback did the concentrating for them.
Worth noting alongside this: domestic institutional holding fell from about 5.42% to 3.99% across the buyback quarter, and the total shareholder count dropped from roughly 32,300 to 26,600 — a chunk of smaller holders used the offer to exit.
Who Actually Tendered — One Arbitrageur Took Half
A striking detail from the final filing: a single entity captured more than half of the entire buyback. The top five tendering shareholders were:
| Shareholder | Shares Bought Back | % of Buyback |
|---|---|---|
| Rajasthan Global Securities Pvt Ltd | 2,40,325 | 56.55% |
| LRSD Securities Pvt Ltd | 14,426 | 3.39% |
| Shah Aadarsh Utkarsh | 6,470 | 1.52% |
| Narendra Vangota | 6,255 | 1.47% |
| Marwadi Shares and Finance Ltd | 6,139 | 1.44% |
Rajasthan Global Securities alone accounted for 56.55% of all shares bought back — a professional arbitrage desk that built a large position specifically to tender. That single fact tells you the buyback was captured far more by informed institutional arbitrageurs than by the retail base it nominally reserves 15% for. (Notably, the same firm was still trading the stock in July 2026.)
Capital Structure & Shareholding — Before vs After
Paid-up capital
| Shares | |
|---|---|
| Authorised capital | 2,00,00,000 |
| Paid-up before buyback | 1,30,20,902 |
| Shares extinguished | − 4,25,000 |
| Paid-up after buyback | 1,25,95,902 |
Shareholding pattern
| Group | Pre | Post |
|---|---|---|
| Promoter & Promoter Group | 61.19% | 63.26% |
| Public (total) | 38.81% | 36.74% |
| — Foreign investors | 11.25% | — |
| — Indian FIs / Banks / MFs | 5.23% | — |
| — Public & bodies corporate | 22.33% | — |
The Return-on-Equity / Capital-Allocation Question
A buyback is one of two things a company can do with spare capital — return it, or reinvest it. Fairchem chose to return it at a moment when its returns on capital had thinned dramatically. On FY26’s ₹5.54 crore of profit against a net worth of a few hundred crore, return on equity fell to the low single digits, and the stock’s trailing P/E ballooned above 160–170x simply because the “E” had shrivelled.
In that light the ₹34 crore buyback reads as a modest, defensive return of surplus capital from a business that could not, in the current down-cycle, redeploy it at attractive rates — rather than a confident signal of undervaluation. Management has publicly targeted ₹2,000 crore revenue by FY30 with margin recovery; whether reserves are better spent buying back stock or funding that growth is the real capital-allocation debate here. Precise net-worth and cash-balance figures from the audited balance sheet are recorded as “Not Disclosed by Company” within the buyback filings.
Financial engineering vs business performance: shrinking the share count from 1.30 crore to 1.26 crore mechanically lifts earnings-per-share by spreading the same profit over ~3.3% fewer shares. That is arithmetic, not achievement. Fairchem did not earn more because of the buyback — its EPS optically improves while the underlying profit actually fell three-quarters. Keep the two ideas separate.
Deal People & Advisors
Manager to the Buyback
Motilal Oswal Investment Advisors Ltd
Registrar
MUFG Intime India Pvt Ltd
Chairman & Managing Director
Nahoosh Jariwala
Compliance Officer / CS
Jatin Jain (ACS-24293)
Institutional Promoter
Fairfax India Holdings
Registered Office
Chekhala, Sanand, Ahmedabad, Gujarat
Positives, Negatives, Risks & What to Watch
Positives
- Real cash returned at a genuine ~20.85% premium to the announcement-date price.
- Small shareholders enjoyed a favourable ~70% acceptance thanks to the 15% reservation and promoter abstention.
- Funded from a strong reserve base, not from borrowings.
- Stock recovered post-buyback, cushioning holders of unaccepted shares.
Negatives
- Executed as earnings collapsed — revenue −14.6%, PAT −74.8%, a Q3 net loss.
- Post-Oct-2024 slab-rate dividend tax erases most of the arbitrage for top-bracket investors.
- Dividend slashed 87% (₹7.50 → ₹1) in the same year — capital return masking weakness.
- One arbitrage desk captured 56.55% of the offer.
- EPS uplift is cosmetic; underlying profit fell sharply.
Key Risks
- Commodity-linked realisations remain volatile; margins may stay compressed.
- Extremely elevated P/E (160–170x) leaves little room for disappointment.
- Rising promoter concentration reduces public float over time.
What to Monitor
- Whether Q4 FY26’s margin recovery (OPM back to 6.87%) is sustained.
- Realisation-per-tonne trends in dimer and linoleic acid.
- Progress toward the stated ₹2,000 crore FY30 revenue goal.
- Future capital-allocation choices: growth capex vs further payouts.
ShareBazaar Online does not issue Buy, Sell or Hold calls. The points above are for understanding only; investment decisions are entirely your own.
Frequently Asked Questions
Can I still take part in the Fairchem Organics buyback?
No. The tender window closed on 14 January 2026 and the accepted shares have already been cancelled. The buyback is fully concluded.
What was the buyback price and premium?
₹800 per share, a premium of about 20.85% over the ~₹662 market price around the 20 November 2025 board approval.
What was the acceptance ratio?
The offer was subscribed 1.96 times overall — roughly 51% acceptance. Small shareholders saw about 70% accepted; the general category about 48%.
How is the money taxed?
Under rules effective 1 October 2024, the entire buyback amount is a deemed dividend taxed at your slab rate, with no cost deduction. Your purchase cost becomes a capital loss carried forward up to 8 years. For 30% slab investors the net benefit is close to nil.
Did promoters participate?
No. Their stake rose from 61.19% to 63.26% purely because the overall share count shrank — a gain in control at zero cost.
Was the buyback a sign the business is doing well?
Not really. It coincided with a steep earnings decline — FY26 revenue down 14.6% and net profit down 74.8%, including a Q3 net loss. It was a return of surplus reserves, not a reflection of current profitability.
Disclaimer
This report is published by ShareBazaar Online for informational and educational purposes only. It does not constitute investment, legal or tax advice, and it contains no Buy, Sell or Hold recommendation of any kind. Figures marked from company filings are drawn from Fairchem Organics’ Post Buyback Public Announcement dated 22 January 2026; other data points (market prices, financial results, ratios) are sourced from publicly available exchange and market-data providers and are cited with their dates in the body of the report. Some balance-sheet line items were not disclosed within the buyback documents and are marked accordingly. Market prices and figures are subject to revision. All investments in securities carry risk, including loss of principal. Readers must conduct their own due diligence and consult a SEBI-registered adviser and a qualified tax professional before acting. ShareBazaar Online accepts no liability for decisions taken on the basis of this content.