
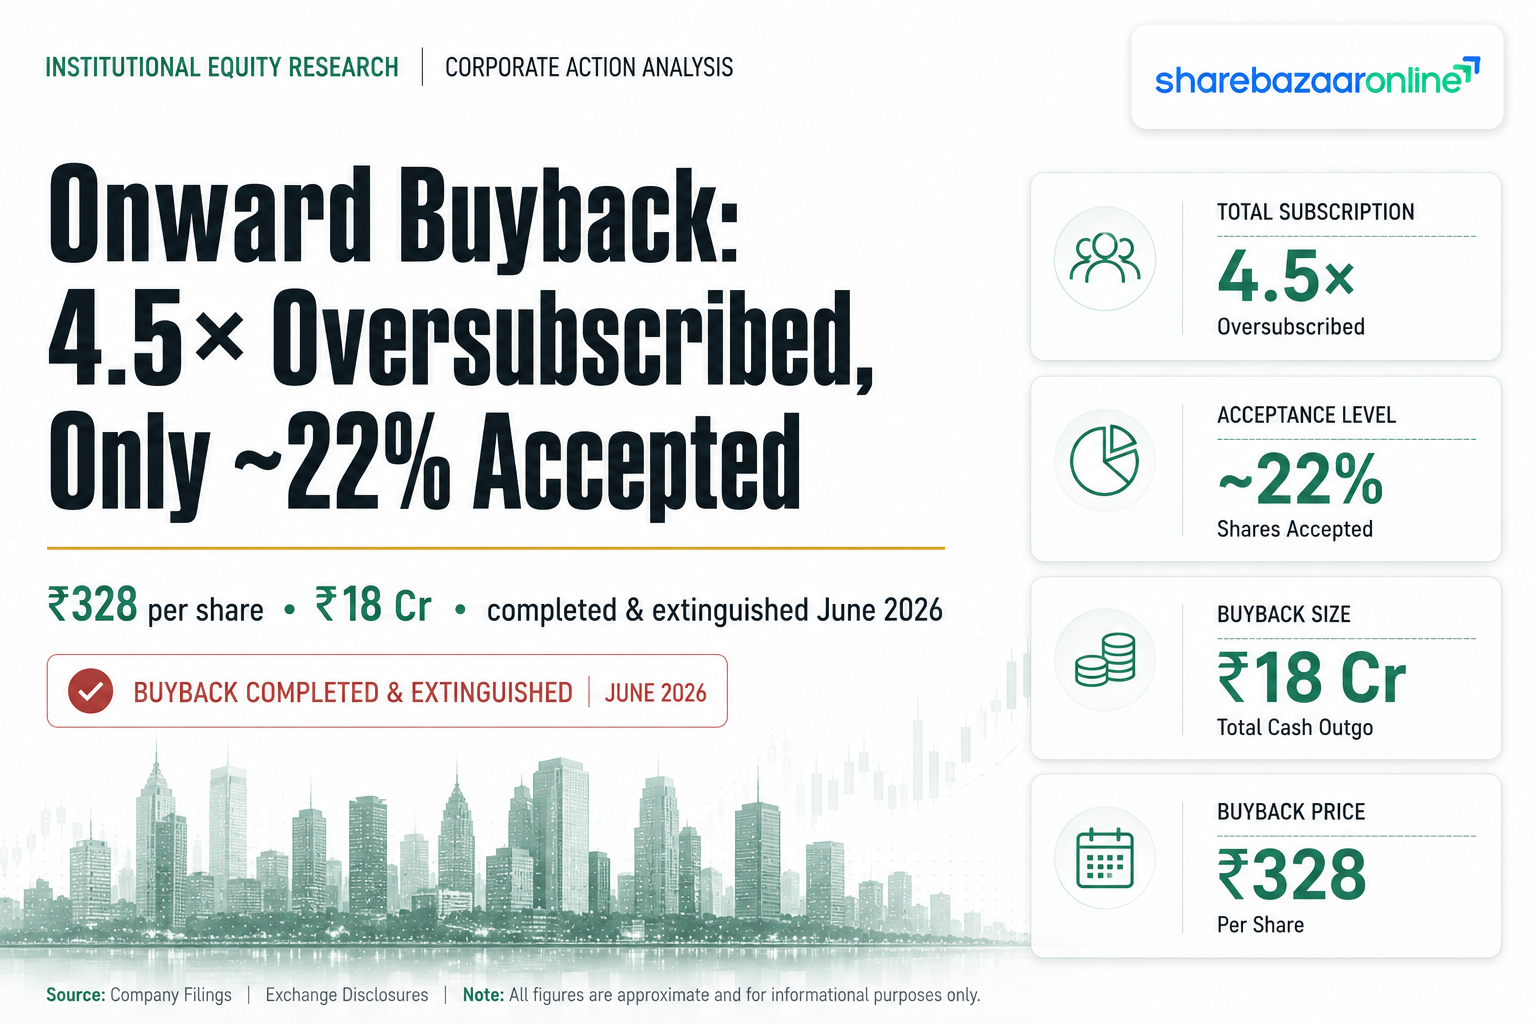
⚠ STATUS: BUYBACK COMPLETED & SHARES EXTINGUISHED — THIS OFFER IS CLOSED
This is a post-completion analysis, not a live opportunity. The Onward Technologies buyback tendering window ran from 22 May 2026 to 29 May 2026. The company accepted and paid for the shares (settlement 5 June 2026), and 5,48,780 shares were formally extinguished on 11 June 2026, confirmed by depositories NSDL and CDSL. You can no longer participate. The purpose of this report is to record what happened, how the numbers actually played out, and what the outcome teaches investors about tender-offer buybacks in the current tax regime.
Buyback Snapshot — Onward Technologies Limited
Buyback Price
₹328
per share, in cash
Offer Size
₹18 Cr
5,48,780 shares
% of Capital
2.41%
of paid-up equity
Premium
21.9%
over ₹269 (13 May)
Subscription
4.50x
oversubscribed
Acceptance Ratio
≈22.2%
overall (all tenders)
Route
Tender
proportionate
Record Date
18 May
2026
Scrip: BSE 517536 | NSE: ONWARDTEC. Board approval 12 May 2026; Public Announcement 13 May 2026 (published 14 May 2026). Manager to the Buyback: Centrum Broking Limited. Registrar: MUFG Intime India Private Limited. Prices sourced from NSE/BSE as dated; all other terms from the company's Public Announcement and Letter of Offer.
What Actually Happened — In Plain Language
Onward Technologies is a Mumbai-headquartered engineering R&D (ER&D) and digital services company that builds embedded, mechanical and data-engineering solutions for global manufacturers. In May 2026 its board decided to return a small pool of surplus cash to shareholders through a buyback — the company buying its own shares back and cancelling them.
It used the tender offer route: a fixed-price window where eligible shareholders offer ("tender") their shares at ₹328 each, rather than selling on the open market. Because the buyback pool was tiny (₹18 crore) and demand was heavy, shareholders tendered 4.5 times more shares than the company was buying. Only a fraction of each person's tender could be accepted.
Key terms defined once:
- Tender offer — a fixed-price buyback window; you offer shares and the company accepts a portion.
- Record date (18 May 2026) — the cut-off date; only holders on this date could participate.
- Entitlement ratio — how many shares you were allowed to tender per shares held.
- Acceptance ratio — the share of what you tendered that was actually bought.
- Extinguishment — the bought-back shares are permanently cancelled, shrinking share count.
- Ex-date — from this date the stock trades without buyback eligibility (aligned to record date under T+1).
Complete Timeline
| Event | Date | Status |
|---|---|---|
| Board approval | 12 May 2026 | Done |
| Public Announcement | 13–14 May 2026 | Done |
| Record date | 18 May 2026 | Done |
| Letter of Offer filed with SEBI | 20 May 2026 | Done |
| Tendering window opens | 22 May 2026 | Done |
| Tendering window closes | 29 May 2026 | Done |
| Acceptance finalised | 4 June 2026 | Done |
| Settlement / payment | 5 June 2026 | Done |
| Shares extinguished | 11 June 2026 | Completed |
The Headline Everyone Missed: Only ~22% Got Accepted
The premium looks attractive on paper, but a premium you can only collect on a fifth of your shares is not the same as a premium on all of them. The Registrar received 3,457 valid applications for 24,69,566 shares against only 5,48,780 shares on offer — an oversubscription of 4.50 times. That produced an overall acceptance ratio of roughly 22.2% (5,48,780 ÷ 24,69,566).
There is a further honest wrinkle. The disclosed acceptances were concentrated among large holders — Infinity Direct Holdings (14.28% of shares bought back) and Infinity Portfolio Holdings (13.85%) alone soaked up over a quarter of the entire buyback. SEBI's 15% small-shareholder reservation cushions retail somewhat, but the pool was so small that a single-lot tenderer still saw most of their shares returned unbought.
| Metric | Figure |
|---|---|
| Shares offered by company | 5,48,780 |
| Shares tendered by shareholders | 24,69,566 |
| Valid applications | 3,457 |
| Oversubscription | 4.50 times |
| Overall acceptance ratio | ≈ 22.2% |
| Entitlement — Small (Reserved) category | 39 shares per 985 held |
| Entitlement — General category | 34 shares per 859 held |
The Premium — And Which Price It Was Measured Against
A buyback "premium" only means something once you know the reference price. Here is the same ₹328 offer measured three ways:
| Reference price | Level | Premium at ₹328 |
|---|---|---|
| Board-meeting close (12 May 2026, BSE) | ₹265.85 | +23.4% |
| Announcement-day price (13 May 2026) | ₹269 | +21.9% |
| Latest available (≈23 June 2026, NSE) | ₹258 | +27.1% |
Formula: Premium % = ((₹328 − CMP) ÷ CMP) × 100. Prices per NSE/BSE on the dates shown. Note the stock has drifted down since the offer (from ~₹269 to ~₹258), which matters for anyone who bought purely to tender — their unaccepted shares are now worth less than they paid.
The Return That Actually Mattered — Blended, Not Headline
The right way to judge a tender offer is premium × acceptance ratio — because you only collect the premium on the accepted slice. Using the ₹269 announcement-day entry:
| Scenario | Acceptance | Blended pre-tax return* |
|---|---|---|
| Best case | 35% | ≈ 7.7% |
| Base case | 22% | ≈ 4.8% |
| Worst case | 15% | ≈ 3.3% |
| ACTUAL OUTCOME | ≈ 22.2% | ≈ 4.9% |
The base case materialised — the arbitrage delivered roughly 4.9% pre-tax on the accepted portion. But there is a colder full-position number. An investor who bought at ₹269 to tender had ~22% accepted at ₹328 (a +21.9% gain on that slice) and was left holding ~78% of the position, now worth ~₹258 (a −4.1% loss on that slice). Netted together:
(22.2% × +21.9%) + (77.8% × −4.1%) ≈ +1.7% pre-tax, before brokerage and taxes. The "27% premium" headline shrank to under two percent of real, whole-position return — and that is before the tax treatment below turns it negative for many.
*Blended pre-tax return = Premium % × Acceptance Ratio %, a simplified convention that assumes unaccepted shares are exited at cost. The netted figure below it reflects the actual post-offer market price.
The Tax Reality (Post-October 2024) — Read This Twice
Since 1 October 2024, buyback proceeds are treated as a deemed dividend in the shareholder's hands and taxed at their slab rate — with no deduction for what the shares cost. Separately, the entire purchase cost of the accepted shares becomes a capital loss, which you may carry forward for up to eight assessment years to set off against future capital gains.
Worked example — investor in the 30% slab, 100 shares accepted at ₹328 (bought at ₹269):
| Buyback proceeds (deemed dividend) | ₹32,800 |
| Tax on full proceeds @ 31.2% (30% + cess) | − ₹10,234 |
| Net cash received | ₹22,566 |
| Original cost of those shares | ₹26,900 |
| Cash outcome vs cost (before loss set-off) | − ₹4,334 |
The ₹26,900 cost is not simply lost — it converts into a capital loss worth, at a 12.5% LTCG rate, about ₹3,362 in future tax if (and only if) the investor has future capital gains to absorb it. Even after crediting that, the accepted slice roughly breaks even to slightly negative.
Bottom line: for top-bracket investors, the buyback arbitrage on Onward Technologies largely disappeared once tax was applied. The 15%–27% premium headlines were, in cash terms, close to neutral for a 30% slab participant. It was materially more useful to investors in low or nil tax brackets.
This is general information on the tax framework, not personal tax advice. Surcharge can push effective rates above 31.2% for high incomes. Consult a qualified tax adviser for your situation.
Business Performance — The Part No Buyback Can Fake
Unlike most buyback stories we cover, the underlying business here is the good news, not the buyback. On a consolidated basis (the right lens for a company with overseas subsidiaries), FY26 showed genuine operating leverage — profit grew far faster than revenue, driven by margin expansion rather than accounting.
| Consolidated (₹ Cr) | FY25 | FY26 | Change |
|---|---|---|---|
| Revenue | 491 | 544 | +10.8% |
| Operating profit (EBITDA) | 45 | 72 | +60% |
| Operating margin | 9.2% | 13.2% | +~400 bps |
| Profit before tax | 36 | 57 | +58% |
| Net profit (PAT) | 27 | 44.3 | +64% |
| EPS (₹) | 11.94 | 19.48 | +63% |
Revenue rose ~11% while EBITDA jumped ~60% — the definition of positive operating leverage. Standalone PAT was ₹32.16 Cr; the consolidated ₹44.3 Cr figure is the one that reflects the whole group and is used throughout this report. Return on equity was a healthy ~19.5% and ROCE ~23%.
Cash Flow Check — Where the ₹18 Crore Came From
Reported profit is an opinion; cash is a fact — so we always test the cash statement. Here it strengthens the story rather than undermining it.
- Operating cash flow ₹65 Cr vs PAT ₹44.3 Cr — cash conversion of ~147%. Profits are backed by real cash, not receivables.
- Free cash flow ~₹46 Cr — comfortably more than double the ₹18 Cr buyback.
- Debtor days fell from 81 to 58 — receivables shrank even as revenue grew, the opposite of the warning sign we look for.
- Buyback funded from the year's earnings, not from the balance sheet or old reserves — ₹18 Cr out of ₹46 Cr FY26 FCF.
This is the rare case where the cash flow section is a clean bill of health: positive OCF well above net profit, improving collections, and a buyback the company could pay for out of a single year's free cash. A note for balance: reported "borrowings" of ~₹40 Cr are largely lease liabilities under Ind AS 116; management describes the company as debt-free, and it carries no meaningful term debt.
Financial Engineering vs Real Earnings — And the Book-Value Catch
A buyback lifts earnings per share by shrinking the number of shares, not by earning more. Onward cancelled 2.41% of its shares, so EPS mechanically rises even if profit were flat. Readers should not confuse a smaller denominator with a bigger business.
There is also a cost the headlines skip. The company paid ₹328 per share to buy back stock whose book value is only ~₹111. Paying roughly three times book value for your own shares reduces book value per share for those who stay. Our estimates:
| Per-share metric (consolidated) | Pre-buyback | Post-buyback (est.) | Effect |
|---|---|---|---|
| Shares outstanding | ≈ 2,27,54,824 | 2,22,11,890 | −2.4% |
| EPS (₹) | 19.48 | ≈ 19.95 | +2.4% |
| Book value / share (₹) | ≈ 111 | ≈ 106 | −4.9% |
| Return on net worth | ≈ 17.5% | ≈ 18.9% | higher |
| P/E (at ₹258) | ≈ 13.2x | ≈ 12.9x | lower |
These pre/post ratios are ShareBazaar Online estimates derived from consolidated FY26 accounts and the confirmed post-buyback share count; the company's own figures appear in its Letter of Offer. Where the company has not separately disclosed a metric, we have not invented one.
The Promoter Angle — Control Rose Without Spending a Rupee
The promoters and promoter group chose not to participate in the buyback. This has two simultaneous effects, and both are worth stating plainly:
Effect 1 — bigger slice for the public
By abstaining, promoters made the entire ₹18 Cr pool available to public shareholders, raising everyone else's entitlement.
Effect 2 — control crept up for free
Because the share count shrank while promoters held steady, promoter holding rose from 39.07% to 40.02% — a ~95 bps gain in control without buying a single share.
Capital Allocation — Is There Idle Cash?
A common critique of buybacks is that they mask lazy balance sheets — a company earning single-digit returns because most of its equity sits in fixed deposits. That criticism does not fit here. Onward earns ~19.5% on equity and ~23% on capital employed, does not sit on a large idle treasury, and complements this buyback with a ~41% dividend payout. If anything, the ₹18 Cr buyback looks modest relative to ₹46 Cr of free cash flow — a cautious, partial return of surplus rather than a fix for trapped capital. The question for future years is whether the company keeps returning surplus at this pace or lets cash build.
Risks & What to Monitor Now
- Client concentration & ER&D cyclicality — engineering R&D spend by global OEMs is discretionary and can slow in a downturn.
- Currency exposure — a large share of revenue is from North America and Europe; rupee moves swing reported margins.
- Margin durability — the ~400 bps FY26 margin gain is the core bull point; watch whether it holds in FY27 or was partly one-off.
- Stock has de-rated — the price sits near ₹258, well off its ₹385 high, and down over the past year despite strong profits.
- Minor compliance blips — a ₹10 lakh SEEPZ penalty for delayed SOFTEX filings and one trustee deviation were disclosed and rectified; not material but worth noting.
- Rising promoter control — creeping promoter stake via buybacks is worth tracking for governance balance over time.
Q1 FY27 results were due around 16 July 2026 and will be the first read on whether FY26's margin expansion is sustainable.
Frequently Asked Questions
Can I still tender my shares?
No. The window closed on 29 May 2026 and the shares were extinguished on 11 June 2026. The offer is fully completed.
What was the buyback price and premium?
₹328 per share — about 21.9% above the ₹269 announcement-day price and ~23.4% above the ₹265.85 board-meeting close.
Why did I get so few shares accepted?
The offer was oversubscribed 4.5 times, so on average only ~22.2% of tendered shares were bought. Large institutional holders absorbed a big chunk of the pool.
How are the proceeds taxed?
Since October 2024, the full buyback amount is taxed as a deemed dividend at your slab rate with no cost deduction; the purchase cost becomes a carry-forward capital loss. High-bracket investors saw most of the premium eroded.
Did promoters participate?
No. Their non-participation lifted public entitlement and passively raised promoter holding from 39.07% to 40.02%.
Disclaimer
This report is prepared by ShareBazaar Online for information and educational purposes only. It is not investment, legal or tax advice and contains no buy, sell or hold recommendation. Figures relating to the buyback are drawn from Onward Technologies Limited's Public Announcement, Letter of Offer and post-buyback disclosures; market prices and financial data are sourced from NSE, BSE and public filings as dated within the report, and some ratios are ShareBazaar Online estimates. Corporate actions and market data can change; readers should verify against primary sources and consult a SEBI-registered adviser and a qualified tax professional before acting. ShareBazaar Online accepts no liability for decisions taken on the basis of this report.