
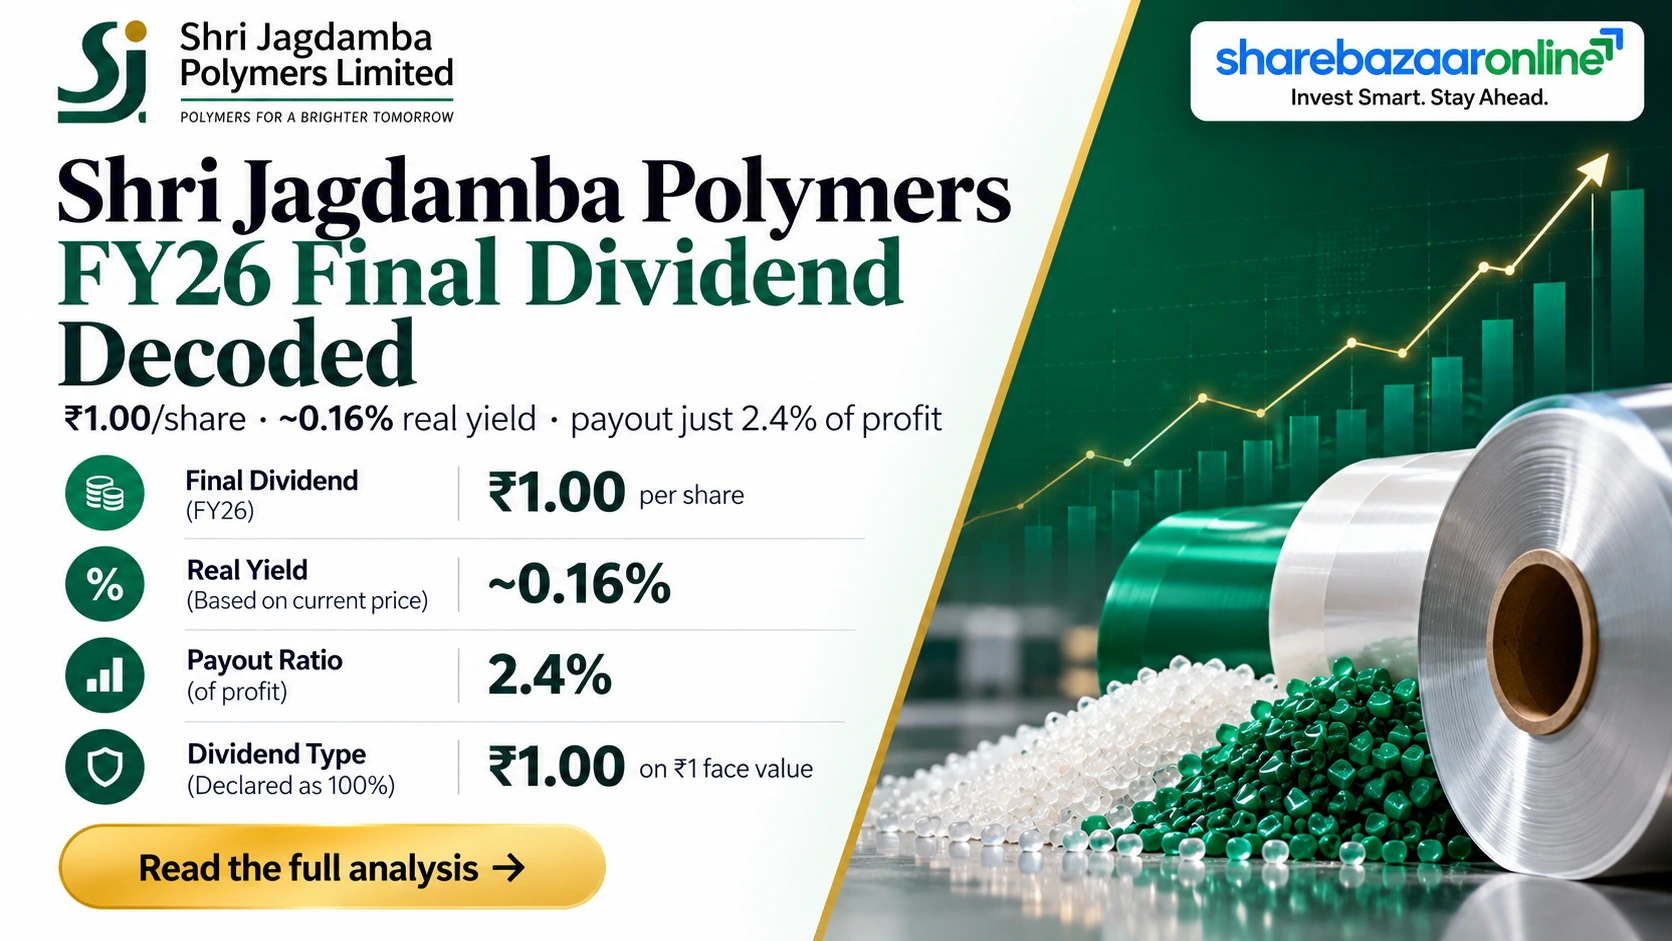
Dividend Snapshot – Shri Jagdamba Polymers Limited
Shri Jagdamba Polymers Limited has declared a Final Dividend of ₹1.00 per share for the financial year 2025–26. On a face value of just ₹1, that headline reads as a 100% dividend — but the real cash yield on the market price is only about 0.16%. The Shri Jagdamba Polymers dividend is a token, highly-covered payout from a technical-textiles manufacturer, not an income play. This analysis separates the eye-catching percentage from what actually lands in a shareholder’s bank account.
Dividend Per Share
₹1.00 (100% of FV ₹1)
Dividend Type
Final Dividend (FY2025–26)
Real Dividend Yield (CMP ~₹607)
~0.16%
Record Date
17 September 2026
Dividend Payout Ratio
~2.4% of PAT
Total Dividend Outflow
~₹0.88 Cr
Company Overview – Shri Jagdamba Polymers
Incorporated in 1985 and headquartered in Ahmedabad, Shri Jagdamba Polymers is a manufacturer and exporter of technical textiles — woven and non-woven polypropylene (PP) and HDPE fabrics, geo-textiles, and FIBC (bulk) bags used across packaging, infrastructure and industrial end-markets. The stock trades on the BSE under code 512453 and on the NSE under the symbol SHRJAGP, with trading on the NSE permitted from 17 August 2026. Its ISIN is INE564J01026 and the face value is ₹1 following a 10:1 stock split in November 2017. Classified as a micro-cap with a market capitalisation of roughly ₹530–600 Cr, the company remains promoter-led, with promoters holding 72.94%.
Financial Analysis – Shri Jagdamba Polymers
FY2025–26 was a softer year for Shri Jagdamba Polymers. On a consolidated basis, revenue fell to ₹431 Cr from ₹481 Cr (down ~10.4%), while net profit declined to ₹36.24 Cr from ₹48.09 Cr (down ~24.6%). Operating margin compressed from 14.3% to 10.2%. Importantly, consolidated earnings included around ₹20.1 Cr of other income — roughly 55% of reported PAT — alongside a ₹2.86 Cr exceptional insurance settlement. Standalone net profit was higher at ₹41.39 Cr, meaning the consolidated entity was dragged lower by subsidiary-level losses. Earnings quality, not the dividend itself, is the real talking point this year.
Shri Jagdamba Polymers Dividend History
Dividend per share restated to the current face value of ₹1 (Ind AS 33 basis). Pre-November 2017 payouts were declared on a ₹10 face value and are shown here on a comparable restated basis.
| Financial Year | Dividend % | DPS (restated, FV ₹1) | Type |
|---|---|---|---|
| FY2025–26 | 100% | ₹1.00 | Final |
| FY2024–25 | 75% | ₹0.75 | Final |
| FY2023–24 | 75% | ₹0.75 | Final |
| FY2022–23 | 50% | ₹0.50 | Final |
| FY2021–22 | 50% | ₹0.50 | Final |
| FY2020–21 | 40% | ₹0.40 | Final |
| FY2019–20 | 25% | ₹0.25 | Final |
| FY2018–19 | 20% | ₹0.20 | Final |
| FY2013–14 to FY2017–18 | 10% | ₹0.10 | Final |
Source: BSE/NSE corporate-action records and dividend trackers (Trendlyne, Motilal Oswal, Groww). No dividend cuts, suspensions or special dividends on record.
Expert Commentary on the Shri Jagdamba Polymers Dividend
The “100%” label on the Shri Jagdamba Polymers dividend is a classic face-value illusion. Because the face value is only ₹1, a 100% dividend is just ₹1 per share — a real yield near 0.16% against a market price around ₹607. The more useful signal is the trend: the company has raised its dividend from ₹0.10 (FY14) to ₹1.00 (FY26), a roughly 10x rise over twelve years. The second signal is earnings quality — with other income at ~55% of PAT and operating profit down ~36%, the dividend hike arrived in a year when the core business weakened, not strengthened. Generous in percentage terms; immaterial in rupee terms.
Shri Jagdamba Polymers Dividend Outlook
The company has disclosed no dividend-distribution policy target or forward guidance, so any outlook must stay rooted in the visible pattern. Historically, Shri Jagdamba Polymers pays a single annual final dividend, declared around August–September and approved at the AGM. The payout ratio has stayed low (~2–3% of profit), leaving the vast majority of earnings for reinvestment into capacity. With a fresh capex cycle lifting fixed assets sharply and a strong Q1 FY27 rebound (consolidated PAT of ₹20.0 Cr in the June 2026 quarter), the capacity for continued token dividends appears intact. What is Not Disclosed by Company is any commitment to raise the payout ratio or shift toward an income-oriented distribution.
Dividend Announcement Summary – Shri Jagdamba Polymers
The Board of Shri Jagdamba Polymers met on 31 August 2026 to consider and recommend a Final Dividend of ₹1.00 per equity share (100% of the ₹1 face value) for the year ended 31 March 2026, subject to shareholder approval. The dividend was approved by members at the company’s 42nd Annual General Meeting, held on 24 September 2026. The record date for determining eligible shareholders was fixed at 17 September 2026, with a book-closure window of 18–24 September 2026 for the AGM. This is a final dividend only; no interim or special dividend was declared for the year.
Shri Jagdamba Polymers Key Dates Timeline
Board Recommendation
31 August 2026
Ex-Dividend Date
17 September 2026
Record Date
17 September 2026
AGM (Approval)
24 September 2026
Payment Date
Within 30 days of AGM
Specific date Not Disclosed by Company; statutorily due by ~24 October 2026 under the Companies Act.
Financial Year
FY2025–26
Shri Jagdamba Polymers Dividend Yield Analysis
A dividend yield is simply the annual dividend divided by the share price. For Shri Jagdamba Polymers, a ₹1.00 dividend against a market price of about ₹607 gives a real yield of roughly 0.16%; measured on the announcement-date price of about ₹632, it is ~0.158%. The “100%” figure quoted on dividend screens is calculated on the ₹1 face value, not the market price — which is why the two numbers look so far apart. Here, the low yield is not caused by a falling share price or a weak special payout; it reflects a deliberately conservative payout policy. The Shri Jagdamba Polymers dividend yield sits far below a bank fixed deposit and should not drive an income decision.
Shri Jagdamba Polymers Dividend History Analysis
On the record available, Shri Jagdamba Polymers qualifies as a consistent, growing dividend payer — even if the absolute amounts are small. The restated dividend per share has climbed steadily: ₹0.10 through FY14–FY18, then ₹0.20, ₹0.25, ₹0.40, ₹0.50, ₹0.75 and now ₹1.00 for FY26. That is a compound growth of about 21% a year over twelve years, with no cuts, no suspensions, and no reliance on one-off special dividends. The caveat: the growth is off a very low base, so even a decade of raises leaves the rupee payout modest. Consistency is a genuine positive for governance signalling; it is not, by itself, an income thesis.
Shri Jagdamba Polymers Financial Performance Analysis
FY26 shows negative operating leverage: revenue fell ~10.4%, but operating profit fell much harder, by ~36% (from ₹69 Cr to ₹44 Cr), and consolidated PAT dropped ~24.6%. The gap between the revenue decline and the sharper profit decline points to margin compression — a mix of weaker realisations and relatively fixed costs across a capacity-heavy base. Reported PAT was cushioned by ~₹20.1 Cr of other income, so core operating profitability is weaker than the headline bottom line suggests. Encouragingly, the June 2026 quarter rebounded to a consolidated PAT of ₹20.0 Cr, hinting at a cyclical recovery. Over five years, Screener pegs sales growth at a modest ~12%, confirming this is a steady, not fast-growing, manufacturer.
Shri Jagdamba Polymers Cash Flow Analysis
Cash tells a sharper story than profit. Operating cash flow was negative in both FY24 (-₹11.7 Cr) and FY25 (-₹34.5 Cr) as receivables ballooned — trade receivables swelled to around ₹120–135 Cr, and the cash-conversion cycle ran long. In FY26 it recovered strongly to +₹51.2 Cr, a genuine positive. However, free cash flow stayed negative (about -₹5 Cr in FY26) because of heavy capacity capex that pushed fixed assets up sharply. The practical takeaway: the tiny ₹0.88 Cr dividend is comfortably funded by current earnings and reserves, not by free cash flow, and certainly not by asset sales. The dividend is affordable; the free-cash-flow drain is a capex choice, not a distress signal.
Shri Jagdamba Polymers Balance Sheet Strength
The balance sheet is adequately capitalised but has levered up to fund growth. Reserves stand at about ₹328 Cr and book value is around ₹376 per share, against total equity near ₹329 Cr. Cash and investments total roughly ₹98.6 Cr (about ₹31.6 Cr liquid plus ₹67 Cr in longer-term investments). The notable shift: the company moved from a net-cash position in FY24 to net debt of about ₹61 Cr in FY26, as borrowings funded the capex and working-capital build. ROE has eased to around 11–12% and ROCE to roughly 13%, well below the 30%-plus returns of earlier years. For the dividend, the balance sheet is more than sufficient; for growth, leverage is now a variable to watch.
Shri Jagdamba Polymers Dividend Sustainability Analysis
Earnings Coverage (EPS ÷ DPS)
~41x (consolidated)
Operating Cash Flow Coverage
~58x (FY26 OCF)
Free Cash Flow Coverage
Negative (FCF was -₹5 Cr)
Liquidity / Cash Coverage
~113x (cash + investments)
On three of four tests the Shri Jagdamba Polymers dividend is very comfortably covered; it fails the free-cash-flow test only because of heavy capex, not weak operations. Verdict: Sustainable. The outflow is so small (₹0.88 Cr against ₹36 Cr of profit) that affordability is never in question.
Shri Jagdamba Polymers Peer Comparison
| Company | Dividend Yield | Payout Ratio | ROE |
|---|---|---|---|
| Shri Jagdamba Polymers | ~0.16% | ~2.4% | ~11–12% |
| Time Technoplast | ~1.2% | ~14% | ~13–15% |
| Garware Technical Fibres | ~1.2% | ~20% | ~18–20% |
Peer yields and payouts sourced from exchange/dividend trackers (Trendlyne, Simplywall.st, StockEvents) as of September 2026; indicative and subject to price movement.
Against listed plastics and technical-textiles peers, Shri Jagdamba Polymers is a clear outlier on the low side for both yield and payout. Time Technoplast and Garware Technical Fibres pay out 14–20% of profit and yield near 1.2%; Shri Jagdamba retains almost everything to fund capacity. That is neither good nor bad in itself — it simply confirms the stock is positioned as a reinvestment/growth story, not a dividend-income one.
Shri Jagdamba Polymers Promoter Impact Analysis
With promoters holding 72.94%, the lion’s share of the dividend flows back to the promoter group. Of the total outflow of about ₹0.88 Cr, roughly ₹0.64 Cr accrues to promoters and only about ₹0.24 Cr to all public and institutional shareholders combined. Because the absolute pool is tiny, the distribution is not a meaningful wealth-transfer mechanism for anyone — promoter or minority. Institutional ownership is thin (FII 0.02%, DII ~5.1%), so the free float is dominated by retail. The practical read: this dividend is a signalling gesture of financial health and continuity, not a route by which the company returns surplus capital to minority investors.
Shri Jagdamba Polymers Dividend Taxation Analysis
Since FY2020–21, dividends are taxed in the hands of the shareholder at their applicable income-tax slab rate; there is no separate Dividend Distribution Tax. Under Section 194, the company deducts TDS at 10% if the total dividend paid to a resident shareholder exceeds ₹10,000 in a financial year (the threshold was raised from ₹5,000 in Budget 2025); TDS is 20% if PAN is not furnished. Shareholders can claim credit for TDS while filing returns.
Worked example (generic illustration)
An investor holding 1,000 shares receiving a dividend of ₹10 per share earns a gross dividend of ₹10,000. In the 30% slab, tax is ₹3,000, leaving a net of ₹7,000. Applied to Shri Jagdamba Polymers’ actual ₹1 dividend, 1,000 shares yield only ₹1,000 gross — below the ₹10,000 TDS threshold, so no TDS applies, and the slab tax of ₹300 leaves ₹700 net. The effective post-tax yield is a fraction of a percent.
Key Risks for Shri Jagdamba Polymers Investors
- Earnings-quality risk: roughly 55% of FY26 consolidated PAT came from other income; a drop in non-operating income would expose weaker core profitability.
- Margin and demand cyclicality: operating margin fell from 14.3% to 10.2% and revenue declined ~10% in FY26, reflecting sensitivity to polymer prices and end-market demand.
- Working-capital intensity: high receivables drove two consecutive years of negative operating cash flow (FY24 and FY25), a recurring stress point.
- Rising leverage: the company moved from net cash to net debt of ~₹61 Cr while funding heavy capex; interest costs and execution become more important.
- Micro-cap liquidity and concentration: promoters own 72.94%, free float and trading volumes are thin, and the price can be volatile.
- Negligible dividend income: at a ~0.16% yield, the dividend offers virtually no income cushion.
What To Monitor in Shri Jagdamba Polymers
- Core margin recovery: whether operating margin rebuilds toward the 14%+ seen in FY25 as the Q1 FY27 momentum continues.
- Operating cash flow conversion: whether FY26’s positive ₹51 Cr OCF holds, and whether receivables stay controlled.
- Capex payoff and free cash flow: whether the expanded capacity turns FCF positive and lifts asset turns.
- Debt trajectory: whether net debt (~₹61 Cr) is reduced as the capex cycle matures.
- Payout policy: any move to raise the payout ratio above the current ~2–3%, which would change the dividend thesis.
- Quality of earnings: the share of other income in reported profit in coming quarters.
Should You Consider Shri Jagdamba Polymers for Dividend Income?
The Shri Jagdamba Polymers dividend of ₹1.00 per share is best understood as a consistency signal, not an income source. The positives are real: an unbroken, rising dividend over twelve years, an outflow covered 40x by earnings and 113x by cash and investments, and a recovering operating cash flow. The negatives are equally clear: a real yield of only ~0.16%, a payout far below peers, FY26 earnings leaning heavily on other income, negative free cash flow, and rising debt from an aggressive capex cycle. For an income seeker, the yield is immaterial; for a growth-oriented investor, the dividend is a minor footnote to a technical-textiles capacity story. Readers should weigh these facts against their own goals and consult a SEBI-registered adviser.
Frequently Asked Questions About Shri Jagdamba Polymers Dividend
What dividend has Shri Jagdamba Polymers announced for FY2025–26?
What is the Shri Jagdamba Polymers dividend yield?
What is the record date for the Shri Jagdamba Polymers dividend?
What was the ex-dividend date?
When will the Shri Jagdamba Polymers dividend be paid?
Who was eligible for the dividend?
How is the Shri Jagdamba Polymers dividend taxed?
Is the Shri Jagdamba Polymers dividend sustainable?
What is the dividend history of Shri Jagdamba Polymers?
What should investors monitor going forward?
What is the face value and why does the dividend percentage look so high?
How does the Shri Jagdamba Polymers dividend compare with peers?
Disclaimer – Shri Jagdamba Polymers Dividend Analysis
This article is for informational and educational purposes only and does not constitute investment, legal or tax advice, nor a recommendation to buy, sell or hold any security. ShareBazaar Online is not a SEBI-registered investment adviser. All figures are drawn from publicly available disclosures, exchange filings and third-party financial data sources and may contain errors or become outdated; dividend amounts, dates and financial figures should be independently verified against official BSE/NSE filings and the company’s annual report before any decision. Market price, yield and ratio figures are indicative and change with the share price. Investments in equities, especially micro-cap stocks, carry risk including loss of capital. Readers should conduct their own research and consult a qualified, SEBI-registered financial adviser and tax professional before investing. Past dividend history is not indicative of future distributions.