
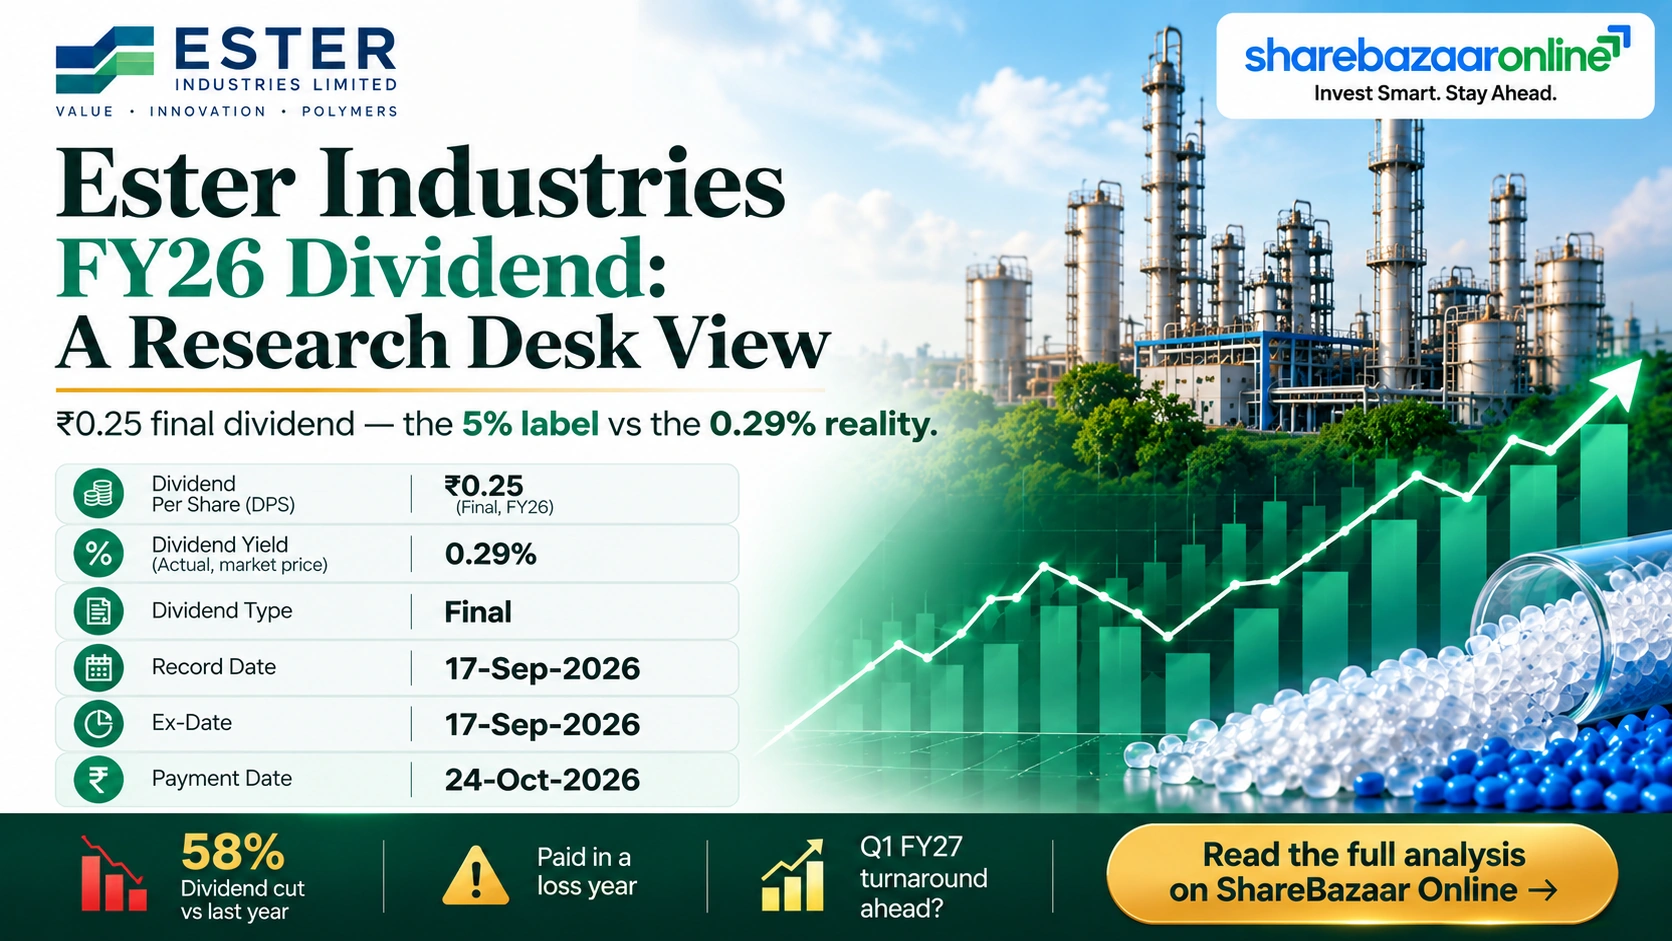
Dividend Snapshot – Ester Industries Limited
Ester Industries Limited (NSE: ESTER, BSE: 500136) has lined up a final dividend of ₹0.25 per equity share for FY2025-26 on a face value of ₹5. The board fixed 17 September 2026 as the record date, with payment due on or before 24 October 2026, subject to shareholder approval at the 40th AGM. The headline reads like a 5% dividend, but on the live market price of roughly ₹85, the real Ester Industries dividend yield is only about 0.29%. Two facts stand out: the payout is a 58% cut from last year’s ₹0.60, and it is being paid in a year the group reported a consolidated net loss of ₹27 crore.
Key Dividend Figures
| Dividend per share | ₹0.25 |
| Dividend on face value | 5% |
| Real yield (CMP ~₹85) | ~0.29% |
| Dividend type | Final |
| Financial year | FY2025-26 |
Key Dates
| Record date | 17 Sep 2026 |
| Ex-dividend date | 17 Sep 2026 |
| AGM date | 24 Sep 2026 |
| Payment by | 24 Oct 2026 |
Company Overview – Ester Industries Limited
Ester Industries Limited is an Uttarakhand-based specialty materials manufacturer operating in two segments: polyester chips and film (PET film and resins) and specialty polymers. The polyester film business is the larger revenue driver, while specialty polymers is the higher-value, growth-focused arm. The company is listed on both the NSE (symbol ESTER) and BSE (code 500136), with ISIN INE778B01029, and carries a market capitalisation of roughly ₹890 crore, placing it firmly in the small-cap category. It reports both standalone results and consolidated results that fold in its subsidiary Ester Filmtech Limited and joint venture Ester Loop Infinite Technologies Private Limited. For a dividend-paying company in a cyclical, capital-intensive industry, the consolidated picture is the more honest gauge of true dividend-paying capacity, and that is where this analysis focuses.
Financial Analysis – Ester Industries Limited
Ester Industries grew FY26 consolidated revenue to ₹1,375 crore (from ₹1,282 crore in FY25), yet still slipped to a net loss of ₹27 crore. The gap between a rising top line and a loss-making bottom line is the story: operating profit fell to ₹93 crore (7% margin) from ₹147 crore (12%) a year earlier, and a heavy finance and depreciation burden pushed the group into the red.
| Consolidated (₹ Cr) | FY24 | FY25 | FY26 |
|---|---|---|---|
| Revenue | 1,063 | 1,282 | 1,375 |
| Operating profit | -23 | 147 | 93 |
| Net profit | -121 | 14 | -27 |
| EPS (₹) | -12.88 | 1.46 | -2.81 |
Source: company filings; Screener.in consolidated data.
Ester Industries Limited Dividend History
Ester Industries Dividend Payment History (per share, face value ₹5)
| Financial Year | Dividend / Share | Note |
|---|---|---|
| FY2025-26 | ₹0.25 | Current – final |
| FY2024-25 | ₹0.60 | Final |
| FY2023-24 | Nil | Loss year |
| FY2022-23 | ₹0.50 | Final |
| FY2021-22 | ₹3.80 | Interim + final |
| FY2020-21 | ₹3.40 | Interim + final |
| FY2019-20 | ₹2.50 | Final |
| FY2018-19 | ₹0.50 | Final |
Source: exchange filings and dividend records (TipRanks, Screener.in). Amounts shown per financial year; where two payouts occurred, interim and final are combined.
Expert Commentary on Ester Industries Dividend
The most important thing to understand about the Ester Industries dividend is that the “5%” label is a face-value figure, not a return. At ₹0.25 on a ₹5 face value it reads as 5%, but measured against the market price near ₹85 the actual yield is only about 0.29% – a roughly 17-fold gap. Two further signals deserve attention. First, the payout has been cut 58% from ₹0.60 to ₹0.25. Second, it is being distributed in a year of consolidated losses. This is not a yield play; it is a token continuity dividend. The silver lining is size: at just ₹2.61 crore of total outflow, the cheque is trivial against the balance sheet and operating cash flow, so affordability is not the concern – the earnings quality behind it is.
Ester Industries Limited Dividend Outlook
The forward trajectory of the Ester Industries dividend depends almost entirely on whether the specialty polymers push and PET film margins can pull the group back to sustained profitability. The dividend has already proven cyclical – ₹3.80 in FY22, nil in FY24, ₹0.60 in FY25, and now ₹0.25 – so investors should not anchor to a fixed payout. A genuinely encouraging sign sits in the latest quarter: Q1 FY27 standalone profit after tax of ₹14.51 crore (EPS ₹1.43) marks a sharp turnaround from the full-year loss. If that recovery holds across FY27, dividend capacity could improve; if margins slip again in a cyclical polyester market, further cuts or a pause remain possible. The payout is management’s signal of intent, not a guaranteed stream.
Dividend Announcement Summary – Ester Industries Limited
The Ester Industries final dividend for FY2025-26 was recommended by the board on 13 May 2026 at ₹0.25 per equity share of ₹5 face value. At its 11 August 2026 board meeting, the company confirmed the 40th AGM for 24 September 2026 and fixed the record date and cut-off date.
- Dividend: ₹0.25 per share (final), FY2025-26
- Record date: 17 September 2026 – to determine eligible members
- AGM: 24 September 2026, via video conferencing
- Payment: on or before 24 October 2026, post AGM approval
- Approval: subject to shareholder approval at the AGM
Ester Industries Limited Dividend Record Date and Key Dates Timeline
Board recommends final dividend of ₹0.25/share for FY2025-26.
Board fixes record date and convenes the 40th AGM.
Record date and ex-dividend date – shareholders on the register on this date were eligible.
40th Annual General Meeting; shareholders approve the dividend.
Last date for dividend payment to eligible shareholders.
Ester Industries Limited Dividend Yield Analysis
The single biggest source of confusion with the Ester Industries dividend is the face-value illusion. A “5% dividend” sounds generous, but that 5% is calculated on the ₹5 face value, not on what you pay in the market. Here is the reality check:
Headline (on face value)
5%
₹0.25 on ₹5
Real market yield
~0.29%
₹0.25 on ~₹85 CMP
In cash terms, a shareholder holding 1,000 shares (worth about ₹85,000) receives just ₹250 before tax. The Ester Industries dividend yield of about 0.29% also sits below the sector average dividend yield of roughly 0.93%, confirming this is a low-yield income proposition.
Ester Industries Dividend History Analysis
Ester Industries is best classified as an irregular, cyclical dividend payer, not a consistent one. The pattern tracks the fortunes of the polyester cycle rather than a fixed policy: generous payouts of ₹3.80 (FY22) and ₹3.40 (FY21) in the boom years, a complete dividend skip in FY24 when the group posted a heavy loss, then a cautious resumption at ₹0.60 in FY25 and now a reduced ₹0.25. The current cut of 58% continues the downward step. For a dividend-focused investor, the key takeaway is that Ester Industries dividend income is unpredictable – it has been both skipped entirely and paid at 15 times the current level within the last five years. Treating it as a reliable annual stream would be a mistake.
Ester Industries Limited Financial Performance Analysis
The core issue for Ester Industries is negative operating leverage. Between FY25 and FY26, consolidated revenue rose about 7% (₹1,282 cr to ₹1,375 cr), yet operating profit fell 37% (₹147 cr to ₹93 cr) and the group swung from a ₹14 crore profit to a ₹27 crore loss. More sales delivered less profit – the hallmark of margin compression in a commodity-linked polyester film market, where raw-material and energy costs and pricing pressure squeeze spreads. A ray of recovery appears in Q1 FY27: standalone revenue of ₹339 crore with profit before tax of ₹19.42 crore and standalone PAT of ₹14.51 crore, a marked improvement that will need to persist across the year before it changes the full-year earnings picture.
Ester Industries Limited Cash Flow Analysis
Reported profit is an opinion; cash is a fact – and here the two diverge in a reassuring direction for once. Despite the FY26 consolidated net loss, Ester Industries generated positive operating cash flow of about ₹89 crore. That alone covers the tiny ₹2.61 crore dividend roughly 34 times over. The catch is capital spending: with investing outflows of about ₹116 crore, free cash flow (OCF plus investing) was negative at around ₹-27 crore.
How the dividend is funded: the ₹0.25 payout is comfortably met by operating cash flow, but the group as a whole is in a net cash-consuming, capex phase, so on a whole-company basis the small distribution is effectively drawn from reserves and financing rather than surplus free cash.
Ester Industries Limited Balance Sheet Strength
Ester Industries carries a leveraged balance sheet for a dividend payer. As of FY26, consolidated borrowings stood at about ₹729 crore against reserves of ₹734 crore – debt almost equal to accumulated reserves. The book value per share is around ₹80, close to the market price.
Borrowings
₹729 Cr
Reserves
₹734 Cr
The nuance for shareholders: the company is paying a dividend while carrying significant debt. The amount is small enough that it does not materially weaken the balance sheet, but a leveraged, loss-making year is not the textbook setting for a cash distribution.
Ester Industries Limited Dividend Sustainability
Four-Test Sustainability Scorecard
| Test | Result | Verdict |
|---|---|---|
| Earnings coverage | FY26 consolidated net loss | Fails |
| Operating cash flow coverage | OCF ₹89 cr vs ₹2.61 cr outflow (34x) | Passes |
| Free cash flow coverage | FCF negative (~₹-27 cr) | Fails |
| Liquidity / reserves | Reserves ₹734 cr absorb ₹2.61 cr easily | Passes |
Overall verdict: Conditionally Sustainable. The dividend is trivially affordable in absolute terms – reserves and operating cash flow dwarf the ₹2.61 crore cost. But it is not covered by current earnings or free cash flow, so its continuity rests on an earnings recovery rather than on present profitability.
Ester Industries Dividend Peer Comparison
Within the polyester film and specialty polymer space, Ester Industries screens as a low-yield, recovery-stage name rather than a dividend compounder. Its 0.29% yield trails the broader sector average of roughly 0.93%.
| Metric | Ester Industries | Sector reference |
|---|---|---|
| Dividend yield | ~0.29% | ~0.93% |
| ROE | -3.6% | Positive (varies) |
| ROCE | ~2.8% | Higher (varies) |
| Payout stance | Cyclical / cut | Mixed |
Sector reference figures are indicative benchmarks, not a single named peer; exact peer-level data is Not Disclosed by Company.
Ester Industries Limited Promoter Impact Analysis
Promoters hold 62.30% of Ester Industries (as of September 2026), which means the bulk of the dividend flows back to them. Of the total ₹2.61 crore outflow, the promoter group receives roughly ₹1.62 crore, leaving about ₹0.98 crore for all public and minority shareholders combined.
To promoters (62.30%)
~₹1.62 Cr
To public (37.70%)
~₹0.98 Cr
Because the payout is small and promoter holding is stable, there is no outsized extraction concern here – but investors should recognise that, as with most promoter-heavy companies, the dividend primarily benefits the controlling family.
Ester Industries Dividend Taxation Analysis
Under current Indian rules, dividend income is taxable in the hands of the shareholder at their applicable income-tax slab rate. The company deducts TDS at 10% under Section 194 if the total dividend paid to a resident shareholder in a financial year exceeds the threshold (raised to ₹10,000 from FY2025-26); for most small retail holders of Ester Industries, no TDS applies because the dividend is well under that limit.
Worked Example (1,000 shares)
| Shares held | 1,000 |
| Gross dividend (₹0.25 × 1,000) | ₹250 |
| TDS (below threshold) | ₹0 |
| Tax at 30% slab | ₹75 |
| Net in hand (30% slab investor) | ₹175 |
| Effective post-tax yield | ~0.21% |
Illustrative only. Tax outcomes vary by individual circumstances; this is not tax advice.
Ester Industries Limited Key Risks
- Loss-making base year: the dividend is paid on top of a FY26 consolidated net loss of ₹27 crore, so it is not backed by current profit.
- Margin cyclicality: PET film and polyester chip spreads are commodity-linked; FY26 operating margin fell to 7% from 12%, and further compression would pressure both earnings and payouts.
- Leverage: borrowings of about ₹729 crore roughly match reserves, raising interest burden and limiting room for larger distributions.
- Dividend unpredictability: history includes a full skip (FY24) and a 58% cut this year – income is not reliable.
- Negative free cash flow: heavy capex pushed FY26 FCF negative, meaning the group is consuming cash at a whole-company level.
Ester Industries Dividend: What To Monitor
- Quarterly profitability: whether the Q1 FY27 turnaround (standalone PAT ₹14.51 crore) continues through the year.
- Operating margin trend: recovery in PET film and specialty polymer spreads back toward the FY25 12% level.
- Debt trajectory: whether borrowings fall from the ~₹729 crore level as capex projects complete.
- Free cash flow: the point at which investing outflows ease and FCF turns positive.
- Specialty polymers scale-up: growth and margin contribution from the higher-value segment relative to commodity film.
Should You Consider Ester Industries for Dividend Income?
The Ester Industries FY2025-26 dividend of ₹0.25 per share is best understood as a symbolic continuity payout, not an income stream. The headline 5% on face value shrinks to a real yield of roughly 0.29% at market price, the amount has been cut 58% year-on-year, and it is being paid in a year of consolidated losses. On the positive side, the ₹2.61 crore cost is trivially affordable against reserves and operating cash flow, and the Q1 FY27 return to standalone profit hints at a possible turnaround. For anyone evaluating Ester Industries, the dividend is a side note; the real question is whether the business can convert rising revenue back into sustained profit. This article presents the positives, negatives, risks and monitoring factors so you can decide for yourself – it does not make any buy, sell or hold recommendation.
Frequently Asked Questions About Ester Industries Dividend
What dividend has Ester Industries announced for FY2025-26?
What is the Ester Industries dividend yield?
What is the record date for the Ester Industries dividend?
What is the ex-dividend date for Ester Industries?
When will the Ester Industries dividend be paid?
Who is eligible for the Ester Industries dividend?
How is the Ester Industries dividend taxed?
Is the Ester Industries dividend sustainable?
What is the Ester Industries dividend history?
Why did Ester Industries cut its dividend this year?
What should investors monitor on Ester Industries?
What are the NSE symbol, BSE code and ISIN of Ester Industries?
Disclaimer
This article is for informational and educational purposes only and does not constitute investment, financial, legal or tax advice. ShareBazaar Online is not a SEBI-registered investment adviser. The analysis is based on publicly disclosed company filings and third-party data sources believed to be reliable; figures sourced outside the company filing are cited and may differ across providers. Market prices, yields and ratios are approximate and change continuously. Nothing here is a recommendation to buy, sell or hold any security. Investors should conduct their own research and consult a qualified financial adviser before making any investment decision. ShareBazaar Online accepts no liability for any loss arising from the use of this content.