
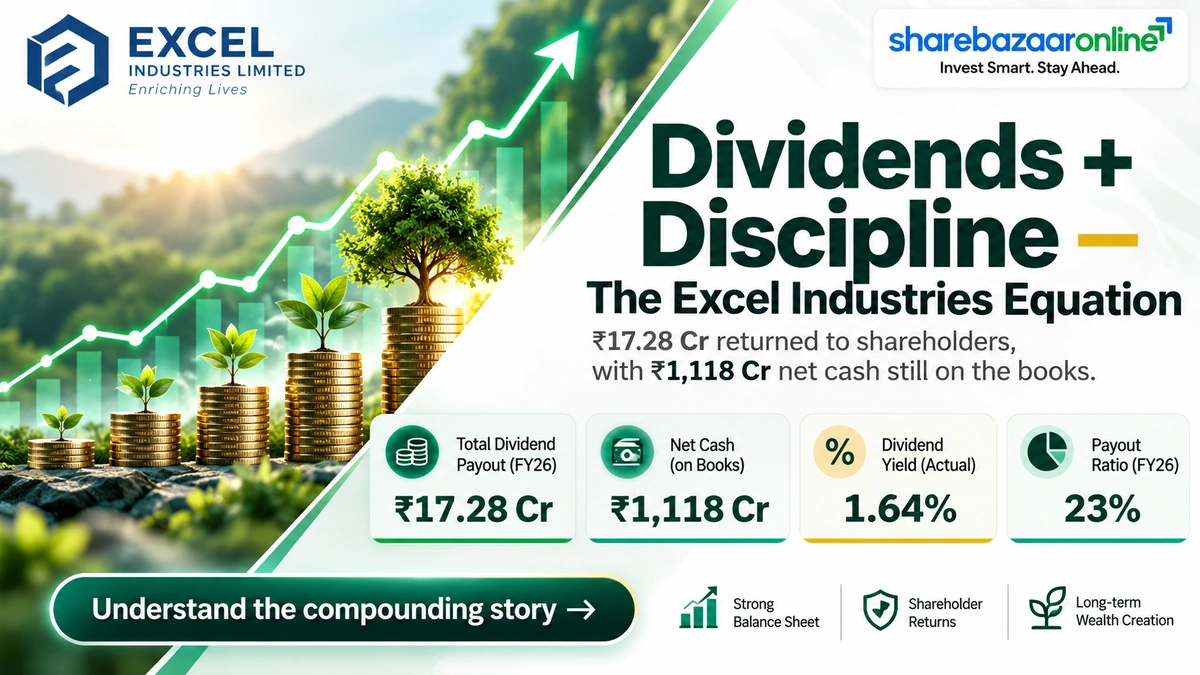
Dividend Snapshot – Excel Industries Limited
Excel Industries Limited (NSE: EXCELINDUS, BSE: 500650) has declared a Final Dividend of ₹13.75 per equity share for FY2025-26, equal to 275% on a face value of ₹5. The headline percentage looks large, but on the current market price of ₹837 the real dividend yield works out to only 1.64%. The payout was recommended by the Board on 22 May 2026 and the record date was fixed as 17 September 2026. For a cash-rich specialty chemicals company sitting on roughly ₹1,126 crore of investments, this is a modest, reserve-backed distribution rather than a high-yield opportunity.
Dividend Per Share
₹13.75
275% of ₹5 face value · Final
Dividend Yield (on CMP ₹837)
1.64%
Yield at announcement: 1.40%
Record Date
17 Sep 2026
Ex-Date: 17 Sep 2026 (T+1)
Total Dividend Outflow
₹17.28 Cr
Payout ratio: ~23% of profit
Company Overview – Excel Industries Limited
Excel Industries Limited is a Mumbai-headquartered specialty chemicals manufacturer operating across agrochemical intermediates, phosphonates, pharmaceutical intermediates, polymer inputs and environment & biotech solutions. The company reports itself as the world’s No. 1 producer of DETC and among the top five global producers of phosphonates. It is a small-cap, promoter-led business (CIN: L24200MH1960PLC011807) with a long listing history on both the BSE and NSE. In FY2025-26 it recorded consolidated revenue of roughly ₹1,095 crore and net profit of about ₹75.67 crore. The business is almost debt-free and carries a large treasury book, which shapes its ability to maintain dividends even in weaker earnings years.
Identifiers
ISIN: INE369A01029
NSE: EXCELINDUS · BSE: 500650
Sector / Size
Specialty Chemicals (Agrochem)
Market Cap: ₹1,052 Cr (small-cap)
Financial Analysis – Excel Industries Limited
The headline for FY2025-26 is a divergence between the top line and the bottom line at Excel Industries Limited. Consolidated revenue rose about 12% to ₹1,095 crore, yet net profit fell 11% to ₹75.67 crore and operating margin slipped from 12% to 10%. In other words, the company sold more but earned less — a sign of margin pressure rather than operating leverage. Reported earnings were also supported by around ₹24 crore of other (largely treasury) income, roughly a quarter of pre-tax profit. Return ratios remain soft, with ROE near 4.62% and ROCE around 6.17%, both well below the company’s own historical peaks.
FY26 Revenue / PAT
₹1,095 Cr / ₹75.67 Cr
Revenue +12%, PAT −11% YoY
EPS / P/E / ROE
₹60.19 / 14.7x / 4.62%
Consolidated basis
Excel Industries Limited Dividend History
| Financial Year | Dividend / Share | % of Face Value | Type |
|---|---|---|---|
| FY2025-26 | ₹13.75 | 275% | Final |
| FY2024-25 | ₹13.75 | 275% | Final |
| FY2023-24 | ₹5.50 | 110% | Final |
| FY2022-23 | ₹11.25 | 225% | Final |
| FY2021-22 | ₹22.50 | 450% | Final |
| FY2020-21 | ₹11.25 | 225% | Final |
| FY2019-20 | ₹10.00 | 200% | Interim |
| FY2018-19 | ₹18.75 | 375% | Final |
| FY2017-18 | ₹12.50 | 250% | Final |
| FY2016-17 | ₹6.00 | 120% | Final |
Source: company disclosures / exchange filings (BSE, NSE). 10-year average payout: ~₹12.53 per share.
Expert Commentary on Excel Industries Limited Dividend
The most important fact for investors is that Excel Industries Limited held its dividend flat at ₹13.75 even as profit fell 11% in FY2025-26. The company could do this comfortably because the payout consumes only about 23% of profit and is covered more than 4.3 times by earnings per share. The real cushion, however, is the balance sheet: an investment book of roughly ₹1,126 crore against negligible debt covers the ₹17.28 crore outflow around 65 times over. The caveat is free cash flow, which turned negative (−₹25 crore) in FY2025-26 as capital spending rose. So this year’s dividend leaned on reserves and earnings, not on current-year surplus cash generation.
Excel Industries Limited Dividend Outlook
Looking ahead, the sustainability of future dividends at Excel Industries Limited rests on two things: a recovery in operating margins and continued discipline on capital spending. Management has flagged Performance Solutions, YP Derivatives and Contract Manufacturing as growth drivers, and a biocides capacity addition of 2,530 tonnes per annum became operational in FY2025-26. If these lift utilisation and margins, free cash flow can return to positive and the current payout becomes self-funding. If margins stay compressed and capex remains elevated, dividends would continue to draw on the treasury book rather than fresh cash flows. The fortress balance sheet makes a near-term cut unlikely, but it does not, by itself, guarantee dividend growth. This is an outlook, not a forecast.
Excel Industries Limited Dividend Announcement Summary
The Board of Excel Industries Limited recommended a Final Dividend of ₹13.75 per equity share (275%) for the financial year 2025-26 at its meeting on 22 May 2026, subject to member approval. The record date to determine eligible shareholders was fixed as 17 September 2026, intimated to the exchanges under Regulation 42 of SEBI (LODR) Regulations, 2015. Members approved the dividend at the 65th Annual General Meeting held on 24 September 2026 via video conferencing. As a final dividend, the payout is on the equity share capital for FY2025-26 and, under the Companies Act, 2013, becomes payable within 30 days of declaration. All figures above are drawn directly from the company’s own exchange filings.
Excel Industries Limited Dividend Key Dates Timeline
Board Recommendation
22 May 2026
Record Date
17 September 2026
Ex-Dividend Date
17 September 2026
Same as record date under T+1 settlement
AGM Approval
24 September 2026
65th AGM
Payment
On or before 24 Oct 2026
Within 30 days of declaration (Companies Act, 2013)
Financial Year
FY2025-26
Excel Industries Limited Dividend Yield Analysis
This is where many retail investors are misled. The “275%” figure is calculated on the ₹5 face value, not on the market price. The real dividend yield of Excel Industries Limited is ₹13.75 ÷ ₹837 = 1.64%. At the announcement-date price of roughly ₹982, the yield was an even lower 1.40%. The modest uptick to 1.64% is driven partly by the share price falling about 25% over the past year, not by any increase in the dividend, which is unchanged from last year. A higher yield caused by a falling price is not the same as a stronger dividend — a distinction income investors should keep firmly in mind.
Face-value headline
275%
= ₹13.75 on ₹5 FV
Real market yield
1.64%
on CMP ₹837
Excel Industries Limited Dividend History Analysis
Over the past decade Excel Industries Limited has paid a dividend every single year, which marks it as a consistent but cyclical payer rather than a steadily growing one. The per-share payout has swung widely — from a high of ₹22.50 in FY2021-22 to a low of ₹5.50 in FY2023-24 — tracking the volatility in its chemical-cycle earnings. The sharp cut to ₹5.50 in FY2023-24 came in a year when profit collapsed, confirming that the dividend is linked to annual performance. The recovery to ₹13.75 in FY2024-25 and its continuation into FY2025-26 shows the payout has stabilised at a higher base, but the record is one of variability, not uninterrupted growth.
Excel Industries Limited Financial Performance Analysis
The operating-leverage picture at Excel Industries Limited worked in reverse during FY2025-26. Revenue grew about 12% (₹978 Cr to ₹1,095 Cr), but operating profit fell ~6% (₹121 Cr to ₹114 Cr) and net profit dropped ~11% (₹85 Cr to ₹75.67 Cr). The driver was margin compression: operating margin narrowed from 12% to 10%, meaning input, conversion or mix costs rose faster than selling prices. A further flag is quality of earnings — about ₹24 crore (roughly 24%) of pre-tax profit came from other income rather than the core chemicals business. Investors should read the profit number as supported by treasury earnings, not purely operational strength.
Operating margin trend
12% → 10%
FY25 to FY26 (compression)
Other income share of PBT
~24%
₹24 Cr of ₹98 Cr PBT
Excel Industries Limited Cash Flow Analysis
Cash is fact, and here the signal is mixed for Excel Industries Limited. Operating cash flow was positive at about ₹53 crore in FY2025-26, comfortably more than three times the ₹17.28 crore dividend outflow. However, OCF has been steadily declining — from ₹72 crore (FY24) to ₹62 crore (FY25) to ₹53 crore (FY26). More importantly, after capital expenditure, free cash flow was negative at about −₹25 crore, versus +₹19 crore a year earlier. This means the FY2025-26 dividend was not funded by current free cash flow; it was supported by the company’s large accumulated reserves and investment income. The capex is building capacity, but it leaves this year’s distribution reliant on the balance sheet.
Excel Industries Limited Balance Sheet Strength
This is Excel Industries Limited’s strongest card. As of March 2026 the company held an investment and treasury book of roughly ₹1,126 crore against borrowings of only about ₹8 crore — a net-cash position of around ₹1,118 crore, far larger than its own market capitalisation of ₹1,052 crore. Reserves stood near ₹1,697 crore and the company is effectively debt-free. Against this, the ₹17.28 crore dividend is trivial — covered about 65 times by liquid investments alone. The flip side is capital efficiency: this cash hoard earns treasury returns rather than high operating returns, which is one reason ROE sits near 4.6%. A fortress balance sheet protects the dividend but dilutes return ratios.
Excel Industries Limited Dividend Sustainability
On a four-test framework, the FY2025-26 dividend of Excel Industries Limited scores well overall. Earnings coverage is strong (EPS covers the dividend 4.3 times). Operating-cash coverage passes (OCF ₹53 Cr is ~3x the outflow). Liquidity coverage is exceptional (net cash ~₹1,118 Cr). The single failing test is free-cash-flow coverage, which was negative this year due to capex. Weighing a modest 23% payout and a near-impregnable balance sheet against declining OCF and negative FCF, the dividend is best classified as Sustainable in the near term — with the clear caveat that it is currently reserve-supported, not FCF-funded.
Sustainability Verdict
Sustainable (FCF caveat)
3 of 4 coverage tests passed; FCF negative in FY26
Excel Industries Limited Peer Comparison
| Company | Div Yield | ROE | P/E |
|---|---|---|---|
| Excel Industries | 1.64% | 4.62% | 14.7 |
| BASF India | 0.60% | 10.61% | 27.9 |
| Atul Ltd | 0.44% | 10.89% | 25.4 |
| Fine Organic | 0.22% | 15.65% | 36.4 |
| Aarti Industries | 0.20% | 7.03% | 33.4 |
| Privi Speciality | 0.27% | 23.18% | 40.9 |
Peer data: Motilal Oswal peer comparison (Aug 2026). Excel yield/ROE/P/E: Screener.in (Oct 2026).
The comparison reveals Excel Industries Limited as an outlier: it offers the highest dividend yield and the lowest P/E in this specialty-chemicals peer set, yet also the weakest ROE. Peers like Privi and Fine Organic reinvest for growth and pay little, trading at rich multiples; Excel distributes more and is priced cheaply, but its returns on capital lag. It screens as a value/income name in a growth-oriented sector.
Excel Industries Limited Promoter Impact Analysis
Promoters of Excel Industries Limited held about 51.86% of the equity as of September 2026. Applied to the ₹17.28 crore outflow, roughly ₹8.96 crore of the dividend flows to the promoter group, with the remaining ₹8.32 crore going to public, FII (1.66%) and DII (7.02%) shareholders. Because the payout is modest and uniform per share, no class of shareholder is advantaged over another on a per-share basis. One governance point worth noting: promoter holding eased from 52.69% to 51.86% during the June 2026 quarter — a small reduction that minority investors may wish to track alongside future filings.
Promoter dividend income
~₹8.96 Cr
at 51.86% holding
Non-promoter share
~₹8.32 Cr
Public + FII + DII (48.14%)
Excel Industries Limited Dividend Taxation Analysis
Since FY2020-21, dividends in India are taxed in the hands of the investor at their applicable income-tax slab rate; the company no longer pays Dividend Distribution Tax. Excel Industries Limited must deduct TDS at 10% under Section 194 where total dividend to a resident shareholder exceeds ₹5,000 in a financial year (20% if PAN is not provided). The TDS is adjustable against final tax liability when filing returns. Worked example for a shareholder in the 30% slab holding 1,000 shares: gross dividend ₹13,750; TDS at 10% = ₹1,375; total tax at 30% = ₹4,125; net in hand ~₹9,625. That translates to a post-tax effective yield of about 1.15% on the current price.
Key Risks for Excel Industries Limited Dividend Investors
- Margin compression: operating margin fell from 12% to 10% in FY26; further cost pressure in chemical intermediates could keep profits under strain.
- Negative free cash flow: FY26 FCF was about −₹25 crore, so the dividend currently leans on reserves rather than fresh cash generation.
- Earnings volatility: the company is a cyclical payer; the FY24 dividend was cut to ₹5.50, showing payouts can fall sharply in weak years.
- Low return ratios: ROE near 4.6% and ROCE near 6.2% are well below sector leaders, reflecting a large low-yielding cash pile.
- Reliance on other income: ~24% of pre-tax profit came from treasury/other income, which can mask weakness in the core business.
- Price weakness: the stock is down about 25% over the past year, pressuring total returns despite the dividend.
What to Monitor in Excel Industries Limited
- Operating margin recovery: watch whether OPM climbs back toward the mid-teens as new biocides and derivatives capacity ramps up.
- Free cash flow turnaround: track whether FCF returns to positive once the current capex cycle completes.
- Operating cash flow trend: OCF has fallen three years running — a reversal would strengthen dividend quality.
- Core vs other income: monitor how much profit comes from operations versus treasury income in upcoming quarters.
- Promoter holding: follow whether the June 2026 dip below 52% continues in later shareholding filings.
- Growth-driver execution: progress in Performance Solutions, YP Derivatives and Contract Manufacturing segments management has highlighted.
Conclusion: Should You Consider Excel Industries Limited for Dividend Income?
Excel Industries Limited’s FY2025-26 final dividend of ₹13.75 is a story of a strong balance sheet carrying a soft operating year. On the positive side: a consistent 10-year payout record, a modest 23% payout ratio, more than 4x earnings coverage and a net-cash buffer of roughly ₹1,118 crore make a near-term cut unlikely. On the negative side: the real yield is only 1.64% (not the 275% headline), profit fell 11%, margins compressed, free cash flow turned negative and return ratios are weak. For income seekers, this is a low-yield, capital-protected name rather than a high-income one. Weigh the fortress balance sheet against the declining earnings and cash flow, and decide based on your own objectives.
Frequently Asked Questions About Excel Industries Limited Dividend
What dividend has Excel Industries announced for FY2025-26?
What is the Excel Industries dividend yield?
What was the record date for the Excel Industries dividend?
What was the ex-dividend date for Excel Industries?
When will the Excel Industries dividend be paid?
Who was eligible for the Excel Industries dividend?
How is the Excel Industries dividend taxed?
Is the Excel Industries dividend sustainable?
What is the Excel Industries dividend history?
What is the total dividend outflow and payout ratio?
How does Excel Industries compare with its peers on yield?
What should investors monitor going forward?
Disclaimer – Excel Industries Limited Dividend Analysis
This article is for informational and educational purposes only and does not constitute investment, legal or tax advice, or any recommendation to buy, sell or hold securities. ShareBazaar Online is not a SEBI-registered investment adviser. Dividend figures, dates and corporate-action details are based on Excel Industries Limited’s own exchange filings; market prices, financial ratios and peer data are drawn from publicly available sources (including Screener.in and Motilal Oswal) and may change. All computed figures are estimates based on disclosed data and should be independently verified. Taxation depends on individual circumstances; consult a qualified professional. Investments in securities are subject to market risks. Readers should do their own research before making any decision.