
Dividend Snapshot – NMDC Limited
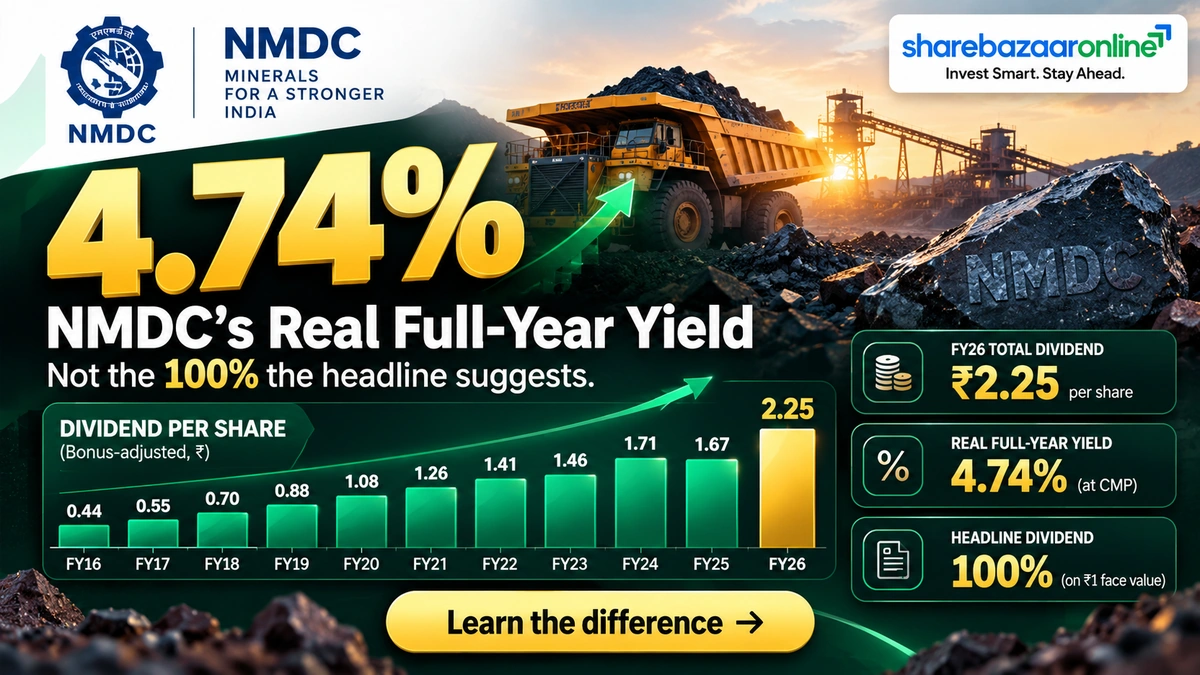
NMDC Limited, India’s largest iron ore producer and a Navratna PSU under the Ministry of Steel, declared a final dividend of ₹1 per equity share for FY2025-26. On the ₹1 face value, that reads as a 100% dividend — but on the real market price near ₹73.77, the final payout alone works out to just 1.36%. Add the ₹2.50 interim already paid and the full-year NMDC dividend of ₹3.50 yields about 4.74%.
Final Dividend (FY2025-26)
₹1.00 / share
100% of ₹1 face value
Full-Year FY26 Dividend Yield
~4.74%
₹3.50 total ÷ CMP ₹73.77
NMDC Limited Company Overview
NMDC Limited (NSE: NMDC, BSE: 526371) is a Navratna Central Public Sector Enterprise and the country’s single-largest iron ore miner, producing high-grade (around 64% Fe) ore from mines in Chhattisgarh and Karnataka, alongside diamonds, pellets and wind power. It operates an asset-light, royalty-and-volume-driven model with large cash reserves and no large debt.
The President of India, through the Ministry of Steel, is the promoter with a 60.79% stake. NMDC reported FY26 consolidated revenue of ₹32,071 crore (up ~34% year on year) and net profit of ₹7,450 crore. Its returns profile is strong — ROE ~23% and ROCE ~28% — which underpins NMDC’s long record as a consistent dividend-paying PSU.
NMDC Limited Financial Snapshot (FY2025-26)
Consolidated FY26 headline numbers: Revenue ₹32,071 cr, operating profit ₹9,260 cr, PAT ₹7,450 cr, EPS ₹8.47. The dividend payout for the full year is a conservative 41.3% of profit.
Valuation and quality: the NMDC share price near ₹73.77 puts the stock on a P/E of roughly 9–10x and P/B of about 2.0x, with a book value near ₹38.7. Borrowings of ₹6,407 cr are comfortably below cash reserves, leaving NMDC net-cash.
Financial figures sourced from Screener.in consolidated statements and exchange disclosures; market price as on 5 October 2026.
NMDC Limited Dividend History Table
NMDC Limited dividend per share by financial year (as paid, ₹1 face value). The 2:1 bonus (ex-date 27 Dec 2024) tripled the share count — the final column restates pre-bonus years on a comparable basis.
| Financial Year | DPS As Paid | Bonus-Adjusted DPS |
|---|---|---|
| FY2017-18 | ₹4.30 | ₹1.43 |
| FY2018-19 | ₹5.52 | ₹1.84 |
| FY2019-20 | ₹5.29 | ₹1.76 |
| FY2020-21 | ₹7.76 | ₹2.59 |
| FY2021-22 | ₹14.74 | ₹4.91 |
| FY2022-23 | ₹6.60 | ₹2.20 |
| FY2023-24 | ₹7.25 | ₹2.42 |
| FY2024-25 | ₹3.30 | ₹3.30 |
| FY2025-26 | ₹3.50 | ₹3.50 |
Expert Commentary on the NMDC Limited Dividend
The single most important thing to understand about this NMDC dividend is the bonus optical illusion. Many trackers show full-year dividend falling from ₹7.25 (FY24) to ₹3.30 (FY25) and call it a cut. It is not. NMDC issued a 2:1 bonus (ex-date 27 December 2024), tripling shares outstanding to 879 crore. On a comparable, bonus-adjusted basis, FY24’s ₹7.25 equals just ₹2.42 — so the FY25 ₹3.30 was actually a ~37% increase, and FY26’s ₹3.50 is higher still. A second signal: FY26 operating cash flow was only 67% of reported profit, worth watching as receivables build.
NMDC Limited Dividend Outlook
NMDC’s dividend direction is tied to iron ore volumes, realisations and its capex cycle rather than to any fixed policy. The company has guided publicly toward scaling production past 40 MTPA, which is lifting capital work-in-progress (CWIP rose to about ₹6,749 cr). Heavier capex competes with cash available for distribution, so future payouts will likely track the commodity cycle. With a net-cash balance sheet, low 41% payout and strong return ratios, NMDC retains headroom to sustain dividends through a normal cycle. The swing factor remains iron ore pricing — NMDC has already trimmed lump and fines prices during 2026, which pressures per-tonne margins.
NMDC Limited Dividend Announcement Summary
The NMDC board recommended the ₹1 per share final dividend for FY2025-26 alongside its Q4 results on 29 May 2026, and it was placed before shareholders at the 68th Annual General Meeting on 28 September 2026 (held via video conferencing). The company fixed Monday, 5 October 2026 as the record date to determine entitlement. Including the ₹2.50 interim already distributed during the year, the total NMDC dividend for FY2025-26 comes to ₹3.50 per share. The dividend was an ordinary-business item requiring member approval at the AGM, consistent with the Companies Act, 2013 and SEBI (LODR) Regulations, 2015.
NMDC Limited Dividend — Key Dates Timeline
Board Recommendation
29 May 2026
AGM (Approval)
28 September 2026
Ex-Date
5 October 2026
Record Date
5 October 2026
Expected Payment
Around 28 October 2026
Financial Year
FY2025-26
Under India’s T+1 settlement the ex-date and record date fall on the same day. Payment date is as indicated by market-data platforms; investors should confirm the credit date with the company/registrar.
NMDC Limited Dividend Yield Analysis
The headline 100% dividend is calculated on the ₹1 face value and tells you nothing about real return. What matters is yield on the market price. At the NMDC share price of about ₹73.77, the ₹1 final dividend yields only 1.36%. The full-year ₹3.50 (interim plus final) yields roughly 4.74%. On the board-recommendation-day price of about ₹88, those figures were 1.14% and 3.98% respectively — so part of today’s higher optical yield simply reflects the share price drifting lower in 2026, not a bigger dividend. Read on a full-year basis, NMDC’s yield is respectable for a large-cap PSU but well below ultra-high-yield metal peers.
NMDC Limited Dividend History Analysis
On a bonus-adjusted basis NMDC is best described as a consistent but cyclical payer. Distributions tracked the commodity cycle — peaking at an adjusted ₹4.91 in the FY22 super-cycle, easing to ₹2.20 in FY23, then recovering to ₹2.42 (FY24), ₹3.30 (FY25) and ₹3.50 (FY26). There has been no year of zero dividend in the last decade and no outright suspension. The key takeaway is that the apparent “cut” after FY24 is purely the 2:1 bonus effect; adjusted for it, NMDC’s per-share dividend has actually been rising for three straight years.
NMDC Limited Financial Performance Analysis
FY26 showed a classic operating-leverage squeeze. Revenue jumped ~34% (to ₹32,071 cr) but operating profit rose only ~14% (to ₹9,260 cr), and the operating margin compressed from 34% to 29%, a 5-percentage-point fall. In other words, NMDC sold and shipped much more ore but kept less of each rupee as profit — a sign of weaker realisations and higher input/royalty costs rather than demand weakness. Net profit still grew about 14% to ₹7,450 cr, aided by volume. The profit base remains strong, but the margin trend is the number dividend investors should track, because thinner margins eventually limit distributable cash.
NMDC Limited Cash Flow Analysis
Reported profit was ₹7,450 cr, but operating cash flow was only ₹4,996 cr — a cash conversion of just 67%. The gap reflects a working-capital build, with debtor days stretching toward 105–118 days as receivables grew faster than sales. After capex, free cash flow was ₹1,826 cr. That is the crucial number: FY26 free cash flow covered the ₹879 cr final dividend 2.1x, but covered the full-year ₹3,077 cr payout only 0.59x. So the complete FY26 dividend was not fully funded by current-year free cash — the shortfall was met from NMDC’s large cash reserves, not from borrowing.
NMDC Limited Balance Sheet Strength
NMDC remains a net-cash company. Cash and bank balances of roughly ₹10,031 cr exceed total borrowings of ₹6,407 cr, leaving net cash of about ₹3,624 cr. Reserves stood near ₹33,183 cr and debt-to-equity is low at around 0.1–0.2x.
This cushion is why the dividend is comfortably affordable despite the FCF shortfall: cash reserves cover the full-year payout about 3.3x. The watch item is that rising capex and receivables are gradually absorbing this liquidity, so the cash buffer should be tracked over coming quarters.
Cash & bank balance per secondary data sources (latest available); borrowings and reserves per Screener.in consolidated balance sheet (Mar 2026).
NMDC Limited Dividend Sustainability Analysis
Applying four coverage tests to the NMDC dividend:
- Earnings coverage: EPS ₹8.47 covers the ₹3.50 total dividend 2.42x — comfortable.
- Operating cash coverage: OCF covers the full payout 1.62x — adequate.
- Free cash coverage: FCF covers the full payout only 0.59x — the weak link.
- Liquidity coverage: cash reserves cover the payout 3.3x — strong.
On balance, the NMDC dividend is assessed as Sustainable — backed by strong earnings and a net-cash balance sheet — but with a clear caveat that current-year free cash flow did not fully fund the complete FY26 payout.
NMDC Limited Peer Comparison
NMDC Limited versus other large metals & mining dividend payers (indicative, latest available).
| Company | Div Yield | Payout | ROE | D/E |
|---|---|---|---|---|
| NMDC | ~4.7% (FY26 total) | ~41% | ~23% | ~0.1x |
| Coal India | ~5–7% | ~42–53% | ~49% | ~0.1x |
| Vedanta | ~10%+ | >100% | ~37% | ~2.0x |
| Hindustan Zinc | ~8%+ | >100% | ~70%+ | ~0.9x |
| SAIL | ~2% | cyclical | ~8% | ~0.8x |
NMDC offers a lower headline yield than Vedanta or Hindustan Zinc, but it is the only one on this list combining a sub-45% payout with a net-cash balance sheet — so its dividend has more headroom and is less reliant on leverage than the ultra-high-yield names.
NMDC Limited Promoter Impact Analysis
With the Government of India holding 60.79% of NMDC, most of the dividend flows to the sovereign promoter. Of the ₹879 cr final-dividend outflow, roughly ₹534 cr accrues to the Centre; across the full FY26 payout of ₹3,077 cr, the government’s share is about ₹1,871 cr. Minority (public) shareholders — including FIIs at 13.60%, DIIs at about 13.77% and retail at 11.84% — collectively receive the remaining ~₹1,207 cr. This is a common PSU dynamic: generous dividends partly serve the government’s own fiscal needs, but minority holders benefit pro-rata on identical per-share terms.
NMDC Limited Dividend Taxation Analysis
Since FY2020-21, dividends are taxed in the shareholder’s own hands at their income-tax slab rate as “income from other sources” — there is no separate dividend distribution tax. Under Section 194, the company deducts TDS at 10% (where PAN is provided) only if total dividend from the company exceeds ₹10,000 in a financial year (threshold raised from ₹5,000 by the Finance Act, 2025). For NRIs, TDS applies under Section 195 at 20% plus surcharge/cess, or the lower treaty rate.
Worked example (final ₹1 dividend): an investor holding 15,000 shares receives a gross dividend of ₹15,000. As it crosses the ₹10,000 threshold, ₹1,500 TDS is deducted (net credit ₹13,500). At a 30% slab, total tax is ₹4,500, leaving ₹10,500 after tax. A smaller holder of 5,000 shares gets ₹5,000 with no TDS, but the amount is still taxable at slab.
Key Risks for NMDC Limited Investors
- Iron ore price cyclicality: earnings and dividends swing with ore realisations; NMDC cut Baila lump/fines prices during 2026.
- Margin compression: FY26 operating margin fell from 34% to 29% despite higher volumes.
- Cash conversion gap: OCF was only 67% of profit as receivables (debtor days ~105–118) rose.
- Capex intensity: CWIP climbed to ~₹6,749 cr, competing with cash available for dividends.
- Government/PSU overhang: as a 60.79% state-owned entity, pricing, offers-for-sale and policy decisions can be shaped by non-commercial objectives.
What to Monitor in NMDC Limited
- Monthly production & sales: NMDC reports these; weak sales (as in September 2026) move the stock quickly.
- Iron ore price revisions: each lump/fines price change directly affects per-tonne margins.
- Operating margin trend: whether the 29% margin stabilises or erodes further.
- Free cash flow & receivables: recovery in FCF and normalisation of debtor days.
- Capex execution: the 40-MTPA expansion and how it is funded relative to dividends.
Conclusion – NMDC Limited Final Dividend FY2025-26
NMDC’s ₹1 final dividend takes its FY2025-26 payout to ₹3.50 per share, a full-year yield near 4.74% on the current price. The positives are clear: a net-cash balance sheet, a conservative ~41% payout, strong ROE/ROCE, and — once the 2:1 bonus is adjusted for — a per-share dividend that has risen three years running. The negatives to weigh are margin compression, a soft 67% cash conversion, and a full-year payout not fully covered by current free cash flow. For income-focused investors, NMDC is a cyclical PSU dividend play whose attractiveness hinges on the iron ore cycle. The facts are laid out here — the decision is yours.
Frequently Asked Questions About the NMDC Limited Dividend
What dividend has NMDC Limited announced for FY2025-26?
What is the NMDC dividend yield?
What was the NMDC dividend record date?
What was the NMDC ex-dividend date?
When will the NMDC dividend be paid?
Who was eligible for the NMDC dividend?
How is the NMDC dividend taxed?
Is the NMDC dividend sustainable?
Did NMDC cut its dividend after FY2023-24?
What is NMDC’s dividend history like?
How much of the NMDC dividend goes to the government?
What should NMDC dividend investors monitor?
What is NMDC’s dividend payout ratio?
Disclaimer – NMDC Limited Dividend Analysis
This article is for informational and educational purposes only and does not constitute investment, legal or tax advice, nor a recommendation to buy, sell or hold any security. ShareBazaar Online is not a SEBI-registered investment adviser. Disclosed facts (dividend amount, record date, AGM) are drawn from NMDC’s exchange filings; financial and market figures are sourced from public providers such as Screener.in and broker platforms and may contain errors or be time-sensitive — the NMDC share price in particular changes continuously and should be re-verified before any decision. Dividend taxation depends on individual circumstances; consult a qualified professional. Investments in securities are subject to market risks. Please read all related documents carefully before investing.