
Dividend Snapshot – Vedanta Limited
Vedanta Limited has declared its first interim dividend for FY2026-27 of ₹5 per equity share on a face value of ₹1. This is the company's first dividend since its demerger into separate listed entities, making it a closely watched payout. The headline figure reads as a 500% dividend — but that percentage is calculated on the tiny ₹1 face value, not the market price. Measured against Vedanta's actual traded price of around ₹256 on the announcement date, the real yield from this single tranche is only about 1.95%. The record date is 14 October 2026, and the total outflow is approximately ₹1,955 crore.
Key Figures
- Dividend Per Share: ₹5.00
- Dividend Type: First Interim (FY2026-27)
- Face Value: ₹1.00
- Record Date: 14 October 2026
- Announcement Date: 08 October 2026
- Total Outflow: ₹1,955 crore (approx.)
The Real Yield
- Headline (on face value): 500%
- Real yield (this tranche): ~1.95%
- Reference price: ~₹256 (NSE/BSE, 08 Oct 2026)
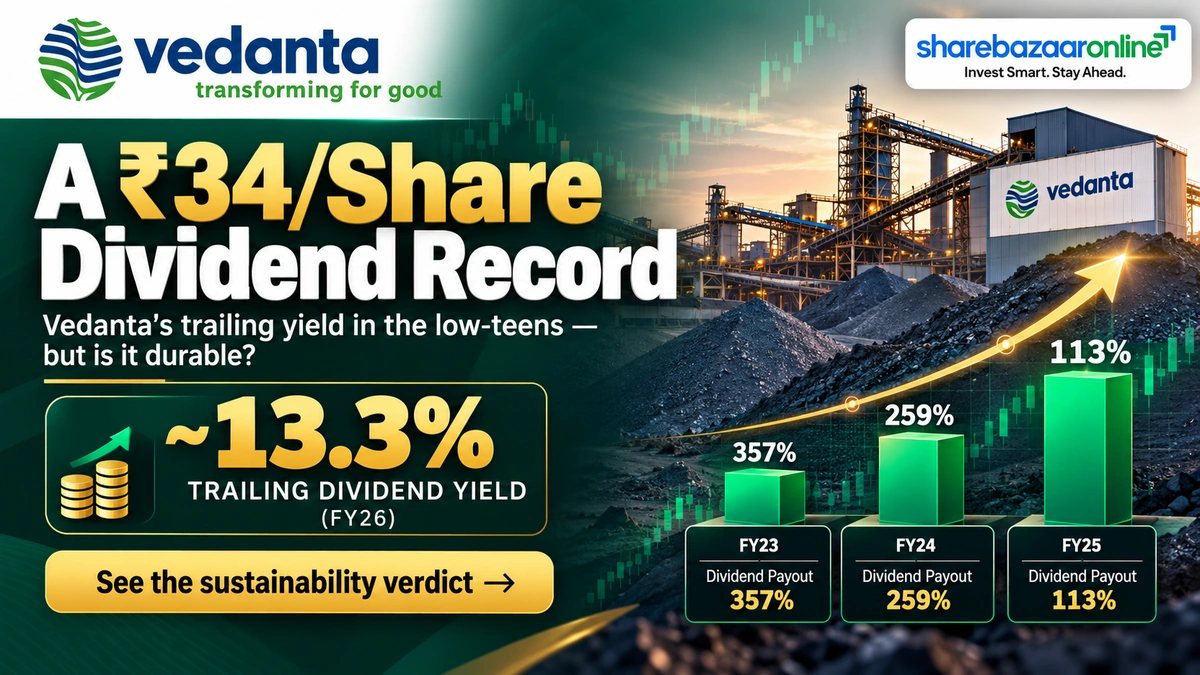
- FY26 trailing yield: ~13.3% (₹34 total FY26 DPS)
- NSE: VEDL | BSE: 500295
- ISIN: INE205A01025
Company Overview – Vedanta Limited
Vedanta Limited is one of India's largest diversified natural-resources companies, with operations spanning zinc, aluminium, oil & gas, copper, iron ore and power. It is the Indian flagship of the Anil Agarwal-promoted Vedanta group. In FY2024-25, Vedanta reported consolidated revenue of about ₹1,52,968 crore and consolidated net profit of roughly ₹20,535 crore (Source: Screener.in). The company is known among retail investors primarily as a high dividend-paying stock — it has distributed large interim dividends through the year rather than a single annual payout. In 2025-26 the group undertook a major demerger into separate listed businesses to unlock value, and this ₹5 interim dividend is the first declared after that restructuring.
Vedanta Limited Financial Analysis
Vedanta's FY2024-25 financials show a sharp recovery. Consolidated PAT rose to ₹20,535 crore from ₹7,539 crore in FY24, with EPS of ₹38.33 (Source: Screener.in). Operating profit (EBITDA) was about ₹42,343 crore at a 28% margin. Return ratios are strong on paper — ROCE 25.3% and ROE 38.5%. The weak spot is leverage: consolidated borrowings stood near ₹91,479 crore against investments of only about ₹14,532 crore. So the dividend story is a tension between genuinely strong cash generation and a heavily indebted balance sheet. The ₹1,955 crore payout is small relative to earnings, but it sits inside a group that still carries significant debt obligations.
Vedanta Limited Dividend History
Dividend Payout Ratio (Consolidated)
| Financial Year | Net Profit (₹ Cr) | EPS (₹) | Dividend Payout % |
|---|---|---|---|
| FY2020-21 | 15,032 | 31.21 | 30% |
| FY2021-22 | 23,710 | 50.58 | 89% |
| FY2022-23 | 14,503 | 28.45 | 357% |
| FY2023-24 | 7,539 | 11.40 | 259% |
| FY2024-25 | 20,535 | 38.33 | 113% |
| FY2025-26 (DPS) | ₹34 per share total (interim) | 95% (standalone) | |
Source: Screener.in (consolidated payout %); FY26 total DPS from market reporting. Figures rounded.
Expert Commentary on Vedanta Limited Dividend
The most important thing a retail investor should understand about the Vedanta dividend is the gap between the headline and reality. A ₹5 dividend on a ₹1 face value gets reported as "500%," which sounds enormous. On the actual market price of around ₹256, the yield from this tranche is a modest ~1.95%. A second trap is stale pricing: some data pages still show Vedanta near ₹526, a level that does not reflect the post-demerger share structure — using it would halve the true yield. The more meaningful number is Vedanta's trailing dividend record: ₹34 per share was paid across FY26, which on today's price is a trailing yield in the low-teens. That is high — and the analysis below examines whether it is durable.
Vedanta Limited Dividend Outlook & Future View
Vedanta's future dividend capacity now depends on a changed structure. Following the demerger into separate listed entities, the cash flows that funded past mega-payouts are being split across businesses. The company has disclosed only this ₹5 interim dividend; it has not disclosed any forward dividend guidance. Historically, a key driver of Vedanta's generous distributions has been the funding needs of its parent, Vedanta Resources, which relies on upstreamed dividends to service its own debt. Commodity prices (zinc, aluminium, crude) remain the single biggest swing factor for earnings and therefore payouts. With no management forward commentary available, investors should treat the FY27 dividend trajectory as Not Disclosed by Company and watch quarterly results and commodity cycles instead.
Vedanta Limited Dividend Announcement Summary
On 08 October 2026, the Board of Directors of Vedanta Limited approved the First Interim Dividend for FY2026-27 of ₹5 per equity share (face value ₹1), as intimated to BSE and NSE under Regulation 30 of SEBI (LODR) Regulations, 2015. The approval was accorded at 1:00 PM IST. The total payout is approximately ₹1,955 crore. As an interim dividend, it is declared by the Board and does not require separate shareholder (AGM) approval before payment. The company confirmed the record date as 14 October 2026 and stated the dividend will be paid within the timelines prescribed under law. No special or final dividend was part of this announcement.
Vedanta Limited Key Dates Timeline
| Event | Date | Status |
|---|---|---|
| Board Approval / Announcement | 08 October 2026 | Disclosed |
| Ex-Dividend Date | 14 October 2026 (inferred) | Verify with exchange circular |
| Record Date | 14 October 2026 | Disclosed |
| Payment Date | Within statutory timeline | Not Disclosed by Company |
Under India's T+1 settlement, the ex-date for an equity dividend typically falls on the same day as (or one trading day before) the record date. The ex-date shown is inferred and should be confirmed against the official NSE/BSE corporate-action circular.
Vedanta Limited Dividend Yield Analysis
This Interim Dividend
- Face-value headline: 500%
- Yield @ ₹256: 1.95%
- Yield @ ₹255–264 band: 1.89%–1.96%
Trailing (FY26) Context
- FY26 total DPS: ₹34
- Trailing yield @ ₹256: ~13.3%
- Screener (stale ₹526 base): 8.27% — understated
The Vedanta dividend yield must be read in two layers. This single ₹5 interim offers only ~1.95% — a reminder that the "500%" headline is a face-value artefact. The larger story is the trailing yield built from ₹34 per share across FY26, which lands in the low-teens on the current price. That is genuinely high for a large-cap, but it reflects both strong distributions and a share price that is far below pre-demerger levels.
Vedanta Limited Dividend History Analysis
Vedanta is best classified as a consistent but cyclical high payer. It has paid dividends regularly — often multiple interims per year — but the amounts swing sharply with commodity cycles. In FY26 the company paid about ₹34 per share across tranches; in the prior year it paid even larger interims (including a ₹20 interim). The payout ratio has repeatedly exceeded 100% — 357% in FY23, 259% in FY24 and 113% in FY25 — meaning Vedanta has often distributed more than it earned in a given year, drawing on reserves and strong operating cash flow. There have been no dividend suspensions in recent years, but the variability means past per-share amounts are not a reliable guide to future payouts.
Vedanta Limited Financial Performance Analysis
Looking at operating leverage across FY24 to FY25: revenue rose modestly from ₹1,43,727 crore to ₹1,52,968 crore (about +6.4%), but net profit jumped from ₹7,539 crore to ₹20,535 crore — a near-tripling. The swing came from margin recovery: EBITDA margin improved from 25% to 28%, helped by firmer commodity prices and lower input costs. EPS more than tripled from ₹11.40 to ₹38.33. This is classic commodity-cycle operating leverage — small revenue moves produce large profit swings in both directions. The same mechanism that lifted FY25 profits can compress them quickly if zinc, aluminium or crude prices fall, which is why the dividend stream is inherently cyclical.
Vedanta Limited Cash Flow Analysis
Here the news is reassuring. Reported profits can be opinions — cash is fact — and Vedanta's cash generation is strong. FY25 operating cash flow was ₹39,562 crore against PAT of ₹20,535 crore, an OCF/PAT ratio of 1.93x. That means earnings are backed by real cash, not just accounting entries. This ₹1,955 crore interim outflow is only about 4.9% of one year's operating cash flow — comfortably covered. The caveat is where the cash goes after operations: financing outflows (debt repayment and dividends) have consistently absorbed the bulk of it, with financing cash flow of around -₹19,223 crore in FY25. So the dividend is funded by current cash generation, but it competes directly with heavy debt servicing.
Vedanta Limited Balance Sheet Strength
This is Vedanta's weak dimension. Consolidated borrowings were about ₹91,479 crore in FY25 against investments of only ₹14,532 crore — gross debt is roughly 6.3x liquid investments. Reserves have fallen from ₹61,906 crore (FY21) to ₹40,821 crore (FY25), partly reflecting years of above-100% payouts that drew down retained earnings. Book value per share is around ₹103. The high-payout policy, combined with falling reserves and elevated debt, is the core structural risk for dividend investors. Strong operating cash flow currently bridges the gap, but there is limited balance-sheet cushion if the commodity cycle turns. Post-demerger debt allocation across the new entities is Not Disclosed by Company at the consolidated level here.
Vedanta Limited Dividend Sustainability Analysis
Four-Test Scorecard
| Test | Reading | Verdict |
|---|---|---|
| Earnings coverage | Payout >100% in 3 of last 4 years | Weak |
| OCF coverage | OCF 1.93x PAT; outflow 4.9% of OCF | Strong |
| Liquidity / debt | Debt 6.3x investments; reserves falling | Weak |
| Earnings trend | FY25 recovery, but cyclical | Mixed |
Overall verdict: Conditionally Sustainable. This specific ₹1,955 crore interim is easily affordable from cash flow. But the pace of Vedanta's historic mega-payouts leans on strong commodity prices and competes with heavy debt — so sustainability is conditional on the cycle, not guaranteed.
Vedanta Limited Peer Comparison
| Company | Dividend Profile | ROE |
|---|---|---|
| Vedanta Ltd | Very high, cyclical; payout often >100% | 38.5% |
| Hindustan Zinc | High yield; also heavy payer | Not Disclosed |
| Coal India | Consistent high-yield PSU payer | Not Disclosed |
| NMDC / NALCO | Cyclical metals/mining payers | Not Disclosed |
Among Indian high-dividend resource plays, Vedanta sits at the aggressive end — it pays out more of its earnings than most peers, often exceeding 100%. Vedanta's reported ROE of 38.5% is high, but it is amplified by leverage. Peer-specific yield and payout figures beyond Vedanta are Not Disclosed by Company in this filing and vary with price; readers should compare current live figures before drawing conclusions.
Vedanta Limited Promoter Impact Analysis
Promoter holding in Vedanta was about 54.72% as of the June 2026 quarter (Source: Trendlyne). Applying that to the ₹1,955 crore payout, the promoter group receives roughly ₹1,070 crore, while minority/public shareholders (about 45.28%) receive around ₹885 crore. This matters because Vedanta's generous dividend policy is widely understood to be shaped by the funding needs of the overseas parent, Vedanta Resources, which uses upstreamed dividends to service its own borrowings. The practical takeaway for minority investors: the dividend is real cash in hand, but the policy is partly driven by promoter-level obligations rather than purely by returning surplus to all shareholders. Note: pledge data varies by source — Trendlyne shows 0% pledged in the latest quarter; verify against the current shareholding filing.
Vedanta Limited Dividend Taxation Analysis
Since April 2020, dividends are taxable in the hands of the investor at their applicable income-tax slab rate (the company no longer pays Dividend Distribution Tax). The company deducts TDS under Section 194 at 10% if a resident shareholder's total dividend from that company in a financial year exceeds ₹5,000 (20% if PAN is not provided).
Worked Example – 1,000 Shares
- Gross dividend: 1,000 × ₹5 = ₹5,000
- TDS u/s 194: this interim alone is at the ₹5,000 threshold — TDS applies once the yearly total from Vedanta exceeds ₹5,000 (likely, given multiple interims)
- Tax at 30% slab: ₹1,500
- Net in hand: ₹3,500
- Post-tax yield @ ₹256: ~1.37%
This is a general illustration, not tax advice. Actual tax depends on your total income, residency status and PAN/declaration. TDS is adjustable against final liability.
Vedanta Limited Key Risks
- Commodity-price dependence: Earnings and payouts swing with zinc, aluminium, crude and copper prices — a downturn can compress dividends quickly.
- High leverage: Consolidated borrowings near ₹91,479 crore (FY25) mean debt servicing competes with dividends for cash.
- Above-100% payout history: Paying more than annual earnings (357% FY23, 259% FY24) has drawn down reserves from ₹61,906 Cr to ₹40,821 Cr.
- Parent-level funding needs: Dividend policy is influenced by Vedanta Resources' own debt obligations, not purely surplus distribution.
- Demerger uncertainty: Post-restructuring, future consolidated cash flows and debt allocation across new entities are not yet clearly disclosed.
What To Monitor in Vedanta Limited
- Commodity prices: Zinc, aluminium and crude trends — the primary driver of future dividend capacity.
- Net debt trajectory: Whether consolidated and parent-level debt rises or falls after the demerger.
- Quarterly operating cash flow: The real backstop for dividends — watch if OCF/PAT stays above 1x.
- Payout ratio normalisation: Whether payouts move back below 100% of earnings post-demerger.
- Demerger entity structure: How dividends will flow from the new separately listed businesses.
Should You Consider Vedanta Limited for Dividend Income? – Conclusion
Vedanta's ₹5 first interim dividend for FY2026-27 is a real cash payout of ~₹1,955 crore, easily covered by operating cash flow. On the positive side: strong FY25 earnings recovery, robust OCF (1.93x PAT), a consistent high-dividend record, and a genuinely high trailing yield on the post-demerger price. On the negative side: a history of paying out more than it earns, falling reserves, heavy debt (6.3x investments), and a policy influenced by promoter/parent funding needs. The "500%" headline is misleading — the real yield on this tranche is ~1.95%. Vedanta remains one of India's most-watched high-yield resource stocks, but its dividends are cyclical and condition-dependent, not guaranteed. This is analysis, not a recommendation — weigh the positives and risks against your own goals.
Frequently Asked Questions About Vedanta Limited Dividend
What dividend has Vedanta Limited announced?
What is the Vedanta dividend yield?
What is the record date for the Vedanta dividend?
What is the ex-dividend date for Vedanta?
When will Vedanta pay the dividend?
Who is eligible for the Vedanta dividend?
How is the Vedanta dividend taxed?
Is the Vedanta dividend sustainable?
What is Vedanta's dividend history?
Is this the first dividend after Vedanta's demerger?
How much of the dividend goes to promoters?
What should investors monitor in Vedanta?
Does an interim dividend need AGM approval?
Disclaimer
This article is for informational and educational purposes only and is not investment, legal or tax advice. ShareBazaar Online is not a SEBI-registered investment adviser. It does not constitute a recommendation to buy, sell or hold any security. Dividend figures, dates and the ₹1,955 crore outflow are based on Vedanta Limited's exchange filing dated 08 October 2026; financial metrics are sourced from Screener.in and public market reporting and may contain errors or become outdated. Share prices referenced reflect the announcement window and change continuously. The ex-date is inferred pending the official exchange circular. Taxation examples are illustrative and depend on individual circumstances. Investments in securities are subject to market risks. Please verify all figures independently and consult a qualified financial adviser before making any investment decision.