
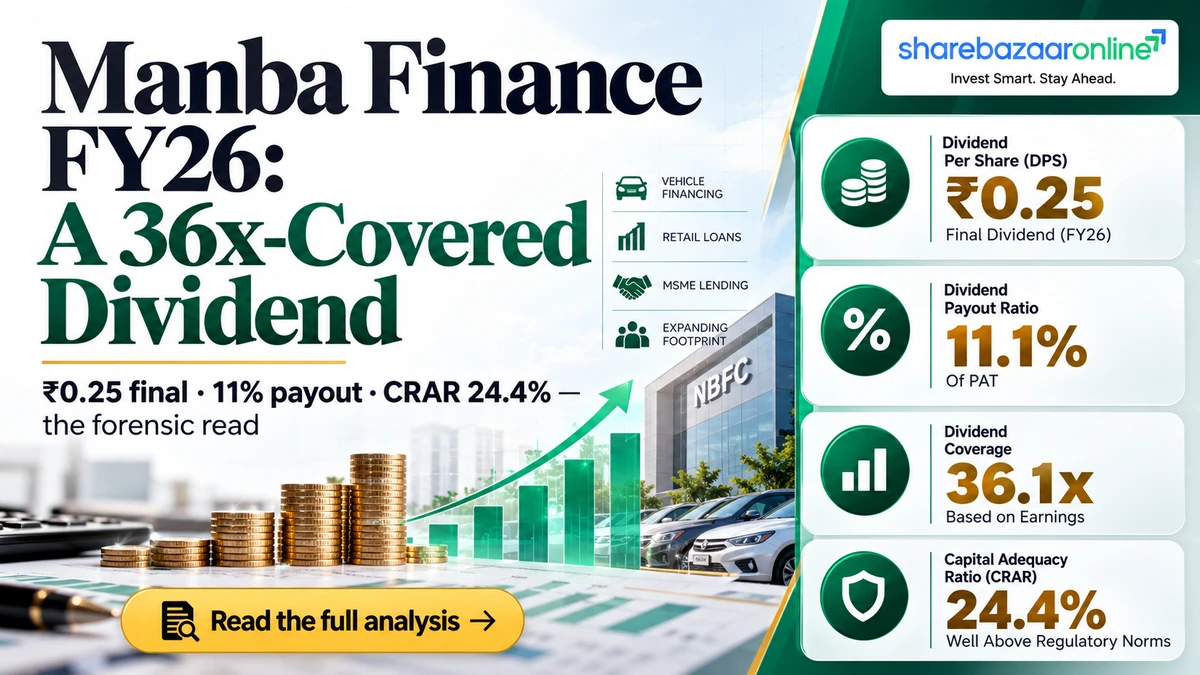
Dividend Snapshot – Manba Finance Limited
Manba Finance Limited (NSE: MANBA, BSE: 544262) has confirmed a final dividend of ₹0.25 per equity share for FY2025-26 on a face value of ₹10, with a record date of 18 September 2026. The headline looks like a 2.5% dividend — but that figure is calculated on face value. Measured against the market price of roughly ₹119, the real yield on the final dividend is just 0.21%. Across all of FY2025-26, Manba Finance paid ₹1.00 per share (10% of face value), which is still only about 0.84% on the market price. This is a small, growth-stage NBFC payout, not an income play.
| Final Dividend (FY26) | ₹0.25 / share (2.5%) |
| Total FY26 Dividend | ₹1.00 / share (10%) |
| Face Value | ₹10 |
| Record Date | 18 Sep 2026 |
| Real Yield (final, on CMP) | 0.21% |
| Real Yield (FY26 total) | 0.84% |
| Dividend Payout (FY26) | 11.1% of PAT |
| Earnings Cover (final) | 36.1x |
Market price is an approximate NSE quote (early October 2026); verify the live price before acting. Yields are computed by ShareBazaar Online.
Manba Finance Limited — Company Overview
Manba Finance Limited is an RBI-registered, non-deposit-taking NBFC founded in 1996 and headquartered in Mulund, Mumbai. It began as a two-wheeler loan sourcing agent and now runs its own book across new two-wheeler, three-wheeler, used-car, small-business and personal loans. The company listed on the exchanges in September 2024.
Manba Finance operates through a dealer-led model spanning roughly 71 locations and around 1,100+ dealers across Maharashtra, Gujarat, Rajasthan, Madhya Pradesh, Uttar Pradesh and Chhattisgarh, with two-wheelers forming the bulk of its assets under management (AUM). AUM crossed ₹1,730 crore in Q1 FY27. As a lender, its business is to borrow and on-lend — a structure that shapes how its dividends should be read, as explained in the cash-flow section below.
Manba Finance Limited Financial Analysis
| FY26 Net Profit (PAT) | ₹45.36 cr |
| FY26 Revenue (interest income) | ₹313.46 cr |
| EPS (FY26) | ₹9.03 |
| Market Cap | ~₹600 cr |
| P/E (on CMP) | ~13.2x |
| P/B (on CMP) | ~1.4x |
| ROE (FY26, computed) | ~11.6% |
| Capital Adequacy (CRAR) | 24.40% |
Manba Finance screens as a fast-growing but still under-leveraged lender. ROE of roughly 11.6% is modest for an NBFC, largely because fresh IPO capital is yet to be fully deployed — the same reason its CRAR sits at a very comfortable 24.40%, far above the 15% regulatory floor. That surplus capital is what makes the small dividend affordable. P/E, P/B, ROE computed by ShareBazaar Online; CRAR as reported by the company for Q1 FY27.
Manba Finance Limited Dividend History
| Financial Year | Type | ₹ / Share | % of FV | Record / Ex Date |
|---|---|---|---|---|
| FY2026-27 | 1st Interim | 0.25 | 2.5% | 7 Aug 2026 |
| FY2025-26 | Final | 0.25 | 2.5% | 18 Sep 2026 |
| FY2025-26 | 2nd Interim | 0.25 | 2.5% | 6 Feb 2026 |
| FY2025-26 | 1st Interim | 0.50 | 5.0% | 21 Nov 2025 |
| FY2024-25 | Final | 0.25 | 2.5% | 12 Sep 2025 |
| FY2024-25 | Interim | 0.25 | 2.5% | 5 Feb 2025 |
Dividend history for Manba Finance Limited compiled by ShareBazaar Online from exchange disclosures and public dividend records. FY26 total = ₹1.00/share; FY25 total = ₹0.50/share.
Expert Commentary on the Manba Finance Dividend
The most important thing to understand about the Manba Finance dividend is that the “10% for FY26” label is a face-value artefact. Ten percent of a ₹10 face value is ₹1.00 — but an investor buying at the market price earns only about 0.84%. For a final dividend of ₹0.25, the real return is a token 0.21%.
The second point is intent. Manba Finance is a lender growing its loan book over 20% a year. It is deliberately retaining capital, paying out only about 11% of profit. That is not a weakness — it is a conscious choice to fund growth. The dividend is best read as a small shareholder-goodwill gesture layered on top of a capital-compounding story, not as a reason to own the stock for income.
Manba Finance Limited Dividend Outlook
On disclosed information, Manba Finance has moved from ₹0.50 per share in FY25 to ₹1.00 per share in FY26 — a doubling, though off a tiny base. Whether this cadence continues depends on how quickly the company deploys its surplus capital into the loan book and on profit growth. The company has not disclosed any formal dividend policy or future payout guidance, so forward figures cannot be stated as fact.
One forward signal does matter: Manba Finance has called an EGM for 19 October 2026 to approve a ₹99.99 crore preferential equity issue (up to ~50 lakh shares at ₹135). Fresh equity raises the share base over which future dividends are spread and could nudge the already-low per-share payout lower unless profits scale faster. This is disclosed information, not a prediction of outcome.
Manba Finance Limited Dividend Announcement Summary
Manba Finance Limited’s Board recommended a final dividend of ₹0.25 per equity share of ₹10 face value for FY2025-26 alongside its audited results on 18 May 2026. In a filing to NSE and BSE dated 31 August 2026, the company fixed Friday, 18 September 2026 as the record date to determine members entitled to the final dividend, “if any.”
The dividend was subsequently approved by shareholders at the 30th Annual General Meeting held on 26 September 2026, where the resolution passed with the requisite majority. Because a final dividend requires AGM approval under the Companies Act, the record-date notice carried the standard “if any” qualifier until that approval was obtained. The paid-up equity capital stood at ₹50.24 crore, implying roughly 5.02 crore shares outstanding.
Manba Finance Limited Key Dates Timeline
| Event | Date | Source / Status |
|---|---|---|
| Board Recommendation | 18 May 2026 | Disclosed |
| Record-Date Intimation | 31 Aug 2026 | Disclosed |
| Ex-Date | 17–18 Sep 2026 | Inferred (T+1) |
| Record Date | 18 Sep 2026 | Disclosed |
| AGM Approval | 26 Sep 2026 | Disclosed |
| Payment (statutory window) | By ~26 Oct 2026 | Not disclosed in filing |
Under India’s T+1 settlement the ex-date typically coincides with (or falls one trading day before) the record date; confirm against the official NSE/BSE corporate-action circular. A final dividend is statutorily payable within 30 days of AGM declaration; the payment date was not stated in the record-date filing.
Manba Finance Limited Dividend Yield Analysis
This is where Manba Finance investors are most often misled. The dividend percentages quoted by the company (2.5% final, 10% for the full year) are percentages of the ₹10 face value — not of the price you actually pay.
“Headline” (on face value)
10.0%
₹1.00 on ₹10 FV (full FY26)
Real market yield (on ~₹119)
0.84%
0.21% for the ₹0.25 final alone
Why is the yield so low? Not because the price collapsed or the business is weak — Manba Finance grew profit 20% in FY26. The low yield simply reflects a deliberately small payout from a company reinvesting in growth. A ₹1 lakh investment in Manba Finance would have earned roughly ₹840 of dividends across FY26.
Manba Finance Limited Dividend History Analysis
Manba Finance has a short but consistent dividend record. It began paying after its September 2024 listing and has distributed in every half-year since: ₹0.50 total in FY25 and ₹1.00 total in FY26, with a first interim of ₹0.25 already paid in FY27. There have been no dividend cuts, no suspensions and no special dividends to date.
On ShareBazaar Online’s classification, this makes Manba Finance an emerging, consistent payer rather than a proven one — the track record is real but only two full years long. The growth trend (a doubling of the full-year payout) is encouraging, yet investors should weigh it against the very small absolute amounts and the pending equity dilution. No bonus or stock split has occurred, so no per-share restatement of this history is required.
Manba Finance Limited Financial Performance Analysis
| Metric (Standalone) | FY24 | FY25 | FY26 |
|---|---|---|---|
| Revenue / Interest Income (₹ cr) | 168.4 | 237.8 | 313.5 |
| Net Profit / PAT (₹ cr) | 31.2 | 37.8 | 45.4 |
| AUM (₹ cr) | — | ~1,400 | ~1,713 |
Manba Finance grew revenue 31.8% and PAT 20% in FY26, extending a four-year profit CAGR of roughly 47%. The one nuance: PAT growth (20%) trailed revenue growth (32%) because interest/finance costs rose ~47% year-on-year to ₹151.9 crore as the company scaled borrowings, and the Q4 tax rate spiked to 34.3%. This is classic NBFC operating leverage — the spread, not just the top line, drives profit. Figures per company results via public financial databases.
Manba Finance Limited Cash Flow Analysis
For most companies, a negative operating cash flow would be a red flag against a dividend. For an NBFC like Manba Finance, it usually is not. A lender’s biggest “operating” outflow is fresh loan disbursement — so in any fast-growing year, reported operating cash flow is typically negative by design, not because of stress.
That means the standard “free cash flow coverage” test is the wrong tool here. Manba Finance’s ₹5.0 crore full-year dividend is not funded from surplus operating cash; it is paid from accounting profit and capital reserves, topped up by fresh borrowings and equity that fund the loan book. The right questions for an NBFC dividend are earnings cover and capital adequacy — both of which (36x cover on the final dividend; 24.4% CRAR) are comfortably strong. Exact FY26 operating cash flow figure: Not Disclosed in the record-date filing.
Manba Finance Limited Balance Sheet Strength
| Net Worth (Q1 FY27) | ~₹423 cr |
| Book Value / Share (computed) | ~₹84 |
| CRAR | 24.40% |
| Gross NPA (Q1 FY27) | 3.41% |
| Net NPA (Q1 FY27) | 2.52% |
| FY26 Dividend Outflow | ₹5.02 cr |
The balance sheet comfortably supports the dividend. A CRAR of 24.40% is almost ten percentage points above the 15% minimum for NBFCs, and a ₹5 crore annual payout is trivial against ~₹423 crore of net worth. The watch-item is asset quality: Gross NPA of 3.41% and Net NPA of 2.52% are typical for a used-vehicle and two-wheeler lender but should be monitored as the book grows. NPA and CRAR as reported; book value computed by ShareBazaar Online.
Manba Finance Limited Dividend Sustainability
Earnings Coverage
36.1x (final) / 9.0x (FY26)
EPS ₹9.03 vs DPS
Payout Ratio
11.1% of PAT
Very conservative
Capital Adequacy
CRAR 24.4%
The NBFC capacity test
Earnings Trend
Rising (PAT +20%)
4-yr CAGR ~47%
On ShareBazaar Online’s four-test framework — earnings cover, payout discipline, capital adequacy and earnings trend — the Manba Finance dividend screens as Sustainable. The genuine question is not whether the payout can be maintained (it easily can), but whether such a tiny distribution is meaningful to shareholders at all.
Manba Finance Limited Peer Comparison
| NBFC | Dividend Yield | P/E | P/B |
|---|---|---|---|
| Manba Finance | ~0.21% | ~13.2x | ~1.4x |
| Bajaj Finance | ~0.69% | ~32x | ~6.3x |
| Shriram Finance | ~0.97% | ~21x | ~2.2x |
| Cholamandalam Inv. | ~0.14% | ~24x | ~5.4x |
Manba Finance’s sub-1% yield is normal for a growth NBFC, not an outlier — Cholamandalam yields even less, and most lenders in this space prioritise reinvestment over distribution. What stands out positively is Manba Finance’s relatively modest valuation (~13x earnings, ~1.4x book) versus larger peers. Income seekers who want NBFC exposure with a real yield look instead to PSU financiers like Power Finance Corporation (~9.6%). Peer metrics from public market data; approximate and subject to daily change.
Manba Finance Limited Promoter Impact Analysis
Promoters hold 75.00% of Manba Finance — the regulatory maximum — with FIIs at 0.90% and public shareholders at about 24.10%. Because dividends are paid pro-rata, this concentration means the bulk of every rupee distributed flows to the promoter group.
Promoter share of FY26 dividend
~₹3.77 cr
75% of ₹5.02 cr
Public + FII share
~₹1.26 cr
~25% of outflow
For minority investors, the per-share amount is identical to the promoters’; there is no unfair tilt in the mechanics. But it is worth noting the capital-allocation picture: the company is paying out ~₹5 crore a year in dividends while simultaneously seeking to raise ~₹100 crore of fresh equity — a sign that growth, not distribution, is the priority.
Manba Finance Limited Dividend Taxation
Since FY2020-21 India follows the classical system: dividends are taxed in the hands of the investor at their applicable income-tax slab rate, with no Dividend Distribution Tax. Under Section 194, the company deducts 10% TDS only if total dividend from that company exceeds ₹10,000 in a financial year (threshold raised from ₹5,000 effective 1 April 2025); with no PAN, TDS is 20%.
Worked example (Manba Finance, full FY26 ₹1.00/share, 30% slab):
• Hold 1,000 shares → gross dividend ₹1,000. Below ₹10,000, so no TDS. Tax at 30% = ₹300. Net in hand = ₹700.
• Hold 12,000 shares → gross ₹12,000. TDS at 10% = ₹1,200. Total tax at 30% = ₹3,600. Net = ₹8,400.
General information only, not tax advice. Verify your position with a qualified tax professional.
Manba Finance Limited — Key Risks
- Negligible income yield. At ~0.21% on the final dividend and ~0.84% for the full year, Manba Finance offers almost no income cushion; total return depends entirely on share-price appreciation.
- Equity dilution ahead. The proposed ~₹99.99 crore preferential issue (EGM 19 Oct 2026) would expand the share count, spreading future dividends thinner unless profit scales faster.
- Asset-quality sensitivity. Gross NPA of 3.41% in a used-vehicle and two-wheeler book is cyclical and can rise quickly in a borrower-stress environment.
- Rising cost of funds. Finance costs jumped ~47% in FY26; any further tightening compresses the spread that funds both profit and dividend.
- Micro-cap liquidity & concentration. With ~₹600 crore market cap and 75% promoter holding, the free float is thin and the stock can be volatile.
Manba Finance Limited — What To Monitor
- Outcome of the 19 Oct 2026 EGM — whether the ₹99.99 crore preferential issue and authorised-capital increase are approved, and the resulting change in promoter stake and share count.
- Dividend payout trajectory — whether the per-share payout holds or grows after the equity raise, and whether a formal dividend policy is announced.
- AUM growth vs asset quality — can Manba Finance keep growing the book above 20% without Gross/Net NPA drifting higher?
- Net interest margin & cost of funds — the spread between lending yields and borrowing costs as the company scales.
- Capital adequacy deployment — how quickly the surplus CRAR (24.4%) is converted into earning assets, which should lift the currently modest ROE.
Should You Consider Manba Finance for Dividend Income? — Conclusion
Manba Finance Limited’s FY2025-26 final dividend of ₹0.25 per share (record date 18 September 2026) is a well-covered, clearly sustainable payout — but it is a growth-stock gesture, not an income stream. The “10% for FY26” headline is a face-value figure; the real market yield is under 1%.
The positives are genuine: ~47% four-year profit CAGR, a 24.4% capital buffer, 36x earnings cover and an unbroken (if short) payment record. The negatives are equally clear: a token yield, pending equity dilution, cyclical NPAs and thin micro-cap liquidity. For income-focused investors, the yield is simply too small to matter; for those drawn to the growth story, the dividend is a minor bonus. ShareBazaar Online presents the facts and the forensics — the decision is yours.
Frequently Asked Questions About Manba Finance Dividend
What dividend has Manba Finance announced for FY2025-26?
What is the Manba Finance dividend yield?
What is the record date for the Manba Finance dividend?
What was the ex-dividend date?
When will the Manba Finance dividend be paid?
Who was eligible for the Manba Finance dividend?
How is the Manba Finance dividend taxed?
Is the Manba Finance dividend sustainable?
What is Manba Finance’s dividend history?
What should investors monitor on Manba Finance?
Why is the Manba Finance dividend yield so low?
Does Manba Finance pay interim dividends?
Disclaimer – Manba Finance Limited Dividend
This article is published by ShareBazaar Online for informational and educational purposes only and does not constitute investment, legal or tax advice, or any recommendation to buy, sell or hold any security. ShareBazaar Online is not a SEBI-registered investment adviser. Dividend figures, record dates and financial data are based on publicly disclosed company filings and third-party financial databases; market prices, yields and ratios are approximate, were computed by ShareBazaar Online where indicated, and are subject to change. Ex-date and payment-date references are inferred from settlement and statutory norms and must be confirmed against the official NSE/BSE corporate-action circulars. Dividends and taxation depend on individual circumstances — consult a qualified financial or tax professional before acting. Investments in securities are subject to market risks; read all related documents carefully. ShareBazaar Online accepts no liability for any loss arising from the use of this information.