
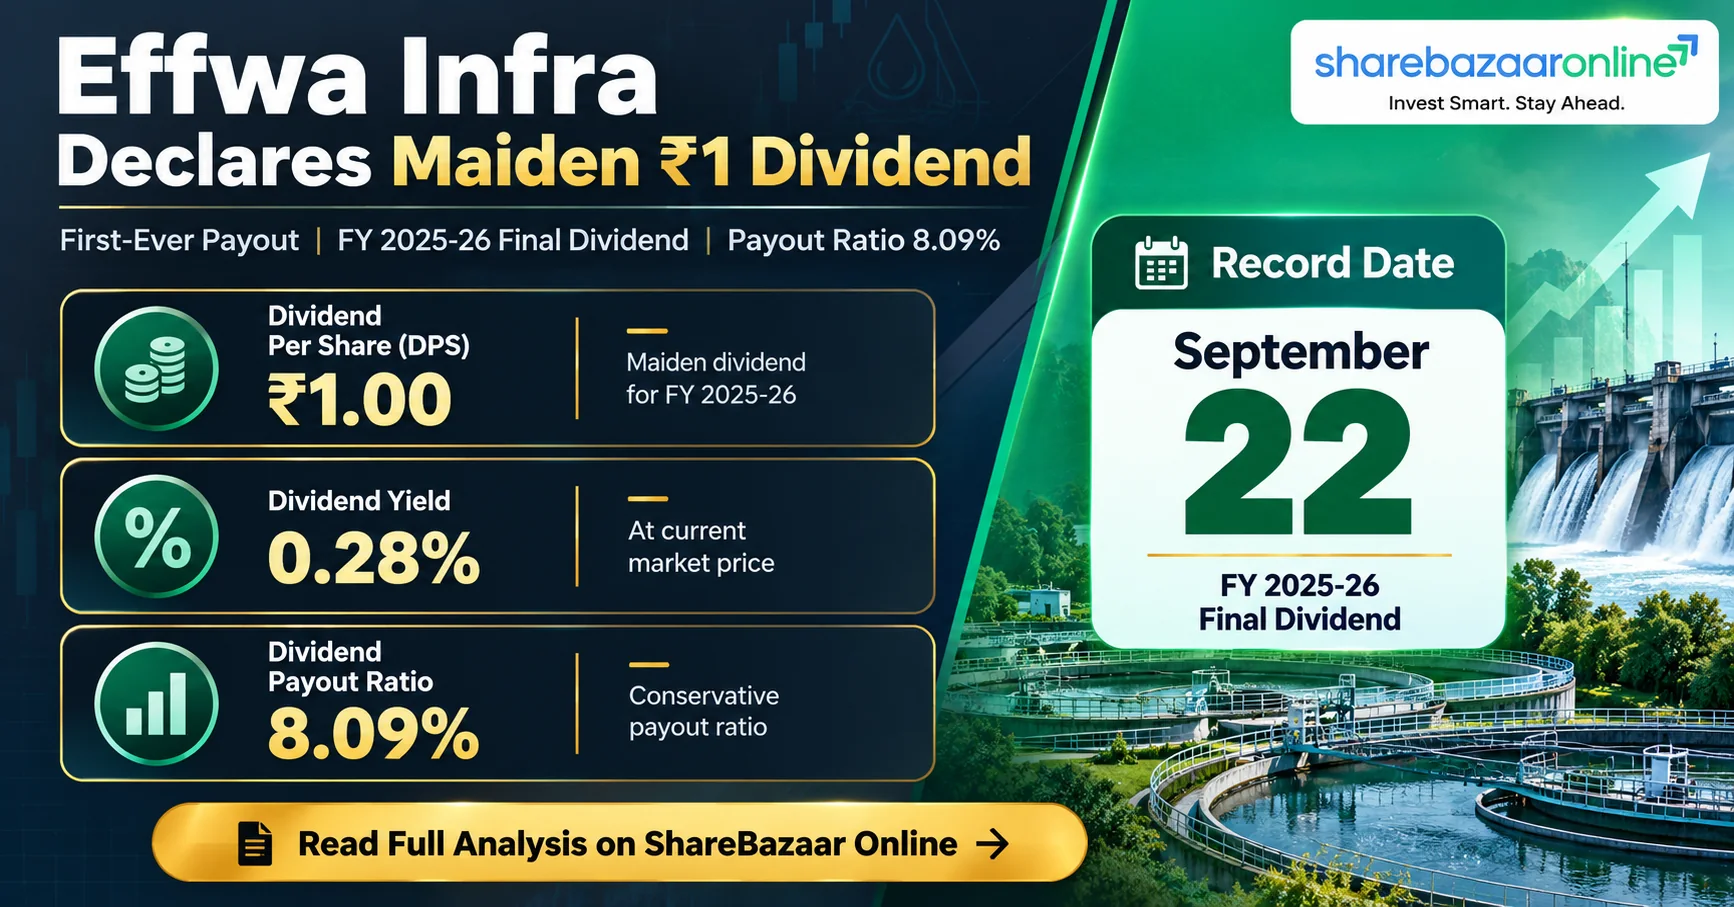
Dividend Snapshot – Effwa Infra & Research Limited
Company Details
| Company | Effwa Infra & Research Limited |
| NSE Symbol | EFFWA |
| ISIN | INE0U9101019 |
| CIN | L90001MH2014PLC251793 |
| Face Value | ₹10 |
Dividend Details
| Dividend Type | Final Dividend |
| Dividend Per Share | ₹1.00 |
| Dividend % | 10% of Face Value |
| Financial Year | FY 2025-26 |
| Dividend Yield | 0.28% |
Key Dates
| Announcement Date | May 12, 2026 |
| Record Date | September 22, 2026 |
| Ex-Dividend Date | September 21, 2026 |
| Book Closure | Sept 23–30, 2026 |
| Payment Date | Not Disclosed by Company |
Market Data
| CMP (Oct 6, 2026) | ₹352.00 |
| Market Cap | ₹815 Cr |
| P/E Ratio | 28.5x |
| 52-Week Range | ₹165 – ₹400 |
| Book Value | ₹53.40 |
Effwa Infra & Research Limited – Company Overview
Effwa Infra & Research Limited, incorporated in 2014 and headquartered in Maharashtra, operates in the water and wastewater infrastructure sector. The company specializes in designing, building and operating water treatment plants, sewage treatment plants (STPs) and effluent treatment plants (ETPs) for municipal bodies and industrial clients. Listed on NSE SME platform in July 2024, Effwa has grown revenue at a 36% CAGR over 5 years, scaling from ₹55 Cr (FY21) to ₹253 Cr (FY26). Net profit surged at 66% CAGR during the same period. This FY26 final dividend of ₹1 per share marks the company's maiden dividend, signalling management confidence in the business's cash generation maturity after its IPO listing. (Source: Screener.in)
Effwa Infra & Research Limited – Financial Analysis
Profitability Metrics (FY26)
| Revenue | ₹253 Cr |
| Operating Profit | ₹42 Cr |
| OPM | 17% |
| Net Profit (PAT) | ₹29 Cr |
| EPS | ₹12.36 |
Return Ratios
| ROE (3-Yr Avg) | 30.5% |
| ROCE (FY26) | 29% |
| Revenue CAGR (5-Yr) | 36% |
| Profit CAGR (5-Yr) | 66% |
| P/E Ratio | 28.5x |
Effwa Infra delivered a strong FY26, with revenue rising 37% YoY to ₹253 Cr and PAT growing 45% YoY to ₹29 Cr. Operating margins expanded to 17%, indicating improving operational efficiency. ROCE at 29% and ROE at 30.5% reflect superior capital allocation for a small-cap infrastructure company. However, ROCE has declined from 44% in FY24, suggesting that equity dilution from the IPO and rising borrowings are moderating returns. The high debtor days of 185 days remain a key concern, signalling that a significant portion of revenue remains uncollected. (Source: Screener.in)
Effwa Infra & Research Limited – Dividend History
| Financial Year | Dividend/Share (₹) | Dividend % | Type |
|---|---|---|---|
| FY 2025-26 | ₹1.00 | 10% | Final |
| FY 2024-25 | Nil | — | — |
| FY 2023-24 | Nil | — | — |
| FY 2022-23 | Nil | — | — |
| FY 2021-22 | Nil | — | — |
| FY 2020-21 | Nil | — | — |
Classification: First-Time Payer. Effwa Infra has never paid a dividend before FY26. This ₹1 per share final dividend is the company's maiden dividend, introduced after listing on NSE SME in July 2024. The decision signals management's intent to begin rewarding shareholders after achieving operating cash flow positivity in FY26 (₹29 Cr OCF vs negative ₹31 Cr in FY25). However, as a first-time payer with no established track record, future consistency remains unproven. Investors should monitor whether Effwa maintains or increases dividends in subsequent years before classifying it as a reliable income stock. (Source: Screener.in)
Expert Commentary on Effwa Infra & Research Limited Dividend
Effwa Infra's maiden dividend of ₹1 per share is more symbolic than material. At a 0.28% yield, it barely covers a single day's bank savings interest. The real story lies beneath: a company that went from negative ₹31 Cr operating cash flow in FY25 to positive ₹29 Cr in FY26. This ₹60 Cr cash flow turnaround, not the modest dividend, demonstrates the true value creation. The ultra-conservative 8.09% payout ratio means management is retaining ₹27 Cr for reinvestment — a sensible decision for a company growing revenue at 36% CAGR. The dividend signals institutional maturity, not a shareholder income play. Investors buying Effwa for yield are in the wrong stock; those tracking its transition from a capital-hungry growth company to a cash-generating franchise should note this milestone.
Effwa Infra & Research Limited – Future Outlook
India's water infrastructure sector is projected to see sustained government capex under Jal Jeevan Mission and AMRUT 2.0 through FY28. Effwa Infra, with its proven execution in STP and ETP projects, stands to benefit from this multi-year order pipeline. The company's operating margin expansion from 8% (FY21) to 17% (FY26) suggests improving project mix and pricing power. If revenue sustains its growth trajectory toward ₹350–400 Cr in FY27 and the debtor days contract below 150 days, future dividends could scale meaningfully. However, the high working capital intensity of the business (debtor days at 185) and rising borrowings (₹38 Cr in FY26) could constrain payout capacity. The maiden dividend sets a precedent, but consistency depends on continued cash flow improvement and disciplined capital allocation. (Source: Screener.in)
Effwa Infra & Research Limited – Dividend Announcement Summary
The Board of Directors of Effwa Infra & Research Limited recommended a final dividend of ₹1 per equity share (10% on face value of ₹10) for FY 2025-26, subject to approval at the 12th Annual General Meeting (AGM) on September 30, 2026. The company filed the intimation for Record Date with NSE on September 8, 2026, setting the record date as September 22, 2026 and book closure from September 23 to September 30, 2026. This is a board-recommended dividend requiring AGM approval, not a board-declared interim dividend. The dividend outflow for this payout is approximately ₹2.31 Cr, representing just 8.09% of FY26 net profit — among the lowest payout ratios in the water infrastructure sector.
Effwa Infra & Research Limited – Key Dates Timeline
Effwa Infra & Research Limited – Dividend Yield Analysis
Yield Calculations
| Dividend Per Share | ₹1.00 |
| CMP (Oct 6, 2026) | ₹352.00 |
| Dividend Yield (Current) | 0.28% |
| CMP on Filing Date (Sep 8) | ₹360.50 |
| Yield at Filing Date | 0.28% |
Yield Context
| Bank FD Rate (1-Yr) | ~7.0% |
| Nifty Dividend Yield | ~1.2% |
| Sector Avg Yield | ~0.5% |
| Payout Ratio | 8.09% |
Yield Reality Check: At 0.28%, Effwa Infra's dividend yield is among the lowest in the listed infrastructure space. This is not because the dividend is unsustainable — it simply reflects the stock's premium valuation at 28.5x P/E and a conservative payout of just 8.09%. A ₹1 dividend on a ₹352 stock price delivers negligible income. The low yield is driven by strong share price appreciation (53% in 1 year), not by dividend cuts. Income-focused investors will find better yields elsewhere; growth investors should evaluate the total return potential (capital appreciation + dividend) rather than yield alone.
Effwa Infra & Research Limited – Dividend History Analysis
| FY | Revenue (₹ Cr) | PAT (₹ Cr) | EPS (₹) | DPS (₹) | Payout % |
|---|---|---|---|---|---|
| FY21 | 55 | 2 | 96.30* | Nil | — |
| FY22 | 104 | 4 | 189.60* | Nil | — |
| FY23 | 115 | 5 | 220.55* | Nil | — |
| FY24 | 145 | 14 | 7.80 | Nil | — |
| FY25 | 185 | 20 | 8.69 | Nil | — |
| FY26 | 253 | 29 | 12.36 | ₹1.00 | 8.09% |
*Pre-IPO EPS on lower share base (pre-stock split/bonus adjustment)
Effwa Infra paid zero dividends from FY21 to FY25, making FY26 the first-ever payout. Pre-IPO years (FY21–FY23) show abnormally high EPS due to a much smaller equity base before the July 2024 IPO. Post-listing, the EPS normalized to ₹7.80 (FY24), grew to ₹8.69 (FY25), and reached ₹12.36 (FY26) — a 42% YoY increase. The maiden dividend of ₹1 was introduced precisely when operating cash flow turned positive at ₹29 Cr. No historical consistency can be assessed; this is a new dividend program requiring at least 3–5 years of data before reliability can be judged. (Source: Screener.in)
Effwa Infra & Research Limited – Financial Performance Analysis
Operating Leverage Analysis
| Metric | FY24 | FY25 | FY26 | YoY Change (FY26) |
|---|---|---|---|---|
| Revenue (₹ Cr) | 145 | 185 | 253 | +37% |
| Operating Profit (₹ Cr) | 20 | 30 | 42 | +40% |
| OPM % | 14% | 16% | 17% | +1pp |
| PAT (₹ Cr) | 14 | 20 | 29 | +45% |
Positive operating leverage confirmed: PAT grew 45% on 37% revenue growth, meaning each incremental rupee of revenue generates disproportionately higher profit. Operating margins expanded from 14% (FY24) to 17% (FY26), indicating the company is moving toward higher-margin projects and achieving better project execution. However, the absolute margin level of 17% remains moderate for the infrastructure sector. The key risk is whether this margin expansion sustains as the company scales beyond ₹300 Cr revenue, where competitive bidding pressures may intensify. (Source: Screener.in)
Effwa Infra & Research Limited – Cash Flow Analysis
| Cash Flow (₹ Cr) | FY24 | FY25 | FY26 |
|---|---|---|---|
| Operating Cash Flow (OCF) | 5 | -31 | 29 |
| Investing Cash Flow | -1 | 0 | -20 |
| Free Cash Flow (FCF) | 5 | -31 | 9 |
| CFO/Operating Profit | 34% | -80% | 93% |
| FCF Coverage (FCF ÷ Dividend) | N/A | N/A | 3.90x |
Critical finding: FY25 operating cash flow was negative ₹31 Cr despite ₹20 Cr PAT, indicating profits existed only on paper while cash was locked in receivables. FY26 shows a dramatic reversal with ₹29 Cr OCF (93% of operating profit), confirming that the dividend is funded from genuine cash earnings, not reserves or borrowings. The FCF of ₹9 Cr covers the ₹2.31 Cr dividend outflow 3.90 times. However, the ₹20 Cr investing cash outflow in FY26 suggests the company invested heavily. With borrowings rising to ₹38 Cr, the cash position requires monitoring — especially given that high debtor days (185 days) could reverse cash flow gains if collections slow. (Source: Screener.in)
Effwa Infra & Research Limited – Balance Sheet Strength
Balance Sheet (FY26)
| Total Assets | ₹198 Cr |
| Equity Capital | ₹23 Cr |
| Reserves | ₹100 Cr |
| Total Equity | ₹123 Cr |
| Borrowings | ₹38 Cr |
| Debt-to-Equity | 0.31x |
Working Capital Metrics
| Debtor Days | 185 days |
| Payable Days | 52 days |
| Cash Conversion Cycle | 134 days |
| Fixed Assets | ₹1 Cr |
| Asset-Light Model | Yes |
Effwa Infra operates an asset-light model with only ₹1 Cr in fixed assets, typical for EPC contractors that subcontract heavy machinery. The debt-to-equity ratio of 0.31x is comfortable, though borrowings grew from ₹14 Cr (FY24) to ₹38 Cr (FY26) — a 171% increase in 2 years. Reserves at ₹100 Cr (including IPO proceeds) provide a buffer. The critical weakness is debtor days at 185 — over 6 months of revenue is locked in receivables. While this improved from 232 days in FY25, it remains dangerously high. If a major municipal client delays payment further, it could force additional borrowing, pressuring both interest costs and future dividend capacity. (Source: Screener.in)
Effwa Infra & Research Limited – Dividend Sustainability Analysis
Sustainability Scorecard
| Payout Ratio | 8.09% ✓ |
| EPS Coverage | 12.36x ✓ |
| OCF Coverage | 12.55x ✓ |
| FCF Coverage | 3.90x ✓ |
| Debt-to-Equity | 0.31x ✓ |
| Earnings Trend | Growing ✓ |
| Cash Flow Stability | Volatile ⚠ |
| Dividend Track Record | None ✗ |
Classification: Moderately Sustainable. On paper, this dividend is highly affordable — the ₹2.31 Cr outflow is comfortably covered by ₹29 Cr PAT, ₹29 Cr OCF and ₹9 Cr FCF. The ultra-low 8.09% payout ratio means Effwa could multiply its dividend 5–6x without straining earnings. However, sustainability is marked down for two reasons: (1) Cash flow is volatile — FY25 showed negative ₹31 Cr OCF, meaning one bad year of collections can wipe out cash flow entirely; and (2) No dividend history exists, making it impossible to assess management's commitment to maintaining payouts during downturns. The dividend is funded from current earnings, not reserves or borrowings — a positive sign. (Source: Screener.in)
Effwa Infra & Research Limited – Peer Comparison
| Company | Mkt Cap (₹ Cr) | P/E | Div. Yield | Payout % | ROCE |
|---|---|---|---|---|---|
| Effwa Infra | 815 | 28.5x | 0.28% | 8.09% | 29% |
| VA Tech Wabag | 12,494 | 19.5x | 0.50% | 9.35% | 22% |
| Ion Exchange | 5,893 | 31.9x | 0.35% | 13.25% | 18% |
| EMS Ltd | 2,400 | 25x | 0.40% | 10% | 25% |
Among water infrastructure peers, Effwa Infra offers the lowest dividend yield at 0.28% and the lowest payout ratio at 8.09%. However, it delivers the highest ROCE at 29%, indicating superior capital efficiency. VA Tech Wabag, the sector leader at ₹12,494 Cr market cap, yields 0.50% with a 9.35% payout. Ion Exchange offers a higher 13.25% payout but carries a steeper 31.9x P/E. Effwa's premium valuation is justified by its 66% profit CAGR — the fastest growth rate in this peer set. For dividend income, VA Tech Wabag is the better choice; for growth with future dividend potential, Effwa's low base offers more room to scale payouts. (Sources: Screener.in, Blinkx)
Effwa Infra & Research Limited – Promoter Impact Analysis
Shareholding Pattern (Jun 2026)
| Promoters | 73.03% |
| FIIs | 0.01% |
| DIIs | 3.51% |
| Public | 23.45% |
| Total Shareholders | 2,202 |
Dividend Distribution
| Total Dividend Outflow | ₹2.31 Cr |
| Promoter Share (73.03%) | ₹1.69 Cr |
| DII Share (3.51%) | ₹0.08 Cr |
| Public Share (23.45%) | ₹0.54 Cr |
With 73.03% promoter holding, the promoter group receives ₹1.69 Cr out of the ₹2.31 Cr total dividend — a 73% share. Public shareholders holding 23.45% receive just ₹0.54 Cr. The high promoter stake is common among recently-listed SME companies and implies that management has strong skin in the game. However, from a dividend perspective, the promoter benefits disproportionately. The negligible 0.01% FII holding signals that institutional investors have not yet discovered this stock — a potential positive catalyst if FIIs enter, but also a liquidity risk. With only 2,202 shareholders, the stock has extremely concentrated ownership and thin free-float. (Source: Screener.in)
Effwa Infra & Research Limited – Taxation Analysis
Indian Dividend Tax Rules (FY 2025-26)
Since April 2020, dividends are taxable in the hands of shareholders at their individual income tax slab rate. The company deducts TDS at 10% if total dividend income from a company exceeds ₹5,000 in a financial year. No TDS is deducted if dividend is below ₹5,000 or if the shareholder submits Form 15G/15H (for nil/lower tax liability).
Worked Example: Tax Impact on Effwa Infra Dividend
| Shares Held | 1,000 shares |
| Dividend Per Share | ₹1.00 |
| Gross Dividend | ₹1,000 |
| TDS (10%) | ₹0 (below ₹5,000 threshold) |
| Tax at 30% Slab | ₹300 |
| Cess (4%) | ₹12 |
| Total Tax | ₹312 |
| Net Dividend (Post-Tax) | ₹688 |
| Effective Yield (Post-Tax) | 0.20% |
For a 30% tax slab investor holding 1,000 shares, the ₹1,000 gross dividend reduces to just ₹688 after tax. The effective post-tax yield falls from 0.28% to 0.20%. Since Effwa's dividend per share is ₹1, an investor would need to hold over 5,000 shares (₹17.60 lakh investment) before TDS of 10% is deducted at source. Lower tax slab investors retain more: a 5% slab investor pays only ₹52 tax on ₹1,000 dividend, netting ₹948. The tax impact is negligible in absolute terms given the small dividend quantum, but underscores that the effective income from Effwa's maiden dividend is minimal.
Key Risks – Effwa Infra & Research Limited Dividend
- 1.Extreme Debtor Days (185 days): Over 6 months of revenue is locked in receivables from municipal and government clients. Any further deterioration could push operating cash flow negative, directly threatening future dividends.
- 2.Cash Flow Volatility: OCF swung from +₹5 Cr (FY24) to -₹31 Cr (FY25) to +₹29 Cr (FY26). This extreme volatility makes dividend sustainability unpredictable despite healthy reported profits.
- 3.Rising Debt: Borrowings surged 171% from ₹14 Cr (FY24) to ₹38 Cr (FY26). If debt continues growing while collections slow, interest costs could erode dividend-paying capacity.
- 4.SME Segment Liquidity Risk: With only 2,202 shareholders and 23.45% public float, trading volumes are thin. Large sell orders could cause disproportionate price drops, wiping out multiple years of dividend income.
- 5.Government Client Concentration: Water infrastructure contracts are predominantly government-funded. Policy changes, budget cuts, or election-cycle delays could disrupt order flow and revenue visibility.
- 6.No Dividend Track Record: This is a maiden dividend. Management has no established commitment to maintaining or growing dividends, making future payouts entirely discretionary.
- 7.Valuation Premium: At 28.5x P/E and 6.6x Price-to-Book, any earnings disappointment could trigger sharp corrections, negating multiple years of dividend returns in a single trading session.
What To Monitor – Effwa Infra & Research Limited
- 1.Debtor Days Trajectory: Track quarterly debtor days. A drop below 150 days signals improving collections and strengthens dividend sustainability. Any rise above 200 days is a red flag.
- 2.Operating Cash Flow Consistency: FY26's ₹29 Cr OCF must be sustained in FY27. Watch for OCF-to-PAT ratio staying above 70% — anything below indicates profit quality deterioration.
- 3.Order Book Growth: New order wins and order book-to-revenue ratio determine revenue visibility. A declining order book would threaten both growth and dividend prospects.
- 4.Debt Levels: Monitor whether borrowings stabilize or continue rising. Debt-to-equity above 0.5x would signal leveraging up at the expense of dividend capacity.
- 5.Promoter Holding Changes: Any reduction from the current 73.03% promoter stake — through stake sales or dilution — should be closely watched as it alters alignment with minority shareholders.
- 6.Operating Margin Trends: OPM expanding to 17% is positive, but track whether competitive bidding erodes margins as the company pursues larger projects.
- 7.FY27 Dividend Policy: The most critical signal — whether management announces a second dividend for FY27 will determine if this is a one-time gesture or a sustainable program.
Conclusion – Effwa Infra & Research Limited Dividend FY26
Effwa Infra's maiden ₹1 per share dividend is a symbolic milestone, not an income play. At 0.28% yield, it delivers negligible income — ₹1,000 gross on a ₹3.52 lakh investment (1,000 shares). The real significance lies in management's willingness to share profits after achieving operating cash flow positivity. The dividend is comfortably funded by ₹29 Cr PAT and ₹9 Cr FCF, with an ultra-conservative 8.09% payout ratio. However, volatile cash flows (FY25's negative ₹31 Cr OCF), high debtor days (185 days), and the absence of any dividend track record mean investors should treat this as a growth-stage initiation, not a reliable income stream. The company's 66% profit CAGR, 29% ROCE, and exposure to India's water infrastructure buildout represent the actual investment thesis. Monitor FY27 dividend and cash flow for consistency signals.
Frequently Asked Questions – Effwa Infra & Research Limited Dividend
What dividend has Effwa Infra & Research Limited announced for FY 2025-26?
What is the dividend yield of Effwa Infra (EFFWA) stock?
What is the record date for Effwa Infra FY26 dividend?
What is the ex-dividend date for Effwa Infra?
When will Effwa Infra pay the FY26 dividend?
Who is eligible for Effwa Infra's dividend?
How is Effwa Infra's dividend taxed in India?
Is Effwa Infra's dividend sustainable?
What is Effwa Infra's dividend history?
What should investors monitor after Effwa Infra's dividend?
What is Effwa Infra's dividend payout ratio?
How does Effwa Infra's dividend compare to peers like VA Tech Wabag?
Disclaimer
This article is published by ShareBazaar Online for informational and educational purposes only. It does not constitute investment advice, a recommendation to buy, sell or hold any securities, or an offer to transact. All data has been sourced from publicly available company filings, stock exchanges (NSE/BSE), and financial databases. While every effort has been made to ensure accuracy, ShareBazaar Online does not guarantee the completeness or timeliness of the information. Investors should consult a SEBI-registered investment advisor before making investment decisions. Past dividend payments do not guarantee future dividends. Stock market investments are subject to market risks. Read all scheme-related documents carefully before investing.