
Dividend Snapshot – E Factor Experiences Limited
Company Details
| Company | E Factor Experiences Limited |
| NSE Symbol | EFACTOR |
| BSE Code | 78925 |
| ISIN | INE0KFF01017 |
| Face Value | ₹10 |
Dividend Details
| Dividend Type | Final Dividend |
| Dividend Per Share | ₹1.20 |
| Dividend % | 12% |
| Financial Year | 2025-26 |
| Dividend Yield | 0.68% |
Market Data
E Factor Experiences Limited – Company Overview
E Factor Experiences Limited (CIN: L92199DL2003PLC118285) is a Noida-headquartered event management company founded in 2000 by CEO Samit Garg. The company provides end-to-end experiential event services including tourism events, corporate functions, technology-based multimedia light & sound installations, hot air balloon safaris, adventure tourism, destination management, and specialized turnkey wedding solutions. Listed on NSE since October 9, 2023, through an IPO that raised ₹25.92 Cr, E Factor operates with approximately 75 employees. For FY2026, the company reported consolidated revenue of ₹191.44 Cr with a net profit of ₹19.67 Cr. The stock has seen significant correction from its all-time high of ₹348 in December 2025, declining 48.5% YTD.
E Factor Experiences Limited – Financial Analysis
Profitability Metrics (FY2026)
| Revenue | ₹191.44 Cr |
| Revenue Growth (YoY) | +11.6% |
| Net Profit (PAT) | ₹19.67 Cr |
| PAT Growth (YoY) | -2.5% |
| EPS | ₹14.99 |
| ROE | 24.4% |
| ROCE | 24.7% |
Operating Leverage Concern
Revenue grew +11.6% in FY2026, yet PAT declined -2.5%. This negative operating leverage signals margin compression. Costs — likely employee expenses, event execution overheads, and interest on ₹49 Cr borrowings — expanded faster than top-line growth. The 5-year revenue CAGR of 81% is impressive, but investors should note that profitability has not scaled proportionally. Operating expenses consumed a larger share of incremental revenue, squeezing net margins despite the top-line expansion.
E Factor Experiences Limited – Dividend History
| Financial Year | Type | DPS (₹) | Dividend % | Announcement | Record Date | Ex-Date |
|---|---|---|---|---|---|---|
| FY 2025-26 | Final | ₹1.20 | 12% | May 26, 2026 | Sep 16, 2026 | Sep 16, 2026 |
| FY 2024-25 | Final | ₹1.20 | 12% | Aug 26, 2025 | Sep 19, 2025 | Sep 19, 2025 |
| FY 2023-24 | Final | ₹1.00 | 10% | — | — | — |
Source: Upstox, INDmoney. E Factor began paying dividends from its first full year post-listing.
Dividend History Assessment
E Factor Experiences has a brief but consistent dividend track record — three consecutive years of final dividends since listing. The DPS increased 20% from ₹1.00 (FY2024) to ₹1.20 (FY2025), then maintained at ₹1.20 for FY2026. Total dividends paid since listing aggregate to ₹3.40 per share. While the short history limits conclusions, the company demonstrates commitment to shareholder returns early in its listed journey. No special dividends have been declared. Classification: Consistent Payer (Early Stage).
Expert Commentary on E Factor Experiences Dividend
E Factor's decision to maintain the ₹1.20 dividend despite a 2.5% PAT decline and zero operating cash flow in FY2026 raises important questions. The dividend outflow of ₹1.58 Cr is modest — just 8.03% of net profit — so earnings technically cover it. However, the absence of operating cash flow means this dividend is effectively funded through financing activities (₹12 Cr inflow) rather than business operations. INDmoney describes E Factor as "primarily a capital appreciation stock rather than a high-dividend one," and the 0.68% yield confirms this. The 24th AGM approval is pending. Investors should watch whether improved cash conversion materializes before expecting dividend growth.
E Factor Experiences Limited – Future Outlook
E Factor operates in India's growing experiential events sector, benefiting from rising disposable incomes and corporate event spending. The 5-year revenue CAGR of 81% reflects strong demand. However, the 48.5% YTD stock decline and negative operating leverage suggest the market is repricing growth expectations. With debtor days at 199 days, cash collection remains a critical bottleneck. The company may need to prioritize working capital efficiency over top-line expansion. Dividend growth beyond ₹1.20 appears unlikely until operating cash flow turns positive. Next earnings on November 5, 2026 will be pivotal — investors should look for OCF improvement and margin recovery as key catalysts.
E Factor Experiences Limited – Dividend Announcement Summary
On May 26, 2026, the Board of Directors of E Factor Experiences Limited recommended a final dividend of ₹1.20 per equity share (12% on face value of ₹10) for the financial year 2025-26. This dividend is subject to approval by shareholders at the company's 24th Annual General Meeting. The company subsequently filed an intimation under SEBI Regulation 42 (LODR) on August 22, 2026, fixing the record date as September 16, 2026 and book closure from September 17 to September 23, 2026. Company Secretary Rahul Chauhan signed the filing. Total dividend outflow is estimated at ₹1.58 Cr based on approximately 1.31 Cr outstanding shares.
E Factor Experiences Dividend – Key Dates Timeline
Board Recommendation
May 26, 2026
SEBI Regulation 42 Filing
August 22, 2026
Ex-Dividend Date
September 16, 2026
Record Date
September 16, 2026
Book Closure Period
September 17–23, 2026
Expected Payment
October–November 2026 (Est.)
E Factor Experiences Dividend Yield Analysis
Yield Computation
| Dividend Per Share | ₹1.20 |
| CMP (Oct 5, 2026) | ₹175.60 |
| Dividend Yield | 0.68% |
| Announcement Date CMP | Not Available |
| Announcement Yield | Not Available |
Yield Reality Check
At 0.68%, E Factor's dividend yield is below the risk-free rate (government securities yield ~7%). The yield appears marginally elevated compared to historical levels — not because the dividend grew, but because the stock price fell 48.5% YTD. At the 52-week high of ₹348, the yield was just 0.34%. This is a classic case where apparent yield improvement is driven by share price weakness, not dividend strength. A savings account offers better income. E Factor is not a yield stock — it is a growth stock that happens to pay a token dividend.
E Factor Experiences Dividend History Analysis
E Factor's dividend history spans only three years post-listing. The trajectory shows initial growth — DPS rose 20% from ₹1.00 to ₹1.20 between FY2024 and FY2025 — followed by a plateau at ₹1.20 for FY2026. Total cumulative dividends stand at ₹3.40 per share. Notably, no interim or special dividends have been declared, indicating a conservative approach. The company has never cut dividends, though the sample size is limited. The payout ratio remained consistently low at 8-10%, suggesting the Board prioritizes reinvestment over shareholder distributions. With PAT declining and OCF at zero, maintaining ₹1.20 appears reasonable but not guaranteed if cash flow stress persists. Classification: Consistent Payer — Early Stage, Conservative Payout.
E Factor Experiences – Financial Performance Analysis
Revenue & Profit Trend
| Metric | FY2025 | FY2026 | Change |
|---|---|---|---|
| Revenue | ₹171.5 Cr | ₹191.4 Cr | +11.6% |
| PAT | ₹20.17 Cr | ₹19.67 Cr | -2.5% |
| EPS | ₹15.42 | ₹14.99 | -2.8% |
| Net Margin | 11.8% | 10.3% | -150 bps |
Margin Compression Factors
Despite 11.6% revenue growth, net margin compressed by 150 basis points to 10.3%. The company flagged potential interest cost capitalization — Screener.in notes the company "might be capitalizing the interest cost." With borrowings at ₹49 Cr and a debt-to-equity ratio of 0.54x, interest burden is meaningful. Additionally, elevated debtor days of 199 days suggest the company is extending credit to clients, tying up working capital and requiring external financing to fund operations. This combination of rising costs and slow collections explains the profit decline.
E Factor Experiences – Cash Flow Analysis
Cash Flow Statement (FY2026)
| Operating Cash Flow | ₹0 Cr |
| Investing Cash Flow | -₹13 Cr |
| Financing Cash Flow | +₹12 Cr |
| Free Cash Flow | -₹10 Cr |
| Net Cash Flow | -₹1 Cr |
⚠ Critical Red Flag: Zero Operating Cash Flow
E Factor reported ₹19.67 Cr PAT but ₹0 Cr operating cash flow in FY2026. This is a severe disconnect. Profits exist on paper, but the business generated no cash from operations. The 199-day debtor cycle is the primary culprit — revenue is booked but cash has not been collected. Meanwhile, the company spent ₹13 Cr on investments and funded itself through ₹12 Cr in borrowings. The ₹1.58 Cr dividend is technically being funded by debt, not by earnings. Free cash flow is -₹10 Cr, meaning the company cannot cover the dividend through internally generated cash. Reported profits are opinions; cash is fact.
E Factor Experiences – Balance Sheet Strength
Balance Sheet (FY2026)
| Total Assets | ₹161 Cr |
| Fixed Assets | ₹16 Cr |
| Equity Capital | ₹13 Cr |
| Reserves | ₹77 Cr |
| Net Worth | ₹90 Cr |
| Borrowings | ₹49 Cr |
| Debt-to-Equity | 0.54x |
Balance Sheet Assessment
E Factor's balance sheet is asset-light — fixed assets are only ₹16 Cr out of ₹161 Cr total, reflecting the service-oriented nature of event management. The bulk of assets (₹144 Cr) consists of receivables, advances, and other current assets, which explains the cash flow distortion. Borrowings at ₹49 Cr represent 54% of net worth — moderate but notable for a company with zero operating cash flow. The financing cash inflow of ₹12 Cr in FY2026 suggests reliance on external capital. Net worth growth to ₹90 Cr comes from retained earnings, but the quality of retained earnings is questionable when cash realization is poor.
E Factor Experiences – Dividend Sustainability Analysis
Sustainability Metrics
| Dividend Outflow | ₹1.58 Cr |
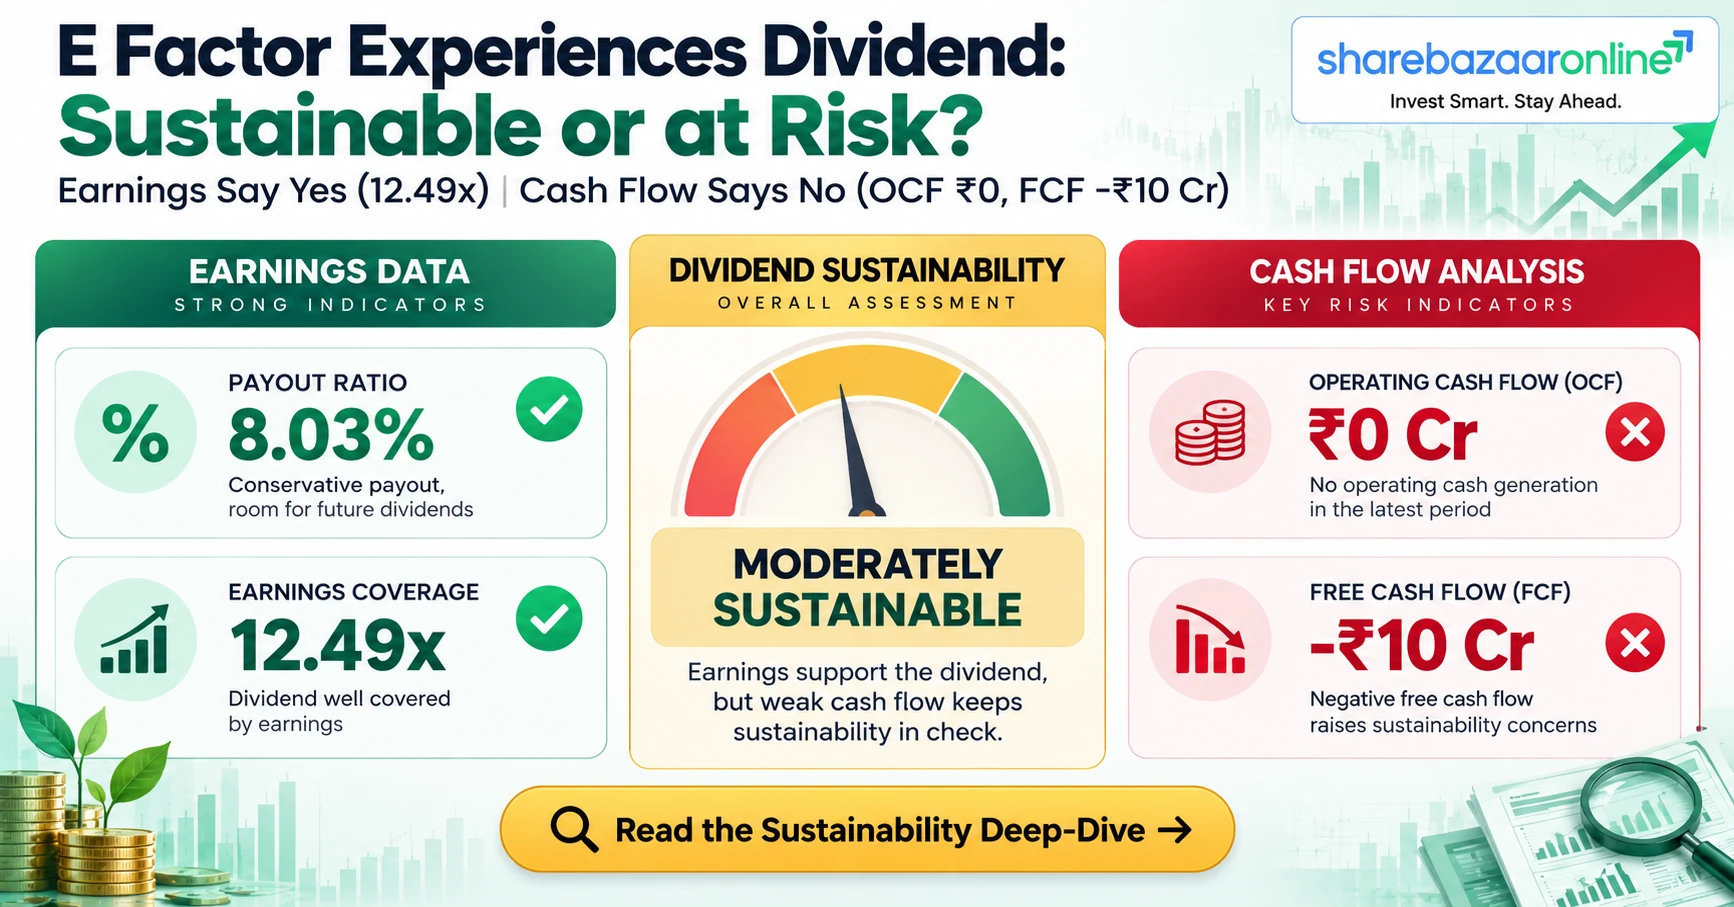
| Payout Ratio | 8.03% |
| Earnings Coverage | 12.49x |
| FCF Coverage | -6.33x |
| OCF vs PAT | ₹0 vs ₹19.67 Cr |
| Dividend Source | Financing Activities |
Sustainability Verdict
On paper, the 8.03% payout ratio and 12.49x earnings coverage suggest ample room to pay dividends. However, cash flow analysis tells a different story. With zero OCF and negative FCF of -₹10 Cr, the dividend is not funded by operations. It is effectively financed through borrowings. The company can sustain this ₹1.58 Cr outflow in the short term given the modest amount, but if cash conversion does not improve, even this token dividend could come under pressure. The gap between accounting profits and cash reality is the central risk. Classification: Moderately Sustainable — Earnings Support Present, Cash Flow Support Absent.
E Factor Experiences – Peer Comparison
| Metric | E Factor (EFACTOR) | Mach Conferences (MCEL) | Exhicon Events |
|---|---|---|---|
| CMP (₹) | 175.60 | 203.00 | 510.00 |
| Market Cap (₹ Cr) | 231 | 407 | 844 |
| P/E Ratio | 11.72 | 20.11 | N/A |
| Dividend Yield | 0.68% | 0.44% | 0% |
| ROE | 24.4% | N/A | 11.21% |
| ROCE | 24.7% | N/A | 14.71% |
Source: INDmoney, Screener.in. Data as of October 5, 2026.
Peer Assessment
Among listed Indian event management companies, E Factor offers the highest dividend yield at 0.68%, though absolute levels remain low across the sector. E Factor's P/E of 11.72 is the lowest, reflecting either undervaluation or market concerns about cash flow quality. Its ROE of 24.4% and ROCE of 24.7% significantly outperform Exhicon (ROE 11.21%, ROCE 14.71%). However, E Factor has the smallest market cap at ₹231 Cr. Mach Conferences is the closest peer with a similar dividend-paying profile. None of these event management companies qualifies as a dividend stock — the sector is growth-oriented with minimal shareholder distributions.
E Factor Experiences – Promoter Impact Analysis
Shareholding & Dividend Distribution
| Promoter Holding | 69.56% |
| Public Holding | 30.44% |
| FII Holding | 0.00% |
| MF/DII Holding | ~0.53% |
| Total Dividend Outflow | ₹1.58 Cr |
| Promoter Dividend | ₹1.10 Cr |
| Minority Dividend | ₹0.48 Cr |
Promoter Benefit Assessment
With a dominant 69.56% stake, promoters — led by CEO Samit Garg — receive ₹1.10 Cr of the ₹1.58 Cr dividend outflow. This is 69.6% of all dividends. The absence of any institutional ownership (FII at 0%, negligible MF presence) means the stock is essentially a promoter-dominated company with retail investors as the minority holders. While the low payout ratio means the dividend is not a vehicle for excessive cash extraction, promoters' disproportionate benefit from any dividend increase should be noted. Capital allocation through buybacks, which would benefit all shareholders equally, has not been considered by management.
E Factor Experiences Dividend – Taxation Analysis
Indian Dividend Tax Rules
Since the abolition of the Dividend Distribution Tax (DDT) from April 2020, dividends are taxed in the hands of shareholders at their applicable income tax slab rate. Key rules: (1) TDS at 10% is deducted by the company if total dividend from that company exceeds ₹5,000 in a financial year. (2) Dividend income is added to total income and taxed at the applicable slab rate. (3) A deduction under Section 57 is allowed for interest expense incurred to earn dividend income, up to 20% of dividend income.
Worked Example
| Shares Held | 1,000 |
| DPS | ₹1.20 |
| Gross Dividend | ₹1,200 |
| TDS (10%) | Nil (below ₹5,000) |
| Tax Slab (assumed) | 30% |
| Tax Payable | ₹360 |
| Net Dividend | ₹840 |
| Effective Yield (post-tax) | 0.48% |
Investment: 1,000 × ₹175.60 = ₹1,75,600. Net return: ₹840 / ₹1,75,600 = 0.48%.
E Factor Experiences – Key Risks
- Zero Operating Cash Flow: FY2026 OCF was ₹0 Cr despite ₹19.67 Cr PAT. If this persists, the company may need to borrow further or cut dividends.
- Extreme Debtor Days (199): Nearly 7 months of revenue is locked in receivables. A single large client default could trigger significant write-offs and a working capital crisis.
- Negative Free Cash Flow (-₹10 Cr): The business consumed cash rather than generating it. Dividend is effectively being funded through financing activities.
- Rising Debt (₹49 Cr): Borrowings represent 54% of net worth. If cash flow does not improve, the debt burden will escalate further, squeezing margins through interest costs.
- Margin Compression: Revenue grew 11.6% but PAT declined 2.5%. Operating leverage is negative — costs are rising faster than revenue, a structural concern.
- Interest Cost Capitalization Risk: Screener.in flags the company may be capitalizing interest costs, which would overstate profits and assets.
- High Promoter Concentration (69.56%): Low institutional interest (zero FII, minimal MF) limits price discovery and liquidity. The stock is 4.75x as volatile as Nifty.
- Small Cap Liquidity Risk: Market cap of ₹231 Cr with limited free float creates execution risk during market stress. The stock fell 48.5% YTD.
E Factor Experiences – What To Monitor
- Operating Cash Flow Recovery: Watch for OCF turning positive in upcoming quarters (next results: November 5, 2026). This is the single most important metric to track.
- Debtor Days Reduction: Improvement from 199 days toward industry-standard 90-120 days would signal better working capital discipline and cash realization.
- Debt Trajectory: Monitor whether borrowings (currently ₹49 Cr) increase further. Any debt reduction would be a strong positive signal.
- Net Margin Recovery: Track whether the FY2026 margin compression (10.3% vs 11.8%) reverses or deepens. Identify specific cost line items driving changes.
- Order Book & Revenue Pipeline: Event management visibility depends on booked events. A growing order pipeline would provide revenue assurance.
- Institutional Participation: Any entry by mutual funds or foreign investors would validate the investment thesis and improve liquidity.
- AGM Dividend Approval: Confirm shareholder approval of the ₹1.20 dividend at the 24th AGM and monitor management commentary on future capital allocation.
E Factor Experiences Dividend – Conclusion
E Factor Experiences Limited has recommended a final dividend of ₹1.20 per share (12% on ₹10 face value) for FY2026, maintaining parity with the previous year. At the current market price, this translates to a 0.68% dividend yield — well below risk-free rates. The low 8.03% payout ratio and 12.49x earnings coverage suggest the dividend is affordable on an accrual basis. However, the critical concern is zero operating cash flow and negative free cash flow of -₹10 Cr, meaning the dividend is not backed by cash generation. The company's 199-day debtor cycle and rising borrowings (₹49 Cr) point to working capital stress. Positives include strong ROE (24.4%), consistent dividend history, and revenue growth. This is a growth stock with a token dividend, not a dividend stock. Investors should focus on cash flow recovery and margin improvement at the November 5, 2026 earnings announcement.
Frequently Asked Questions About E Factor Experiences Dividend
What dividend has E Factor Experiences announced for FY2026?
What is E Factor Experiences' current dividend yield?
What is the record date for E Factor Experiences dividend?
What is the ex-dividend date for E Factor Experiences?
When will E Factor Experiences' dividend be paid?
Who is eligible for E Factor Experiences' FY2026 dividend?
How is E Factor Experiences' dividend taxed in India?
Is E Factor Experiences' dividend sustainable?
What is E Factor Experiences' dividend history?
What should investors monitor after E Factor Experiences' dividend?
Why did E Factor's stock price drop 48.5% in 2026?
What is E Factor Experiences' payout ratio?
Disclaimer
This analysis is published by ShareBazaar Online for informational and educational purposes only. It does not constitute investment advice, a recommendation, or a solicitation to buy, sell, or hold any security. All data has been sourced from publicly available filings, stock exchanges, and third-party financial platforms. While every effort has been made to ensure accuracy, ShareBazaar Online does not guarantee the completeness or timeliness of the information. Stock market investments are subject to market risks. Past performance and dividends do not guarantee future results. Investors should consult a SEBI-registered financial advisor before making any investment decisions. ShareBazaar Online and its authors do not hold any position in the securities discussed. Tax implications are illustrative and may vary based on individual circumstances — consult a qualified tax professional for personalized advice.