
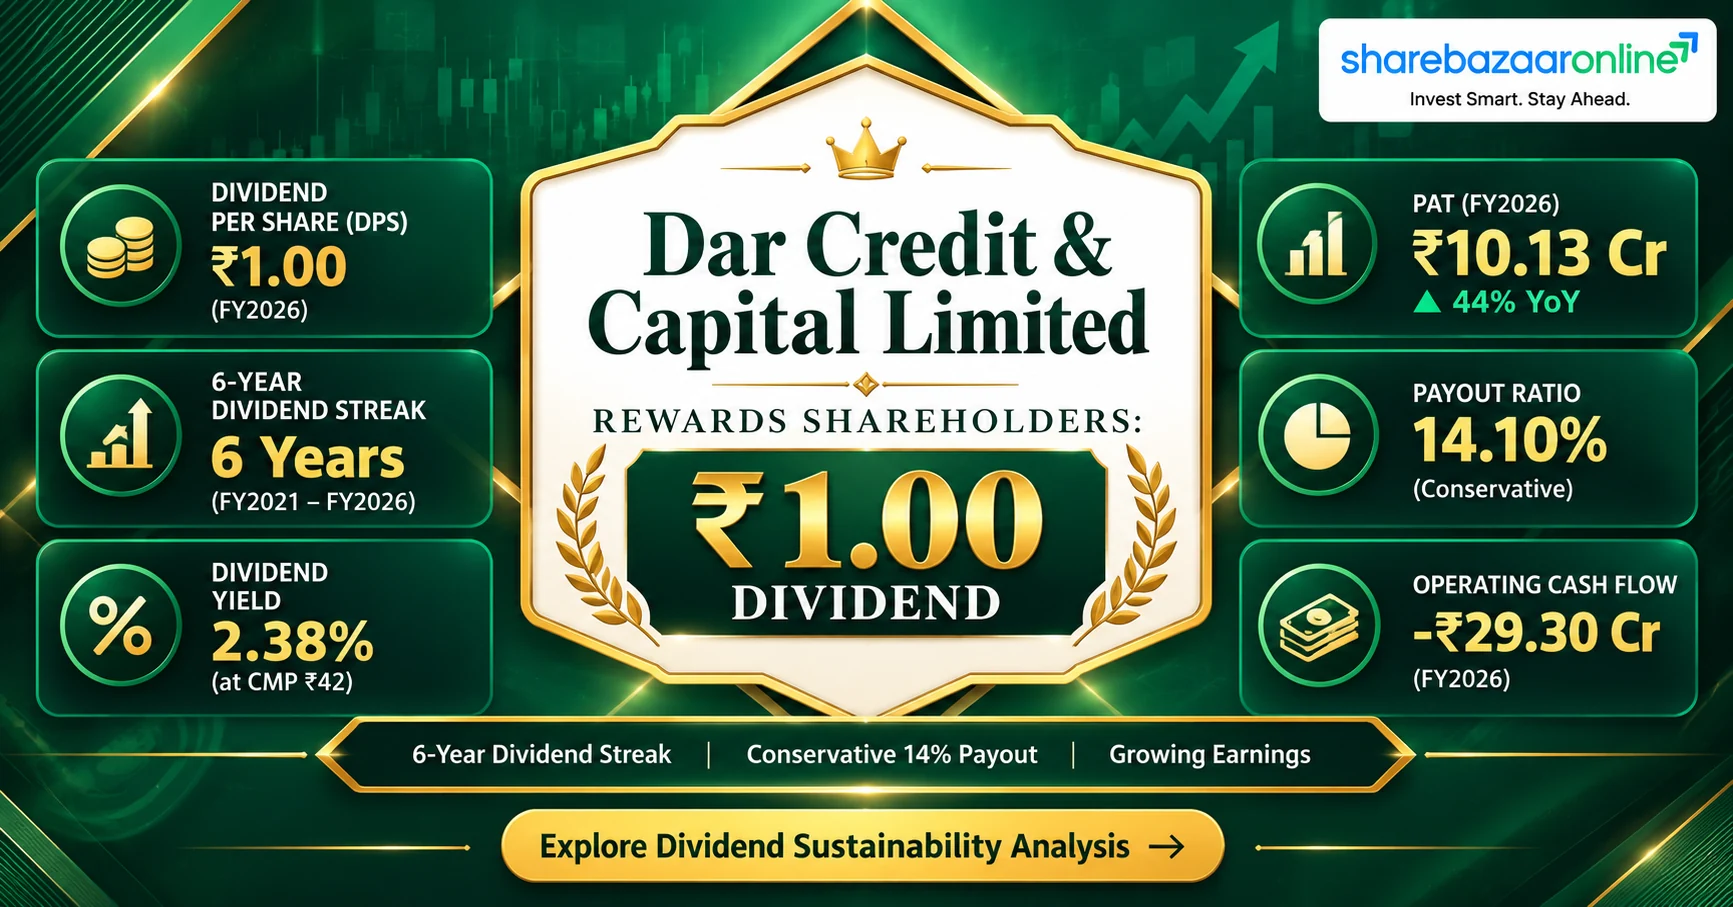
Dividend Snapshot – Dar Credit & Capital Limited
Company Identification
| Company | Dar Credit & Capital Limited |
| NSE Symbol | DCCL |
| BSE Code | 87709 |
| ISIN | INE04Q901010 |
| Face Value | ₹10 |
| Sector | NBFC |
FY2026 Dividend Summary
| Dividend Type | Final Dividend |
| Dividend Per Share | ₹0.50 |
| Dividend % | 5% |
| Total FY2026 DPS | ₹1.00 (Interim + Final) |
| Dividend Yield | 2.39% |
| CMP | ₹41.90 |
Key Financial Metrics (FY2026)
Dar Credit & Capital Limited – Company Overview
Dar Credit & Capital Limited (NSE: DCCL) is a Kolkata-headquartered non-banking financial company (NBFC) registered with the Reserve Bank of India. The company specialises in providing small-ticket loans — primarily gold loans, personal loans, and MSME financing — to underserved and semi-urban borrowers across 6 states: West Bengal, Bihar, Jharkhand, Rajasthan, Madhya Pradesh, and Gujarat. Operating through a network of 35 branches, DCCL has built an Assets Under Management (AUM) base of ₹229.55 Crore as of March 2026, reflecting 34.95% YoY growth. The company listed on the NSE Emerge platform in FY2026, raising ₹25.66 Crore through its IPO at ₹60 per share. With a net worth of ₹103.85 Crore and a consistent dividend-paying track record of 6 years, DCCL positions itself as a growth-oriented small-cap NBFC with a retail lending focus.
Dar Credit & Capital Limited – Financial Analysis
Profitability Metrics
| Revenue (FY2026) | ₹50.05 Cr |
| Revenue Growth YoY | +20.92% |
| EBITDA | ₹34.69 Cr |
| PAT | ₹10.13 Cr |
| PAT Growth YoY | +43.89% |
| PAT Margin | 20.30% |
Valuation & Returns
| EPS (FY2026) | ₹7.10 |
| P/E Ratio | 5.90 |
| P/B Ratio | 0.56 |
| ROE | 11.42% |
| ROCE | 13.82% |
| 5-Year Profit CAGR | 25% |
Dar Credit & Capital delivered strong operating performance in FY2026 with revenue growing 20.92% to ₹50.05 Crore and PAT surging 43.89% to ₹10.13 Crore. The profit growth significantly outpaced revenue growth, indicating positive operating leverage — EBITDA margins remained healthy at approximately 69%. The company trades at a P/E of just 5.90 and a P/B of 0.56, well below book value, suggesting the market is either deeply discounting the stock or pricing in risks related to asset quality and liquidity. The 5-year profit CAGR of 25% and 3-year profit CAGR of 55% demonstrate accelerating earnings growth (Source: Screener.in).
Dar Credit & Capital Limited – Dividend History
| Financial Year | Revenue (₹ Cr) | PAT (₹ Cr) | EPS (₹) | Payout Ratio |
|---|---|---|---|---|
| FY2021 | 28 | 3 | 3.42 | 15% |
| FY2022 | 25 | 3 | 2.56 | 20% |
| FY2023 | 25 | 3 | 2.72 | 18% |
| FY2024 | 33 | 4 | 3.69 | 14% |
| FY2025 | 41 | 7 | 7.04 | 7% |
| FY2026 | 50 | 10.13 | 7.10 | 14% |
Recent Dividend Declarations:
| Announced | Type | DPS (₹) | Ex-Date | Record Date |
|---|---|---|---|---|
| 15-May-2026 | Final | ₹0.50 | 23-Jun-2026 | 23-Jun-2026 |
| 11-Nov-2025 | Interim | ₹0.50 | 21-Nov-2025 | 21-Nov-2025 |
| 11-Jun-2025 | Final | ₹0.50 | 30-Jun-2025 | 30-Jun-2025 |
Dar Credit & Capital Limited – Expert Commentary
Dar Credit & Capital's FY2026 dividend of ₹1.00 per share (interim + final) represents a 100% increase over the previous year's ₹0.50 payout. At a payout ratio of just 14.10%, the company retains the vast majority of its earnings for business expansion — consistent with its aggressive AUM growth strategy of 34.95% YoY. However, the most critical finding is that the company's operating cash flow turned negative at -₹29 Crore in FY2026 while reporting a PAT of ₹10.13 Crore. This divergence between accrual profits and cash generation signals that rapid loan disbursements are outpacing collections. While this is common for a growing NBFC, investors must watch whether this cash flow gap narrows as the loan book seasons. The dividend, though small in absolute terms, is effectively funded by borrowings and IPO proceeds rather than operating cash flows.
Dar Credit & Capital Limited – Future Outlook
DCCL's future dividend growth hinges on three factors: loan book quality, cash flow normalisation, and sustainable AUM growth. The company's expansion into 6 states through 35 branches positions it for continued revenue growth. With FY2026 revenue CAGR at 13% (5-year) and profit CAGR at 25% (5-year), earnings trajectory is strong. However, the negative OCF of -₹29 Crore needs to convert positive as the loan book matures and collections improve. The NCD issuance of ₹61 Crore provides liquidity buffer but increases interest costs. If asset quality remains stable and the company achieves scale efficiencies, the ₹1.00 per share dividend level appears maintainable. Upside to dividends depends on whether management prioritises shareholder returns over aggressive balance sheet expansion. The company's low payout ratio of 14% leaves significant room for dividend increases if cash flows improve.
Dar Credit & Capital Limited – Dividend Announcement Summary
The Board of Directors of Dar Credit & Capital Limited announced a final dividend of ₹0.50 per equity share (5% on face value of ₹10) for the financial year ending March 2026. This was declared on 15th May 2026. Combined with the interim dividend of ₹0.50 per share announced on 11th November 2025, the total FY2026 dividend stands at ₹1.00 per share — a significant improvement over FY2025's single payout of ₹0.50. The total dividend outflow for FY2026 is approximately ₹1.43 Crore (₹1.00 × 1.428 Crore shares). The final dividend is subject to approval at the Annual General Meeting. Shareholders who held shares on the record date of 23rd June 2026 are eligible for this dividend. The book closure period for dividend and AGM is 10th July 2026 to 17th July 2026. Payment is expected within 25-45 days of the record date, likely post-AGM approval (Source: Upstox, NSE Filing dated 17-Jun-2026).
Dar Credit & Capital Limited – Key Dates Timeline
Dar Credit & Capital Limited – Dividend Yield Analysis
Yield Computation
| Total DPS (FY2026) | ₹1.00 |
| CMP | ₹41.90 |
| Dividend Yield | 2.39% |
| Final Dividend Yield | 1.19% |
| Dividend Coverage Ratio | 7.10x |
Yield Reality Check
DCCL's 2.39% dividend yield appears attractive for a small-cap NBFC, significantly higher than peers like Muthoot Finance (1.04%) and Manappuram Finance (0.97%). However, this yield is partly inflated by a declining share price — the stock has fallen from its all-time high of ₹66.00 (May 2025) to ₹41.90, a 36.5% decline. The yield is driven by share price weakness rather than exceptional dividend generosity. At the 52-week high of ₹59.80, the same ₹1.00 dividend would yield only 1.67%. Investors should not chase yield without understanding the underlying price deterioration.
Dar Credit & Capital Limited – Dividend History Analysis
DCCL has maintained a 6-year dividend-paying track record, classifying it as a Consistent Payer among small-cap NBFCs. The payout ratio has fluctuated between 7% and 20%, reflecting a management philosophy of balancing shareholder returns with capital retention for growth. Notably, FY2026 marks the first year of a dual-dividend structure (interim + final), doubling the total payout to ₹1.00 per share. The payout ratio declined to 7% in FY2025 when earnings doubled but dividends remained flat — suggesting management prioritises a stable absolute dividend over a fixed payout ratio. The FY2026 increase to ₹1.00 indicates growing confidence in earnings sustainability. No dividend cuts or suspensions have been observed in the tracked period (Source: Screener.in).
Dar Credit & Capital Limited – Financial Performance Analysis
5-Year Financial Trend (₹ Crore)
| Metric | FY2022 | FY2023 | FY2024 | FY2025 | FY2026 |
|---|---|---|---|---|---|
| Revenue | 25 | 25 | 33 | 41 | 50 |
| PAT | 3 | 3 | 4 | 7 | 10.13 |
| EPS (₹) | 2.56 | 2.72 | 3.69 | 7.04 | 7.10 |
| Total Assets | 170 | 189 | 237 | 223 | 294 |
| Borrowings | 107 | 122 | 167 | 144 | 184 |
Operating Leverage: Revenue grew 20.92% while PAT grew 43.89% in FY2026. This indicates strong positive operating leverage — the company is converting incremental revenue into profits at more than double the rate. EBITDA growth at 18.55% suggests that operating efficiency improvements at the PAT level are partly driven by lower provisioning or tax efficiencies rather than pure operating margin expansion. The 5-year revenue CAGR of 13% trails the profit CAGR of 25%, confirming that margins have expanded structurally over the period.
Dar Credit & Capital Limited – Cash Flow Analysis
Cash Flow Statement (₹ Crore)
| Cash Flow | FY2022 | FY2023 | FY2024 | FY2025 | FY2026 |
|---|---|---|---|---|---|
| Operating | 11 | -5 | -21 | 27 | -29 |
| Investing | -11 | 14 | 4 | 4 | -8 |
| Financing | 0 | 0 | 28 | -42 | 39 |
| Net Cash Flow | -1 | 9 | 11 | -11 | 3 |
⚠ Critical Finding: Negative Operating Cash Flow
DCCL reported PAT of ₹10.13 Crore in FY2026 but operating cash flow was -₹29 Crore. This ₹39 Crore gap means reported profits are accrual-based — actual cash collections lagged significantly behind loan disbursements. The 34.95% AUM growth consumed operating cash as new loan originations outpaced repayments. The dividend of ₹1.43 Crore is effectively funded by ₹39 Crore financing inflows (NCD issuances of ₹61 Crore and IPO proceeds of ₹25.66 Crore). While negative OCF is common for rapidly growing NBFCs, it has been negative in 3 of the last 4 years — this pattern demands scrutiny. Cash flow must normalise as the loan book seasons (Source: Screener.in).
Dar Credit & Capital Limited – Balance Sheet Strength
Capital Structure (FY2026)
| Equity Capital | ₹14.28 Cr |
| Reserves | ₹89.57 Cr |
| Net Worth | ₹103.85 Cr |
| Total Borrowings | ₹184 Cr |
| Debt-to-Equity | 1.77x |
| Total Assets | ₹293.90 Cr |
Balance Sheet Assessment
DCCL's balance sheet is typical of a small NBFC — borrowing-heavy with a debt-to-equity ratio of 1.77x. The net worth grew 41.25% YoY to ₹103.85 Crore, boosted by IPO proceeds and retained earnings. However, borrowings also surged from ₹144 Crore to ₹184 Crore (up 27.8%), driven by NCD issuances of ₹61 Crore. Total assets expanded 31.8% to ₹293.90 Crore. The company's leverage is moderate by NBFC standards (RBI allows up to 7x for NBFCs), but the reliance on market borrowings rather than deposits increases funding cost risk. The P/B ratio of 0.56 means the stock trades at a 44% discount to book value — a significant margin of safety if the asset quality is sound.
Dar Credit & Capital Limited – Dividend Sustainability Analysis
Sustainability Metrics
| Payout Ratio | 14.10% |
| Dividend Coverage | 7.10x |
| Dividend Outflow | ₹1.43 Cr |
| OCF Coverage | Negative |
| Earnings Trend | Growing (44% YoY) |
Verdict: Moderately Sustainable
Positives: The payout ratio of 14.10% is conservative and well-covered by earnings at 7.10x. The dividend outflow of ₹1.43 Crore is modest relative to the ₹10.13 Crore PAT. Earnings are growing strongly at 44% YoY. Concerns: Operating cash flow is negative at -₹29 Crore, meaning the dividend is not funded by cash-generating operations. Borrowings are increasing (₹144 Cr → ₹184 Cr), and the company is paying dividends while relying on external financing. If the loan book faces asset quality stress or collection delays, both earnings and cash flows could deteriorate simultaneously. Classification: Moderately Sustainable — sustainable from an earnings perspective but vulnerable from a cash flow perspective.
Dar Credit & Capital Limited – Peer Comparison
| Company | Div. Yield | P/E | P/B | ROE | Category |
|---|---|---|---|---|---|
| Dar Credit & Capital | 2.39% | 5.90 | 0.56 | 11.42% | Small NBFC |
| Muthoot Finance | 1.04% | ~15 | ~2.5 | ~20% | Gold Loan NBFC |
| Manappuram Finance | 0.97% | ~10 | ~1.5 | ~15% | Gold Loan NBFC |
| CreditAccess Grameen | 0.69% | ~12 | ~2.0 | ~18% | Microfinance |
| Arman Financial | 0.08% | ~20 | ~3.0 | ~15% | Microfinance |
DCCL offers the highest dividend yield (2.39%) among comparable NBFCs, but trades at the lowest valuation multiples (P/E 5.90, P/B 0.56). This valuation gap reflects the market's preference for larger, established NBFCs with stronger brand recognition and better liquidity. DCCL's ROE of 11.42% trails Muthoot Finance (~20%) and CreditAccess Grameen (~18%), indicating lower capital efficiency. The higher yield is partly a function of lower share price rather than superior dividend policy. Investors should weigh the yield premium against DCCL's smaller scale, lower liquidity (only 518 shareholders), and limited institutional interest (Source: IndMoney, StockAnalysis).
Dar Credit & Capital Limited – Promoter Impact Analysis
Shareholding Pattern (Jun 2026)
| Promoters | 69.14% |
| DIIs | 6.65% |
| Public | 24.21% |
| Total Shareholders | 518 |
Promoter Dividend Income
| Total Dividend Outflow | ₹1.43 Cr |
| Promoter Share (69.14%) | ₹0.99 Cr |
| DII Share (6.65%) | ₹0.10 Cr |
| Public Share (24.21%) | ₹0.35 Cr |
With promoters holding 69.14% of equity, they receive the majority benefit of any dividend — approximately ₹0.99 Crore of the total ₹1.43 Crore outflow. This alignment means promoters have a direct financial incentive to maintain dividends. However, the modest absolute amount (under ₹1 Crore) is unlikely to be the primary motivation — promoters benefit more from capital appreciation of their ~₹41 Crore stake. The low free float of 24.21% and only 518 total shareholders indicate limited market liquidity, which contributes to share price volatility and the current valuation discount.
Dar Credit & Capital Limited – Taxation Analysis
Dividend Tax Rules in India
Since April 2020, dividends are taxable in the hands of the shareholder at their applicable income tax slab rate. The company deducts TDS at 10% if total dividend income from a company exceeds ₹5,000 in a financial year. Investors can claim TDS credit while filing returns. No DDT (Dividend Distribution Tax) is applicable on the company.
Worked Example: Tax Impact on DCCL Dividend
| Shares Held | 1,000 |
| Dividend Per Share | ₹1.00 |
| Gross Dividend | ₹1,000 |
| Investor Tax Slab | 30% |
| Tax on Dividend | ₹300 |
| Net Dividend (Post-Tax) | ₹700 |
| Effective Yield (at CMP ₹41.90) | 1.67% |
| TDS Applicable | No (Below ₹5,000 threshold) |
Note: For the 30% slab, the pre-tax yield of 2.39% reduces to an effective yield of 1.67% after tax. For the 20% slab, effective yield would be 1.91%. Investors in lower tax brackets retain a greater proportion of the dividend.
Dar Credit & Capital Limited – Key Risks
- 1.Persistent Negative Operating Cash Flow: OCF has been negative in 3 of the last 4 years (-₹5 Cr, -₹21 Cr, -₹29 Cr). If loan collections continue to lag disbursements, the company may face liquidity stress even while reporting accrual profits.
- 2.Concentration Risk: Operating in only 6 states with 35 branches, DCCL is vulnerable to regional economic downturns, natural disasters, or political disruptions, particularly in its home market of West Bengal and Bihar.
- 3.Asset Quality Uncertainty: NPA data is not publicly disclosed in detail. For a small-ticket lender serving underserved borrowers, asset quality can deteriorate rapidly during economic stress. No GNPA/NNPA ratios are available for independent verification.
- 4.Liquidity and Trading Risk: With only 518 shareholders and minimal free float (24.21%), the stock is extremely illiquid. Large buy or sell orders can cause disproportionate price movements. Exit at desired prices may be difficult.
- 5.Borrowing Dependency: Total borrowings of ₹184 Crore against net worth of ₹103.85 Crore (D/E 1.77x) expose the company to interest rate risk. NCD issuances of ₹61 Crore carry fixed coupon obligations regardless of business performance.
- 6.Regulatory Risk: As an RBI-regulated NBFC, the company faces evolving compliance requirements including digital lending norms, fair practices code updates, and potential capital adequacy changes that could constrain growth.
- 7.Promoter Dominance: At 69.14% promoter holding, minority shareholders have limited influence over capital allocation, dividend decisions, and related-party transactions.
Dar Credit & Capital Limited – What To Monitor
- 1.Operating Cash Flow Turnaround: Monitor quarterly cash flow statements for OCF turning positive. A sustained negative OCF beyond FY2027 would signal structural collection inefficiency rather than growth-phase volatility.
- 2.GNPA and NNPA Disclosure: Watch for asset quality metrics in quarterly results. Any spike above 3-4% GNPA would pressure both earnings and dividend sustainability.
- 3.AUM Growth vs Collection Efficiency: If AUM growth exceeds 30% YoY but collection efficiency drops below 95%, the growth is creating future risk rather than value.
- 4.Cost of Borrowing Trend: With ₹184 Crore borrowings and NCD issuances, monitor the average cost of borrowing. Any increase above current levels will compress NIMs and pressure profitability.
- 5.Branch Expansion and Geographic Diversification: Track the pace of new branch additions beyond the current 35 and entry into new states. Faster diversification reduces concentration risk.
- 6.Promoter Holding Changes: Any reduction in the 69.14% promoter holding, especially through market sales rather than dilution, would be a red flag.
- 7.Institutional Interest: Currently, only 6.65% DII holding and no FII holding. Institutional entry would validate the business model and improve liquidity.
Dar Credit & Capital Limited – Conclusion
Dar Credit & Capital Limited's FY2026 total dividend of ₹1.00 per share represents a significant step-up from the previous year, offering a 2.39% yield — the highest among comparable NBFC peers. The company's earnings growth is impressive at 43.89% PAT growth, and the conservative 14.10% payout ratio provides a comfortable cushion. However, the persistently negative operating cash flow (-₹29 Crore) is the single most important red flag — dividends funded by borrowings rather than operations are inherently fragile. The stock's deep discount to book value (P/B 0.56) and extremely low P/E (5.90) suggest either hidden value or hidden risks. With only 518 shareholders and limited free float, this is a high-conviction, low-liquidity opportunity. Investors should weigh the attractive yield and growth metrics against the cash flow concerns, asset quality opacity, and liquidity risks before making investment decisions.
Frequently Asked Questions – Dar Credit & Capital Dividend
What dividend has Dar Credit & Capital Limited announced for FY2026?
What is the dividend yield of Dar Credit & Capital (DCCL)?
What is the record date for Dar Credit & Capital's FY2026 final dividend?
What is the ex-dividend date for DCCL's final dividend?
When will Dar Credit & Capital's dividend be paid?
Who is eligible for Dar Credit & Capital's FY2026 dividend?
How is DCCL dividend income taxed in India?
Is Dar Credit & Capital's dividend sustainable?
What is Dar Credit & Capital's dividend history?
What should investors monitor about Dar Credit & Capital?
What is the payout ratio of Dar Credit & Capital for FY2026?
How does DCCL's dividend yield compare to other NBFCs?
Disclaimer
This article is published by ShareBazaar Online for informational and educational purposes only. It does not constitute investment advice, a recommendation to buy, sell, or hold any security, or an offer to invest. All data and analysis are based on publicly available information and sources cited within the article. While every effort has been made to ensure accuracy, ShareBazaar Online does not guarantee the completeness or timeliness of the information. Stock markets are subject to risks, and past performance is not indicative of future results. Investors should consult a SEBI-registered financial advisor before making any investment decisions. ShareBazaar Online and its team do not hold any positions in the securities discussed in this article. Tax calculations are illustrative and may vary based on individual circumstances — consult a qualified tax professional for personalised advice.