
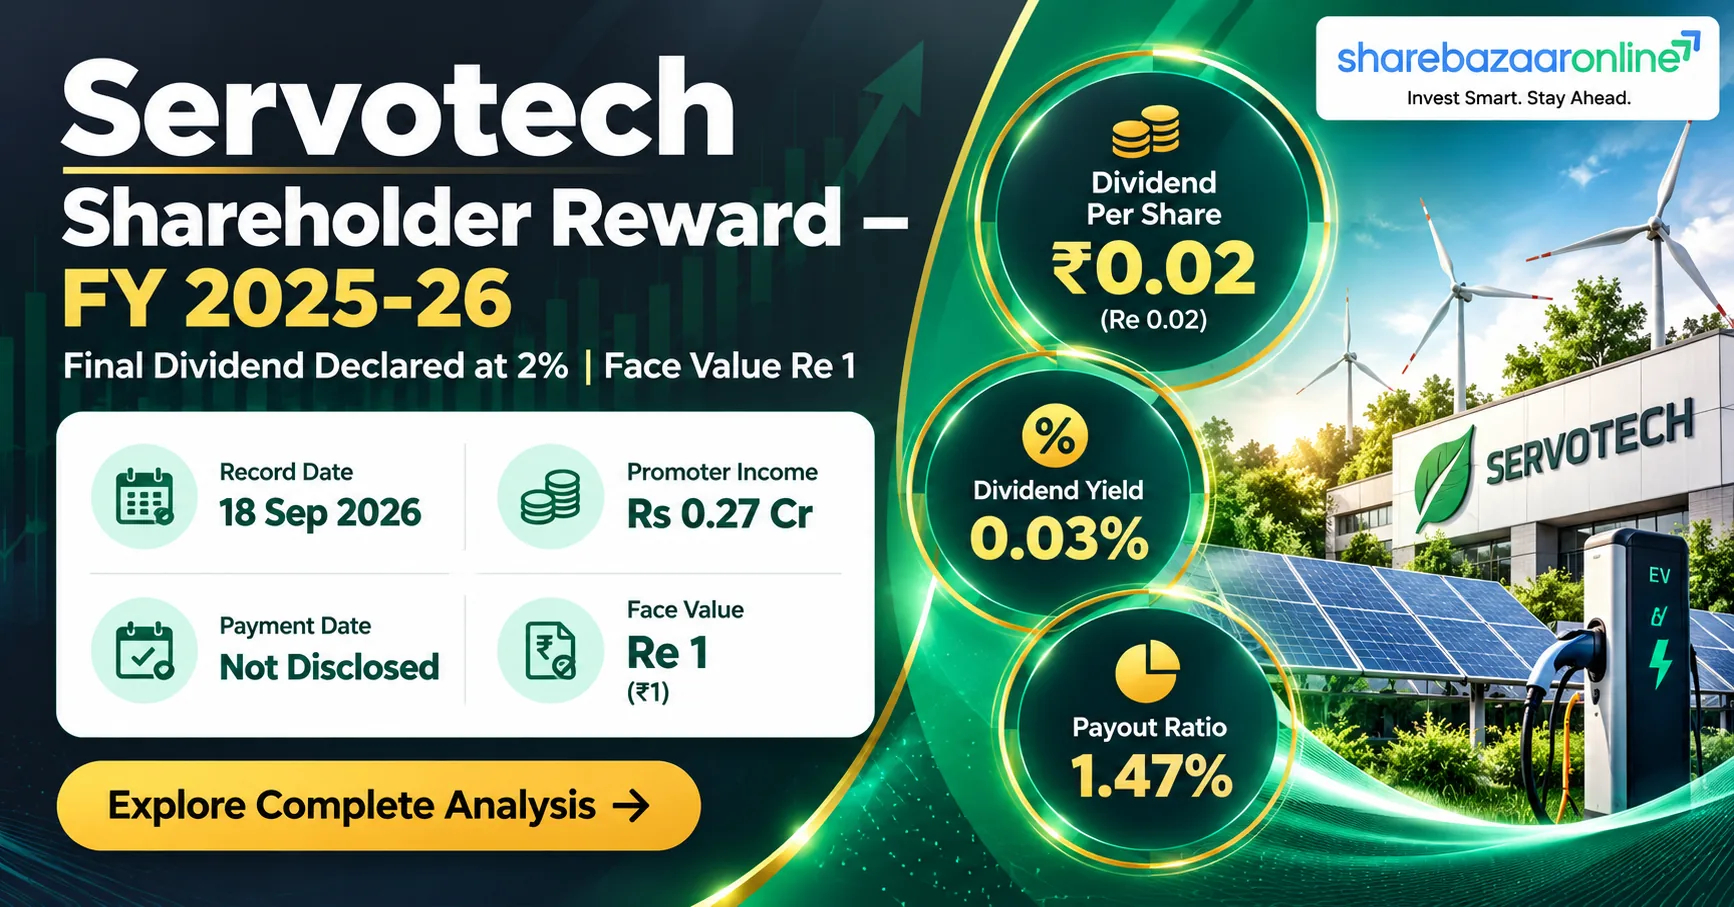
Dividend Snapshot – Servotech Renewable Power System Limited
Dividend Details
| Company | Servotech Renewable Power System Ltd |
| NSE Symbol | SERVOTECH |
| ISIN | INE782X01033 |
| Dividend Type | Final Dividend |
| Dividend Per Share | ₹0.02 |
| Dividend % | 2% (on ₹1 Face Value) |
| Face Value | ₹1 |
| Financial Year | 2025–2026 |
Yield & Market Data
| CMP (Approx.) | ₹69.20 |
| Dividend Yield | 0.03% |
| Headline vs Real Yield | 2% vs 0.03% (69x gap) |
| Market Cap | ₹1,563 Cr |
| Payout Ratio (Consol.) | 1.47% |
| Dividend Outflow | ₹0.45 Cr |
| Earnings Coverage | 74.5x |
| Promoter Holding | 58.61% |
Face Value Illusion Alert: The headline “2% dividend” is calculated on ₹1 face value, not market price. At a CMP of ₹69.20, the actual dividend yield is only 0.03% — a 69x gap between the headline percentage and the real return to investors. Servotech is not a dividend stock — the company retains 98.5% of its earnings.
Servotech Renewable Power System Limited – Company Overview
Servotech Renewable Power System Limited (formerly Servotech Power Systems Limited) is a New Delhi-based company operating in the renewable energy and EV charging infrastructure space. Listed on both NSE and BSE, the company manufactures solar panels, EV chargers, LED lighting solutions, and smart energy management systems. It has expanded aggressively through subsidiaries including Servotech EV Infra, Rebreathe Medical Devices, and an international arm (Servotech Renewable International FZCO).
In FY26, consolidated revenue stood at ₹671.64 Cr with a PAT of ₹30.80 Cr. The company operates in a single business segment. Its board recommended a final dividend of 2% (Re 0.02 per share) for FY 2025–2026, subject to AGM approval. The record date was 18 September 2026 and the ex-date was the same. Since both dates have already passed, eligibility for this dividend has been determined.
CIN: L31200HR2004PLC136025 | BSE Code: 543985 | NSE: SERVOTECH | Sector: Renewable Energy / EV Infrastructure
Servotech Renewable Power System Limited – Financial Analysis
Consolidated P&L Highlights (FY26 vs FY25)
| Metric | FY26 | FY25 | Growth |
|---|---|---|---|
| Revenue from Operations | ₹671.64 Cr | ₹674.44 Cr | -0.4% |
| Total Expenses | ₹634.94 Cr | ₹631.99 Cr | +0.5% |
| PBT | ₹40.42 Cr | ₹44.81 Cr | -9.8% |
| PAT | ₹30.80 Cr | ₹32.64 Cr | -5.6% |
| Basic EPS (₹) | ₹1.49 | ₹1.46 | +2.1% |
Consolidated revenue declined marginally by 0.4% to ₹671.64 Cr in FY26 while expenses grew, compressing PBT by 9.8%. PAT fell 5.6% to ₹30.80 Cr. Material costs rose sharply to ₹500.08 Cr, and other expenses surged to ₹63.36 Cr. The standalone entity performed better with 8.4% revenue growth and 8.3% PAT growth, suggesting subsidiary operations dragged consolidated performance. Basic EPS marginally improved to ₹1.49 due to share dilution adjustments. The operating leverage is negative at consolidated level — revenue flat but profits declining indicates margin pressure.
Servotech Renewable Power System Limited – Dividend History
Dividend Track Record
| Financial Year | Dividend Type | DPS (₹) | Dividend % |
|---|---|---|---|
| FY 2025–26 | Final | 0.02 | 2% |
| FY 2024–25 | Final | 0.05 | 5% |
| FY 2023–24 | Final | 0.05 | 5% |
| FY 2022–23 | — | Nil | 0% |
| FY 2021–22 | — | Nil | 0% |
| FY 2020–21 | — | Nil | 0% |
| FY 2019–20 | — | Nil | 0% |
| FY 2018–19 | — | Nil | 0% |
| FY 2017–18 | — | Nil | 0% |
| FY 2016–17 | — | Nil | 0% |
Classification: Irregular Payer. Servotech began paying dividends only in FY24 after years of zero payouts. The FY26 dividend of Re 0.02 is a 60% reduction from the previous Re 0.05 level. Over a 10-year window, dividends were paid in only 3 of 10 years. This is not a company with a reliable dividend track record — the dividend history suggests token payouts rather than a structured shareholder return policy. (Source: Screener.in, BSE filings)
Expert Commentary – Servotech Renewable Power System Dividend
Servotech’s FY26 final dividend of Re 0.02 per share delivers a real yield of just 0.03% — among the lowest in the listed universe. The “2% dividend” headline is a classic face-value illusion: it is 2% of ₹1 face value, not 2% of the ₹69 market price. For an investor holding ₹1 lakh worth of Servotech shares (approximately 1,445 shares), the gross dividend income is approximately ₹29.
The more pressing concern is the cash flow situation. Consolidated OCF was negative ₹1.94 Cr in FY26 (and negative ₹55.41 Cr in FY25). The company’s operations are not generating cash — the entire dividend is funded through borrowed money. Total borrowings surged 178.6% from ₹75.14 Cr to ₹209.30 Cr, while receivables ballooned to ₹250.46 Cr (136 debtor days). Notably, FII holdings collapsed from 2.89% to just 0.05%, signalling institutional exit.
The dividend is affordable (payout ratio just 1.47%) but nearly irrelevant to shareholder returns. Servotech is a growth-stage company deploying capital aggressively into EV charging and solar infrastructure — the dividend appears to be a corporate formality rather than a genuine income proposition.
Servotech Renewable Power System Limited – Future Outlook
Servotech operates in structurally growing sectors — EV charging infrastructure and solar energy — both benefiting from government policy tailwinds. The company’s aggressive capex of ₹103.10 Cr in FY26 (vs ₹18.12 Cr in FY25) indicates ambitious expansion. PPE nearly tripled from ₹66.10 Cr to ₹153.30 Cr on a consolidated basis.
However, the execution risk is material. Revenue growth stalled at the consolidated level despite heavy investment, and profitability declined. The 136-day receivables cycle suggests collection challenges or aggressive revenue recognition. If receivable conversion does not improve, working capital pressure will intensify further. The company’s international expansion through Servotech Renewable International FZCO and subsidiary restructuring (Servotech Siliguri Strikers and Dream League of India as step-down subsidiaries) add complexity.
Dividend growth is unlikely in the near term. Given the 60% dividend cut from FY25 to FY26 and the capital-intensive expansion phase, investors should evaluate Servotech primarily on its growth trajectory in EV and solar, not as a dividend income stock.
Servotech Renewable Power System Dividend Announcement Summary
On 30 April 2026, the Board of Directors of Servotech Renewable Power System Limited approved and recommended a final dividend of 2% (Re 0.02 per equity share) on a face value of ₹1 for the financial year 2025–2026. The dividend is subject to shareholders’ approval at the Annual General Meeting. The total dividend outflow is approximately ₹0.45 Cr on 22.58 Cr equity shares.
The board simultaneously approved audited standalone and consolidated financial results for Q4 and FY26. The company reported standalone PAT of ₹36.26 Cr (up 8.3% YoY) and consolidated PAT of ₹30.80 Cr (down 5.6% YoY). The announcement was signed by Rupinder Kaur, Company Secretary, and the financials were signed by Managing Director Raman Bhatia (DIN: 00153827). Statutory auditors Rohit KC Jain & Co (FRN: 020422N) issued an unmodified opinion on both standalone and consolidated results.
Servotech Renewable Power System Dividend – Key Dates Timeline
Announcement Date
30 Apr 2026
Board Meeting
Ex-Dividend Date
18 Sep 2026
Already Passed
Record Date
18 Sep 2026
Already Passed
Payment Date
Within 30 Days of AGM
Subject to AGM Approval
The ex-dividend date and record date have already passed. Only shareholders who held SERVOTECH shares in their demat account on 18 September 2026 are eligible for this dividend. New buyers after this date will not receive this dividend payment.
Servotech Renewable Power System Limited Dividend Yield Analysis
Yield Computation
| Dividend Per Share | ₹0.02 |
| CMP | ₹69.20 |
| Dividend Yield | 0.03% |
| Headline Dividend % | 2% |
| Illusion Multiplier | 69x gap |
Yield Reality Check
The 0.03% yield makes Servotech one of the lowest-yielding dividend payers in India. For context, a savings bank account yields approximately 2.5–3.0%, which is nearly 100x higher than this dividend yield. The low yield is not caused by a falling share price inflating yield artificially — it is simply because the dividend itself is negligible at Re 0.02 per share. Even at the stock’s 52-week low, the yield would remain well below 0.1%. This is structurally a growth stock with a token dividend, not an income-generating investment.
Servotech Renewable Power System Dividend History Analysis
Servotech’s dividend history reveals an irregular and declining pattern. The company paid zero dividends from FY17 through FY23 — seven consecutive years with no payouts. It initiated dividends in FY24 at Re 0.05 per share (5%), maintained the same level in FY25, and then cut the dividend by 60% in FY26 to Re 0.02 per share (2%).
The dividend cut occurred despite standalone profits growing 8.3%, which suggests a deliberate management decision to conserve cash for expansion rather than a profitability-driven reduction. Total dividend outflow fell from approximately ₹1.12 Cr (FY25) to ₹0.45 Cr (FY26). For a company with ₹671 Cr in revenue, this outflow is inconsequential — representing just 0.07% of revenue.
Verdict: Servotech is classified as an Irregular Payer with a declining trend. There is no established commitment to dividend consistency or growth. Investors seeking reliable dividend income should look elsewhere. (Sources: BSE filings, Screener.in)
Servotech Renewable Power System – Financial Performance Analysis
Standalone Performance
| Revenue FY26 | ₹636.73 Cr |
| Revenue Growth | +8.4% |
| PAT FY26 | ₹36.26 Cr |
| PAT Growth | +8.3% |
| EPS | ₹1.61 |
| ROE | 13.57% |
Consolidated Performance
| Revenue FY26 | ₹671.64 Cr |
| Revenue Growth | -0.4% |
| PAT FY26 | ₹30.80 Cr |
| PAT Growth | -5.6% |
| EPS | ₹1.49 |
| ROE | 10.41% |
A stark standalone vs consolidated divergence emerges. While the parent entity grew revenue 8.4% and PAT 8.3%, consolidated figures show flat revenue and a 5.6% PAT decline. This indicates subsidiaries are destroying value at the group level. Servotech EV Infra reported a loss of ₹0.91 Cr on revenue of just ₹1.17 Cr. Servotech Foundation had nil revenue. Only Rebreathe Medical Devices contributed positively with ₹0.40 Cr PAT on ₹31.71 Cr revenue. The associate Rhine Solar Limited contributed ₹0.86 Cr profit. Investors should monitor whether subsidiary performance improves or continues to erode consolidated returns.
Servotech Renewable Power System – Cash Flow Analysis
⚠ Critical Finding: Operating Cash Flow is NEGATIVE for the second consecutive year at both standalone and consolidated levels. The dividend is being funded through borrowings, not operations.
Consolidated Cash Flow (FY26)
| PBT | ₹40.42 Cr |
| Operating Cash Flow | -₹1.94 Cr |
| Investing Cash Flow | -₹113.54 Cr |
| Financing Cash Flow | +₹143.65 Cr |
| Capex | ₹103.10 Cr |
| Free Cash Flow (OCF-Capex) | -₹105.05 Cr |
Cash Flow Quality Assessment
PAT vs OCF Gap: Consolidated PAT is ₹30.80 Cr positive, but OCF is ₹1.94 Cr negative. This ₹32.74 Cr gap is primarily explained by ₹90.67 Cr increase in trade receivables (net of payables increase). Reported profits are not converting into cash.
Receivables Buildup: Trade receivables surged to ₹250.46 Cr (136 debtor days), consuming all operating cash. Revenue booked but not collected undermines earnings quality.
Funding Source: The company raised ₹134.16 Cr in net loan proceeds and ₹22.97 Cr from share capital/reserves. Operations and dividends are entirely funded by debt and equity issuance, not by business cash generation.
Servotech Renewable Power System – Balance Sheet Strength
Consolidated Balance Sheet (FY26)
| Total Assets | ₹685.04 Cr |
| Total Equity | ₹295.87 Cr |
| Total Borrowings | ₹209.30 Cr |
| Cash + Bank Balances | ₹70.71 Cr |
| Net Debt | ₹138.59 Cr |
| Debt-to-Equity | 0.71x |
| Borrowings Growth YoY | +178.6% |
Balance Sheet Observations
Total assets grew 70.5% from ₹401.84 Cr to ₹685.04 Cr, driven by massive capex (PPE surged from ₹66.10 Cr to ₹153.30 Cr) and receivables expansion. However, this growth was financed primarily through debt, not internal accruals.
Borrowings nearly tripled from ₹75.14 Cr to ₹209.30 Cr (₹134 Cr increase). Current borrowings alone stand at ₹155.69 Cr — representing 74% of total debt, indicating heavy reliance on short-term financing for what appears to be long-term asset creation. This maturity mismatch is a structural risk.
Cash coverage of dividend is comfortable at 156.6x, but this is misleading — the dividend is tiny. The real question is whether cash covers debt servicing, and with net debt at ₹138.59 Cr against negative OCF, the answer is no.
Servotech Renewable Power System Dividend Sustainability Analysis
Four-Test Sustainability Scorecard
✔ Earnings Coverage: PASS
74.5x coverage — payout ratio of just 1.47%. Earnings easily support the token dividend.
✘ OCF Coverage: FAIL
Consolidated OCF is negative ₹1.94 Cr. Operations do not generate cash to fund any dividend.
✘ FCF Coverage: FAIL
FCF is deeply negative at ₹105.05 Cr due to heavy capex. Dividend is funded by borrowings.
✔ Cash Coverage: PASS
156.6x cash coverage. Cash reserves of ₹70.71 Cr easily cover the ₹0.45 Cr outflow.
Verdict: Conditionally Sustainable. The dividend is trivially small relative to earnings and cash reserves, so it is easily affordable. However, the underlying business is not generating positive operating cash flow, and the company is adding debt rapidly. The dividend survives only because it is negligible (₹0.45 Cr against ₹209 Cr in borrowings). If Servotech ever attempts a meaningful dividend, sustainability would immediately become questionable.
Servotech Renewable Power System – Peer Comparison
Servotech vs Renewable Energy / EV Charging Peers
| Metric | Servotech | Sector Avg* |
|---|---|---|
| Dividend Yield | 0.03% | 0.3–1.0% |
| Payout Ratio | 1.47% | 10–25% |
| ROE | 10.41% | 12–18% |
| Debt-to-Equity | 0.71x | 0.3–0.8x |
| Debtor Days | 136 days | 60–90 days |
| OCF/PAT | Negative | 60–80% |
*Sector averages are indicative based on comparable listed renewable energy and EV infrastructure companies. Individual peer data may vary. (Sources: Screener.in, Moneycontrol)
Servotech significantly underperforms peers on dividend yield, payout ratio, and cash flow quality. Its 136-day debtor cycle is notably worse than the sector norm of 60–90 days, raising questions about revenue quality. The negative OCF-to-PAT ratio is a red flag — most peers convert at least 60–80% of profits into operating cash. The 1.47% payout ratio is among the lowest in the listed space, confirming that dividend distribution is not a management priority.
Servotech Renewable Power System – Promoter Impact Analysis
Shareholding Pattern
| Promoter Holding | 58.61% |
| FII Holding | 0.05% |
| DII Holding | 0.24% |
| Public & Others | 41.10% |
Promoter Dividend Income
| Total Dividend Outflow | ₹0.45 Cr |
| Promoter Share (58.61%) | ₹0.26 Cr |
| Minority Share (41.39%) | ₹0.19 Cr |
The promoter group receives approximately ₹0.26 Cr from this dividend — a negligible amount that provides no meaningful personal income. This confirms the dividend is a corporate governance formality rather than a wealth extraction mechanism.
FII Exodus: The most alarming shareholding development is the FII holding collapse from 2.89% (Mar 2025) to 0.05% (Jun 2026). Foreign institutional investors have virtually exited the stock. This massive institutional selling, combined with near-zero DII interest (0.24%), means Servotech is almost entirely held by promoters and retail investors. The absence of institutional ownership increases liquidity risk and reduces price discovery quality. (Source: BSE shareholding pattern filings)
Servotech Renewable Power System Dividend – Taxation Analysis
Indian Dividend Tax Rules (FY 2025–26)
Under current Indian tax law, dividends are taxable as “Income from Other Sources” in the hands of shareholders at their applicable income tax slab rate. TDS at 10% is deducted by the company if total dividend income from a single company exceeds ₹5,000 in a financial year. Given Servotech’s DPS of Re 0.02, an investor would need to hold over 2,50,000 shares (worth ₹1.73 Cr at CMP) to breach the TDS threshold. For most retail investors, no TDS will be deducted.
Worked Example: 1,000 Shares at 30% Tax Slab
| Shares Held | 1,000 |
| Dividend Per Share | ₹0.02 |
| Gross Dividend | ₹20.00 |
| TDS Deducted | ₹0 (below ₹5,000 threshold) |
| Tax at 30% Slab | ₹6.00 |
| Net Dividend After Tax | ₹14.00 |
| Effective Post-Tax Yield | 0.02% |
At the 30% tax slab, an investor with 1,000 shares receives just ₹14 net dividend on a ₹69,200 investment — an effective post-tax yield of 0.02%. The tax liability (₹6) is higher than many UPI transaction fees.
Servotech Renewable Power System Dividend – Key Risks
Negative Operating Cash Flow Risk
OCF has been negative for two consecutive years (FY25: -₹55.41 Cr, FY26: -₹1.94 Cr consolidated). Operations are not self-sustaining and rely on external funding. If borrowing costs rise or credit lines tighten, the company faces liquidity stress.
Receivables Concentration Risk
Trade receivables at ₹250.46 Cr represent 37.3% of total assets and 136 debtor days. If even 10% of receivables become bad debts, it would wipe out the entire annual profit. Government and institutional clients in EV/solar often have extended payment cycles.
Debt Escalation Risk
Borrowings surged 178.6% to ₹209.30 Cr with 74% being short-term debt. Finance costs rose to ₹12.13 Cr. With negative OCF, debt servicing is entirely dependent on refinancing. Any credit market disruption could trigger a liquidity crisis.
FII Exit and Liquidity Risk
FII holding collapsed from 2.89% to 0.05%. Near-zero institutional ownership means thinner liquidity, wider bid-ask spreads, and greater vulnerability to retail sentiment swings. It also suggests sophisticated investors found the risk-reward unattractive.
Subsidiary Value Destruction Risk
Standalone PAT grew 8.3% but consolidated PAT fell 5.6%. Subsidiaries like Servotech EV Infra (₹0.91 Cr loss) are eroding group profitability. Investment in subsidiaries grew from ₹2.05 Cr to ₹14.21 Cr without proportionate revenue contribution. Continued losses would impair investments and compress group ROE further.
Policy and Competition Risk
EV charging and solar sectors are heavily dependent on government subsidies (FAME, PLI schemes). Policy changes, subsidy delays, or increased competition from better-capitalized players (Tata Power, Adani Solar) could compress margins and market share.
Servotech Renewable Power System – What To Monitor
Operating Cash Flow Turnaround
Watch for OCF turning positive in Q1/Q2 FY27. Two consecutive years of negative OCF is unsustainable. If H1 FY27 OCF remains negative, the cash flow problem is structural, not cyclical.
Receivables Collection Improvement
Track debtor days quarterly. Any improvement from 136 days toward 90 days would signal better cash conversion. Conversely, further deterioration would raise earnings quality concerns.
Subsidiary Performance
Monitor whether Servotech EV Infra achieves profitability and whether new subsidiaries generate revenue. The standalone-vs-consolidated divergence must narrow for group-level improvement.
Institutional Re-Entry
Any fresh FII or mutual fund buying would signal improved institutional confidence. The current 0.05% FII holding is a near-complete exit — any reversal would be a meaningful positive signal.
Debt Trajectory and Interest Coverage
Borrowings grew 178.6% in one year. Monitor whether FY27 shows debt stabilization or continued expansion. Interest coverage ratio (EBIT/interest) should remain above 3x for comfort.
Revenue Growth Recovery
Consolidated revenue was flat in FY26 despite heavy capex. The ₹103 Cr capex must translate into revenue growth in FY27. If PPE expansion does not generate proportionate revenue, return ratios will compress further.
Servotech Renewable Power System Dividend – Conclusion
Servotech Renewable Power System’s FY26 final dividend of Re 0.02 per share (2% on face value) delivers a real yield of 0.03% — making it one of India’s lowest-yielding dividend declarations. The ₹0.45 Cr total outflow is a rounding error on ₹671 Cr revenue. This is not a dividend stock and should not be evaluated through a dividend investing lens.
The company’s underlying financials reveal a growth-stage business aggressively deploying capital (₹103 Cr capex) into EV charging and solar infrastructure. The trade-off is visible: negative operating cash flow for two consecutive years, borrowings nearly tripling, and a 136-day receivables cycle. Consolidated profitability declined 5.6% despite the standalone entity growing, indicating subsidiaries are consuming capital without proportionate returns.
The positives — sectoral tailwinds, standalone revenue growth, and low payout leaving capital for reinvestment — are offset by the negatives: FII exodus, negative OCF, debt escalation, and subsidiary losses. Investors should evaluate Servotech on its execution capability in EV/solar infrastructure and whether the aggressive investment phase translates into profitable growth, not on dividend income.
Frequently Asked Questions About Servotech Renewable Power System Dividend
What dividend has Servotech Renewable Power System announced for FY26?
What is Servotech Renewable Power System’s dividend yield?
What is the record date for Servotech dividend 2026?
What is the ex-dividend date for Servotech?
When will Servotech pay the FY26 dividend?
Who is eligible for Servotech Renewable Power System dividend?
How is Servotech dividend taxed in India?
Is Servotech Renewable Power System’s dividend sustainable?
What is Servotech’s dividend payout history over the last 10 years?
What should investors monitor regarding Servotech’s dividend going forward?
Why did Servotech cut its dividend from Re 0.05 to Re 0.02 in FY26?
What is Servotech’s current promoter holding and how does it affect dividend?
Disclaimer
This article is published by ShareBazaar Online for informational and educational purposes only. It does not constitute investment advice, a recommendation to buy, sell, or hold any security, or an offer or solicitation for any transaction. All financial data has been sourced from the company’s BSE/NSE filings, Screener.in, and other publicly available sources. While every effort has been made to ensure accuracy, ShareBazaar Online does not guarantee the completeness or reliability of the information. Investors should conduct their own due diligence and consult a qualified financial advisor before making any investment decisions. Past dividend payments are not indicative of future payouts. Dividend declarations are subject to AGM approval and regulatory compliance. ShareBazaar Online and its contributors have no position in the securities discussed. Keyword research metrics marked “NIV” (Not Independently Verified) were estimated where Semrush/Ahrefs data was unavailable — users should verify with Google Keyword Planner directly.