
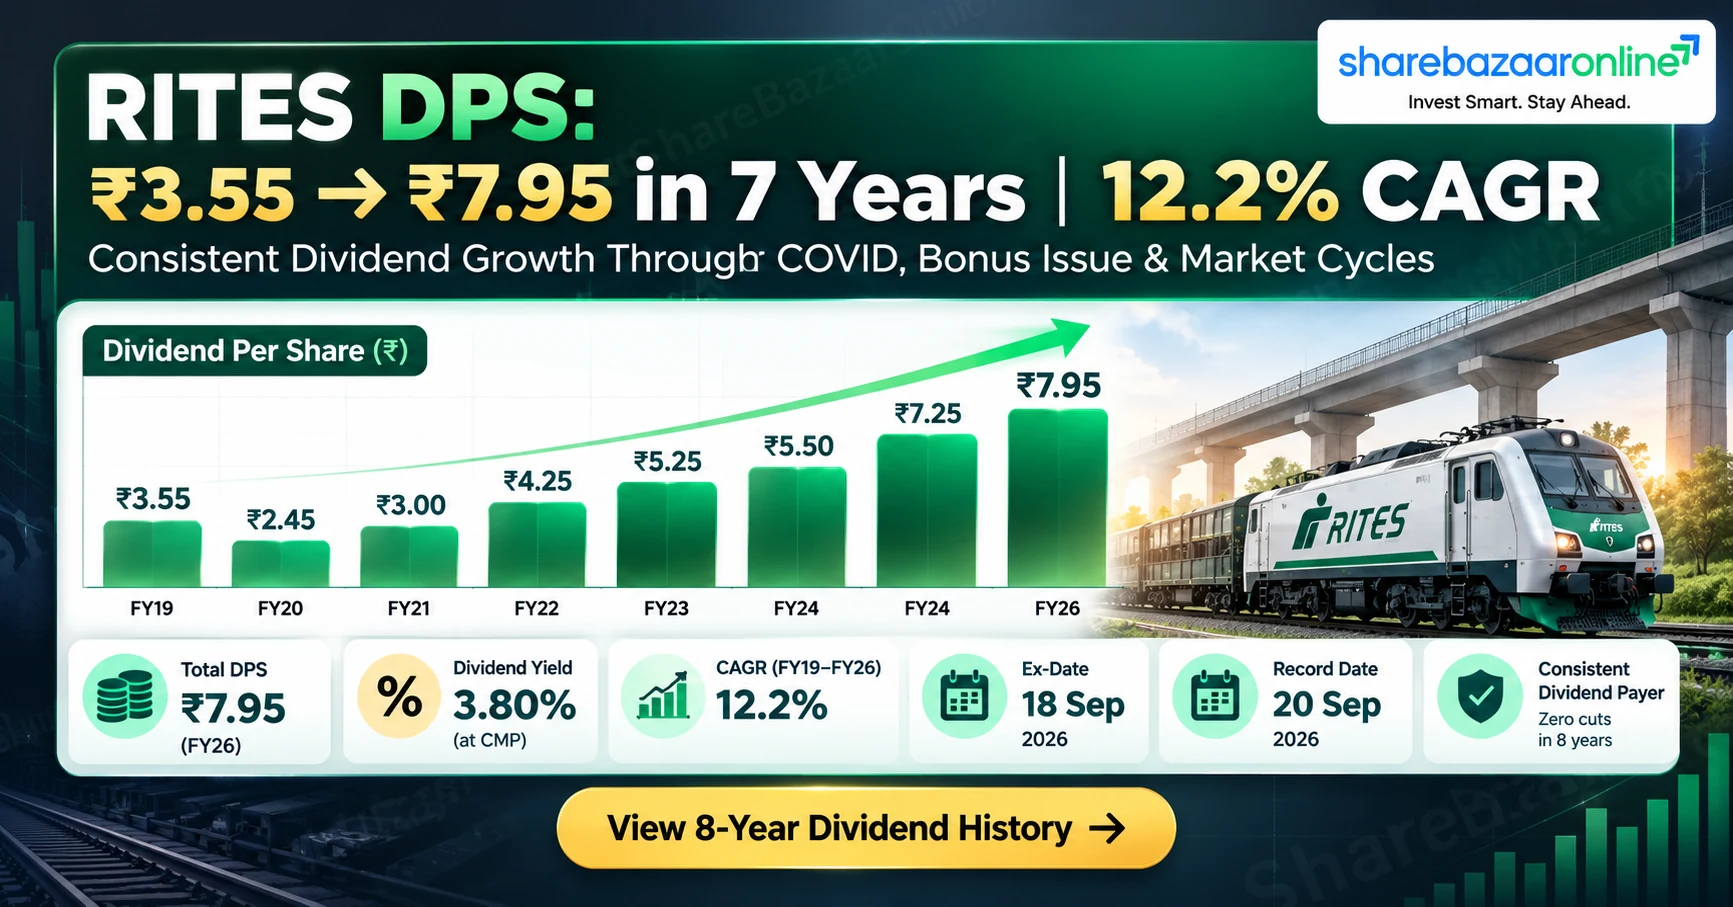
Dividend Snapshot – RITES Limited
Company
RITES Limited
NSE: RITES | BSE: 541556 | ISIN: INE320J01015
Dividend Type
Final Dividend – FY 2025-26
Face Value: ₹10 | Dividend: 27.50%
Dividend Per Share
₹2.75 (Final)
Total FY26: ₹7.95 (3 Interim + Final)
Dividend Yield (Latest CMP ₹209.05)
3.80% (Total FY26)
Final Yield: 1.32% | Announcement Yield: 1.26%
Record Date
20 Sep 2026
Ex-Date
18 Sep 2026
AGM Date
25 Sep 2026
Payment Date
25 Oct 2026
RITES Limited Company Overview
RITES Limited is a Navratna Central Public Sector Enterprise under the Ministry of Railways, specializing in transport infrastructure consultancy, engineering and turnkey solutions. The Government of India holds 72.20% equity stake. Listed on NSE and BSE since July 2018, RITES operates across railways, highways, airports, ports, urban transport and power sectors in over 55 countries. The company executed a 1:1 bonus issue in September 2024, doubling outstanding shares to 48.10 crore. With near-zero debt (₹7 crore borrowings), an asset-light consultancy model and consistent government order inflows, RITES has maintained an uninterrupted dividend track record since listing. Revenue for FY26 stood at ₹2,415 crore with PAT of ₹454 crore.
RITES Limited Financial Analysis
Consolidated P&L – FY26 vs FY25
| Metric | FY26 | FY25 | Growth |
|---|---|---|---|
| Revenue | ₹2,415 Cr | ₹2,196 Cr | +10.0% |
| EBITDA | ₹583 Cr | ₹543 Cr | +7.4% |
| PAT | ₹454 Cr | ₹424 Cr | +7.1% |
| EPS | ₹8.54 | ₹8.01 | +6.6% |
Profitability & Efficiency Ratios
| EBITDA Margin | 24.1% |
| PAT Margin | 18.8% |
| Return on Equity (ROE) | 15.4% |
| Return on Capital Employed (ROCE) | 23.0% |
| Dividend Payout Ratio | 84.2% |
Operating Leverage Assessment
Revenue grew 10.0% while PAT expanded only 7.1%, indicating margin compression. EBITDA growth at 7.4% trailed revenue growth, suggesting rising operating costs — likely from increased employee expenses and project execution costs. While absolute profitability improved, the narrowing gap between revenue and profit growth merits monitoring in upcoming quarters. The consultancy model limits capex but is sensitive to employee and subcontracting cost inflation.
RITES Limited Dividend History
* All pre-FY25 DPS adjusted for 1:1 bonus issue (September 2024). Pre-bonus DPS halved per Ind AS 33.
| Financial Year | Total DPS (₹) | Type | Approx. Yield |
|---|---|---|---|
| FY 2025-26 | ₹7.95 | 3 Interim + Final | 3.80% |
| FY 2024-25 | ₹7.25 | 3 Interim + Final | 3.35% |
| FY 2023-24* | ₹5.50 | Interim + Final | 3.10% |
| FY 2022-23* | ₹5.25 | Interim + Final | 3.00% |
| FY 2021-22* | ₹4.25 | Interim + Final | 2.80% |
| FY 2020-21* | ₹3.00 | Interim + Final | 2.50% |
| FY 2019-20* | ₹2.45 | Interim + Final | 2.20% |
| FY 2018-19* | ₹3.55 | Interim + Final | 3.10% |
DPS CAGR (7 Years, Adjusted): 12.2% — Classified as Consistent Payer with steady growth trajectory.
Expert Commentary on RITES Limited Dividend
The 27.50% headline dividend on face value creates a perception gap — translating to just ₹2.75 per share and a market yield of 1.32% on the current price of ₹209.05. However, the total FY26 payout of ₹7.95 per share across four distributions delivers a cumulative 3.80% yield, which is competitive among PSU infrastructure peers. The critical concern is the 84.2% payout ratio: RITES is distributing nearly ₹85 of every ₹100 earned. While the ₹1,250 crore cash reserve provides a safety net, operating cash flow of ₹327 crore falls short of the ₹382 crore total outflow. This means the dividend is partially funded from accumulated cash reserves rather than current-year cash generation — a pattern that deserves close monitoring.
RITES Limited Future Outlook
RITES is well-positioned to benefit from India's sustained infrastructure push — the ₹11.11 lakh crore railway capital expenditure allocation and the PM Gati Shakti National Master Plan provide a multi-year order visibility. International consultancy mandates across Africa and South-East Asia are growing. However, the company faces margin pressure from rising project execution costs and competitive bidding. The Government of India, as 72.20% promoter, has historically favoured generous dividend distributions from PSU Navratna companies, likely sustaining the high payout ratio. Revenue growth of 10% with PAT growth of 7.1% suggests that while topline expansion continues, profitability scaling is moderating — future dividend increases may slow unless margins stabilize.
RITES Limited Dividend Announcement Summary
RITES Limited's Board of Directors recommended a final dividend of ₹2.75 per share (27.50%) on a face value of ₹10 for FY 2025-26, as part of its board meeting dated 19 May 2026. The company filed an intimation to NSE and BSE on 25 August 2026, confirming the 52nd Annual General Meeting on 25 September 2026 and fixing 20 September 2026 as the record date. The AGM approved the final dividend on 25 September 2026. Including three interim dividends of ₹1.30, ₹2.00 and ₹1.90 per share paid during the year, the total FY26 dividend stands at ₹7.95 per share, representing a total outflow of approximately ₹382 crore to shareholders.
RITES Limited Key Dates Timeline
Board Recommendation
19 May 2026
Exchange Filing (AGM Intimation)
25 August 2026
Ex-Dividend Date
18 September 2026
Record Date
20 September 2026
AGM Approval
25 September 2026
Expected Payment Date
25 October 2026
Note: The record date (20 September 2026) fell on a Sunday. Under T+1 settlement, the ex-dividend date was set to the preceding trading day — Friday, 18 September 2026. Only shareholders holding RITES shares in their demat account at close of trading on 17 September 2026 were eligible for this final dividend.
RITES Limited Dividend Yield Analysis
Final Dividend Yield
| DPS (Final) | ₹2.75 |
| CMP (30 Sep 2026) | ₹209.05 |
| Final Yield on CMP | 1.32% |
| Final Yield on Announcement Price | 1.26% |
Total FY26 Yield
| Total DPS (FY26) | ₹7.95 |
| CMP (30 Sep 2026) | ₹209.05 |
| Total FY26 Yield on CMP | 3.80% |
| Total FY26 Yield on Announcement Price | 3.65% |
Yield Reality Check
The 27.50% headline figure represents the percentage of face value (₹10), not the market yield. The actual market yield on a ₹209 stock is 1.32% for this final tranche alone. The full-year yield of 3.80% is competitive for PSU infrastructure stocks but comes at the cost of an elevated 84.2% payout ratio. The yield is not inflated by share price collapse — RITES trades within 5% of its announcement-day price — confirming this is a genuine earnings-backed yield, not a value trap signal.
RITES Limited Dividend History Analysis
RITES has paid dividends every year since its 2018 IPO — a 100% consistency record across eight financial years. On a bonus-adjusted basis, DPS has grown from ₹3.55 in FY19 to ₹7.95 in FY26, delivering a 12.2% CAGR. Notably, the company increased dividends even during COVID-affected FY21, demonstrating resilience. The shift from two annual payouts (interim + final) to four distributions starting FY25 reflects government pressure to accelerate cash returns to the exchequer. There have been zero dividend cuts or suspensions. Classification: Consistent Payer with a growth trajectory. The only structural break was the 1:1 bonus in September 2024, which halved per-share metrics but doubled share count — total outflow continued rising.
RITES Limited Financial Performance Analysis
5-Year Revenue Trajectory
Revenue grew from approximately ₹1,500 crore in FY22 to ₹2,415 crore in FY26 — a compounded annual growth of roughly 12-13%. This growth has been driven by increased government infrastructure spending, international project mandates and rolling stock inspection contracts. The consultancy model ensures high margins with limited capital requirements.
Earnings Quality
PAT grew 7.1% against revenue growth of 10.0%, indicating mild margin compression. EBITDA margin at 24.1% remains healthy for a services business. EPS of ₹8.54 comfortably covers the ₹7.95 DPS, but the coverage ratio of just 1.07x leaves minimal headroom. Any earnings dip would immediately pressure dividend sustainability.
RITES Limited Cash Flow Analysis
Cash Is Fact — Profits Are Opinion
| Operating Cash Flow (CFO) | ₹327 Cr |
| Net Profit (PAT) | ₹454 Cr |
| CFO / PAT Ratio | 72.0% |
| Capital Expenditure | ₹61 Cr |
| Free Cash Flow (FCF) | ₹266 Cr |
| Total Dividend Outflow (FY26) | ₹382 Cr |
Critical finding: Operating cash flow of ₹327 crore falls ₹55 crore short of the total dividend outflow of ₹382 crore. Free cash flow at ₹266 crore covers only 70% of the dividend. The ₹116 crore shortfall is bridged by accumulated cash reserves. While PAT is ₹454 crore, the CFO/PAT ratio of 72% indicates that not all reported profit converted to cash — likely due to receivables build-up from government contracts with extended payment cycles. The dividend is funded partially from earnings and partially from the balance sheet — sustainable only as long as the cash reserve holds.
RITES Limited Balance Sheet Strength
Liquidity Position
| Cash & Investments | ₹1,250 Cr |
| Total Borrowings | ₹7 Cr |
| Net Cash Position | ₹1,243 Cr |
| Cash Coverage of Dividend | 3.27x |
Assessment
RITES operates with a fortress balance sheet — near-zero debt and ₹1,250 crore in cash and investments. This cash pile alone can fund 3.27 years of current dividend payouts even without any earnings. The company is effectively debt-free, allowing the Government of India to extract maximum dividends without risking financial stability. However, this raises a capital allocation question: could some of this cash be better deployed in growth capex or acquisitions?
RITES Limited Dividend Sustainability Analysis
Four-Test Sustainability Scorecard
| Test | Result | Status |
|---|---|---|
| 1. Earnings Coverage (Payout < 100%) | Payout 84.2% — Covered but tight | MODERATE |
| 2. OCF Coverage (CFO > Outflow) | ₹327 Cr < ₹382 Cr — Shortfall ₹55 Cr | FAIL |
| 3. FCF Coverage (FCF > Outflow) | ₹266 Cr < ₹382 Cr — Shortfall ₹116 Cr | FAIL |
| 4. Cash Reserve Coverage | ₹1,250 Cr = 3.27x Outflow | PASS |
Tests Passed: 2/4 | Verdict: Moderately Sustainable
The dividend is currently sustained by a combination of earnings and accumulated cash reserves. While earnings cover the payout in accounting terms, actual cash generation falls short. The large cash buffer provides a multi-year runway, but if CFO does not improve relative to dividend outflow, reserves will gradually deplete. The 84.2% payout ratio leaves only ₹72 crore of retained earnings — limiting reinvestment capacity.
RITES Limited Peer Comparison
| Company | Yield | Payout | ROE | ROCE | Debt-Free |
|---|---|---|---|---|---|
| RITES Limited | 3.80% | 84.2% | 15.4% | 23.0% | ✅ |
| IRCON International | 1.85% | 35.0% | 15.0% | 17.0% | ❌ |
| NBCC (India) | 1.20% | 30.0% | 18.0% | 22.0% | ✅ |
| RVNL | 0.34% | 15.0% | 16.0% | 18.0% | ❌ |
RITES offers the highest dividend yield among PSU infrastructure consultancy peers — more than double IRCON's 1.85% and over 3x NBCC's 1.20%. However, this comes at the cost of the highest payout ratio at 84.2%. IRCON and NBCC retain significantly more earnings for growth. RITES' ROCE of 23% is best-in-class, benefiting from its asset-light model. Investors seeking yield favour RITES; those prioritizing growth reinvestment may find IRCON or RVNL more attractive.
RITES Limited Promoter Impact Analysis
Shareholding Pattern
| Promoter (Government of India) | 72.20% |
| FII / FPI | 3.43% |
| DII | 8.74% |
| Public & Others | 15.63% |
Promoter Dividend Income
Of the total FY26 dividend outflow of ₹382 crore, the Government of India receives approximately ₹276 crore (72.20% share). This represents a significant non-tax revenue for the exchequer. Retail and minority shareholders collectively receive roughly ₹106 crore. The high payout is partly driven by government policy to maximize dividend extraction from profitable PSUs — a pattern seen across Navratna companies. This alignment benefits income-seeking shareholders but may limit growth capital allocation.
RITES Limited Dividend Taxation Analysis
Indian Dividend Tax Rules
Since April 2020, dividends are taxed in the hands of the shareholder at their individual income tax slab rate. Companies deduct TDS at 10% on dividend income exceeding ₹5,000 in a financial year (Section 194). Shareholders can claim credit for TDS while filing returns. Non-resident investors face TDS at 20% (or treaty rate). Dividend income adds to total taxable income, potentially pushing investors into a higher tax bracket.
Worked Example: 1,000 Shares at 30% Slab
| Shares Held | 1,000 |
| Total DPS (FY26) | ₹7.95 |
| Gross Dividend | ₹7,950 |
| TDS (10% on amount above ₹5,000) | ₹295 |
| Tax at 30% | ₹2,385 |
| Health & Education Cess (4%) | ₹95 |
| Total Tax Liability | ₹2,480 |
| Net Dividend (Post-Tax) | ₹5,470 |
| Effective Yield (Post-Tax) | 2.62% |
RITES Limited Key Risks
- Cash Flow Deficit: Operating cash flow (₹327 Cr) does not cover total dividend outflow (₹382 Cr), meaning the company is dipping into reserves to fund dividends — unsustainable long-term if uncorrected.
- Government Dependency: Over 80% of RITES' revenue comes from government contracts. Policy shifts, budget cuts or delayed payments can directly impact cash flows and dividend capacity.
- High Payout Ratio (84.2%): Leaves minimal retained earnings (₹72 Cr) for business expansion, R&D or acquisition. Any earnings downturn would immediately threaten dividend levels.
- Margin Compression: PAT growth (7.1%) trailing revenue growth (10.0%) signals cost pressures. Employee costs and subcontracting expenses may continue rising as project complexity increases.
- Receivables Risk: The CFO/PAT ratio of 72% suggests delayed collections from government clients — a persistent challenge for PSU service companies that can worsen during fiscal tightening.
- Limited Diversification: Heavy reliance on Indian Railways for core revenue. Any reduction in railway capex allocation would materially impact RITES' topline.
- Promoter Extraction Risk: The 72.20% government stake incentivizes maximizing dividends over growth investments, potentially capping long-term value creation for minority shareholders.
What To Monitor for RITES Limited
- CFO Recovery: Monitor whether operating cash flow rises above ₹400 crore in FY27 to sustainably cover dividend outflows without drawing reserves.
- Order Book Growth: Track new contract wins and order backlog — RITES needs consistent 10-15% order inflow growth to sustain revenue trajectory.
- Receivables Days: Watch debtor days trending. Rising receivables relative to revenue would further widen the CFO-PAT gap.
- Government Capex Budget: Monitor Union Budget allocations for railways and infrastructure. Any reduction directly impacts RITES' addressable market.
- International Revenue Share: Track export consultancy contribution. Diversifying beyond Indian government contracts reduces concentration risk.
- EBITDA Margin Trend: The 24.1% margin should be stable or improving. Deterioration below 22% would pressure earnings coverage.
- Interim Dividend Pattern: The shift to quarterly dividends suggests government preference for accelerated cash extraction — watch for further increases or special dividends.
Conclusion – RITES Limited Dividend FY 2025-26
RITES Limited's total FY26 dividend of ₹7.95 per share delivers a 3.80% yield — the highest among PSU infrastructure consultancy peers. The company maintains a consistent dividend track record with 12.2% DPS CAGR over seven years. However, the sustainability scorecard reveals concerns: operating cash flow does not cover the total dividend outflow, and the 84.2% payout ratio leaves minimal room for retained growth. The ₹1,250 crore cash reserve provides a comfortable multi-year buffer, but the structural gap between cash generation and cash distribution must narrow. RITES remains a strong dividend payer supported by government infrastructure spending, a debt-free balance sheet and an asset-light model — but investors should recognize that the current payout level is moderately sustainable and dependent on improving cash conversion.
Frequently Asked Questions About RITES Limited Dividend
What dividend has RITES Limited announced for FY 2025-26?
What is RITES Limited's current dividend yield?
What was the record date for RITES Limited final dividend?
What was the ex-dividend date for RITES Limited?
When will RITES Limited pay the final dividend?
Who was eligible for RITES Limited's final dividend?
How is RITES Limited dividend taxed in India?
Is RITES Limited's dividend sustainable?
What is RITES Limited's dividend history?
What should investors monitor about RITES Limited going forward?
What is RITES Limited's dividend payout ratio?
How does RITES Limited dividend yield compare to peers?
Did RITES Limited's AGM approve the final dividend?
What was the total dividend outflow from RITES Limited in FY26?
Disclaimer
This article is published by ShareBazaar Online for educational and informational purposes only. It does not constitute investment advice, a recommendation to buy, sell or hold any security, or an offer or solicitation of any transaction. All data has been sourced from publicly available filings, stock exchange disclosures and financial databases. While every effort has been made to ensure accuracy, ShareBazaar Online does not guarantee completeness or timeliness of information. Investors should conduct their own research and consult a qualified financial advisor before making investment decisions. Past dividend performance does not guarantee future payouts. Dividend amounts and dates are subject to change based on company board decisions and regulatory approvals. ShareBazaar Online, its authors and affiliates do not hold positions in the securities mentioned and accept no liability for any investment losses. Keyword metrics in this article marked "NIV" (Not Independently Verified) are sourced from Google Keyword Planner CSV export and could not be independently verified via Semrush or Ahrefs API during production.