
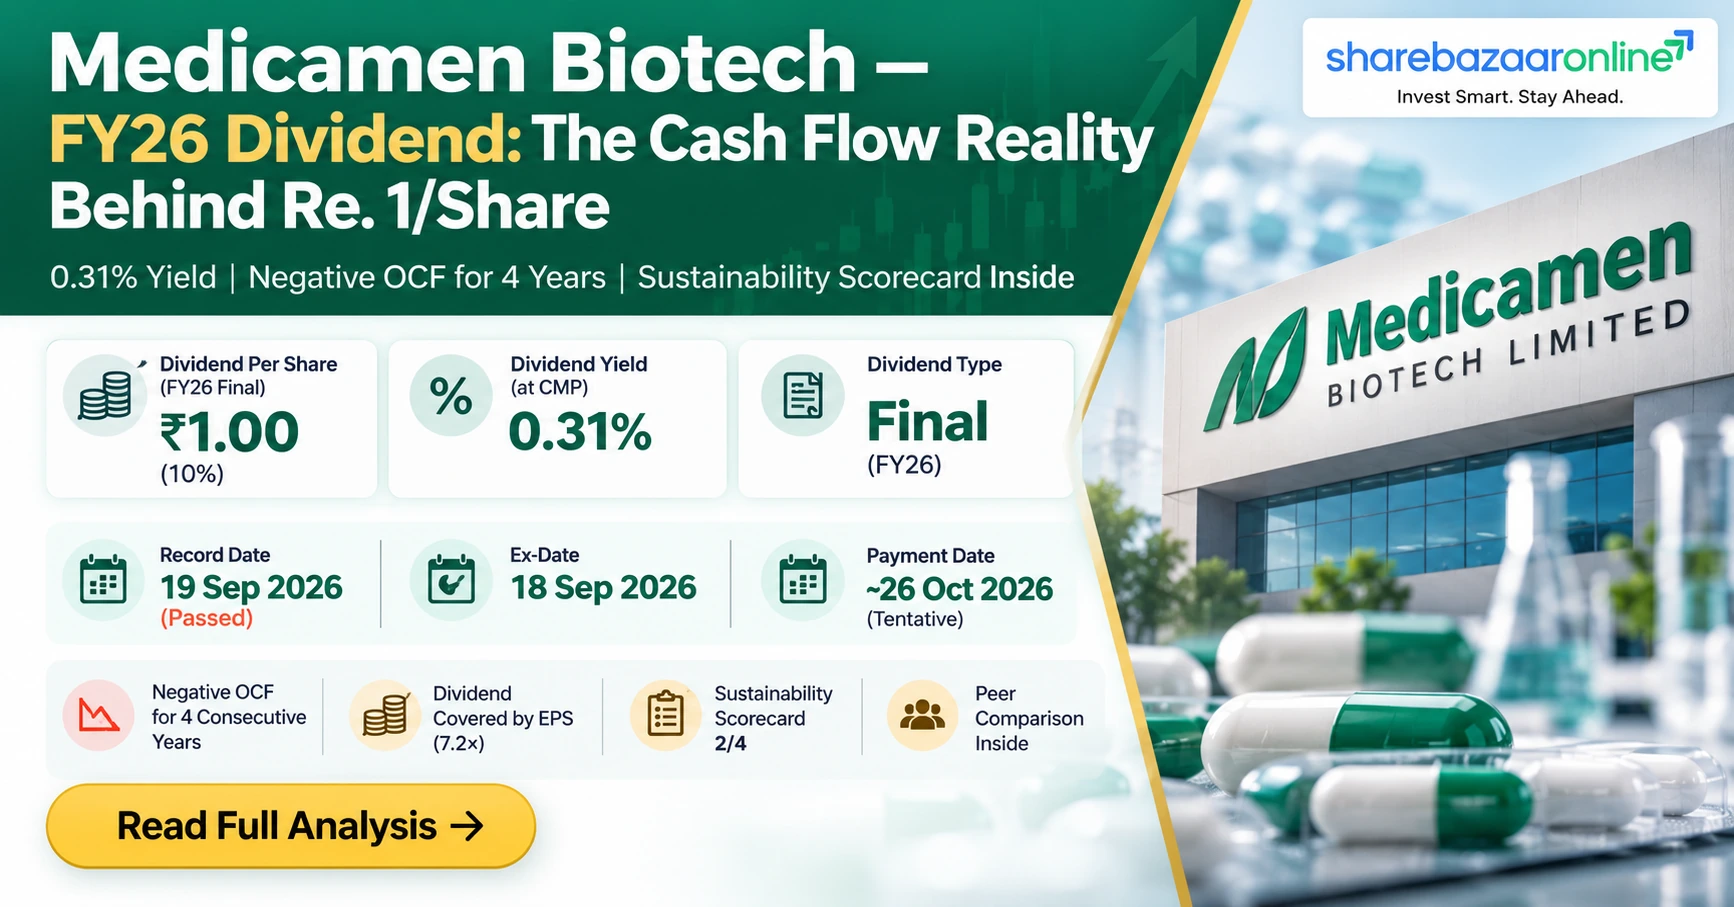
Dividend Snapshot – Medicamen Biotech Limited
Company Identity
| Company | Medicamen Biotech Limited |
| NSE Symbol | MEDICAMEQ |
| BSE Code | 531146 |
| ISIN | INE646B01010 |
| Face Value | ₹10 |
| Market Cap | ₹432.65 Cr |
Dividend Details
| Dividend Type | Final Dividend |
| Dividend Per Share | ₹1.00 |
| Dividend % | 10% on FV ₹10 |
| Financial Year | FY2025-26 |
| Dividend Yield | 0.31% |
| Total Outflow | ₹1.36 Cr |
Medicamen Biotech Limited – Company Overview
Medicamen Biotech Limited (CIN: L74899DL1993PLC056594) is a Delhi-headquartered pharmaceutical company specializing in Generic Finished Dosage Forms, Oncology Formulations, and Contract Research & Development services. The company operates across global regulated and semi-regulated markets, serving the pharmaceutical supply chain with manufacturing capabilities in oral solids, injectables, and oncology products. Incorporated in 1993, Medicamen reported consolidated revenue of ₹197.77 Cr for FY2025-26 with a net profit of ₹9.64 Cr. The company's equity is held 40.46% by promoter entity Shivalik Rasayan Limited, with zero promoter pledging. At a current market price of approximately ₹319, the stock trades at a P/E of ~39x, classifying it as a small-cap pharma stock with a market capitalization of ₹432.65 Cr.
Medicamen Biotech Limited – Financial Analysis
Revenue & Profitability
| Revenue FY26 | ₹197.77 Cr |
| Net Profit FY26 | ₹9.64 Cr |
| EPS (Diluted) | ₹7.22 |
| Operating Margin | ~10.0% |
| Net Profit Margin | 4.87% |
| Revenue Growth YoY | +21.67% |
Return Ratios
| ROE | 3.23% |
| ROCE | 5.82% |
| ROE (3-Year Avg) | 4.23% |
| P/E Ratio | ~39x |
| P/B Ratio | 1.57 |
| Book Value | ₹203.23 |
Medicamen Biotech posted ₹197.77 Cr revenue for FY26, a 21.67% increase over FY25's ₹162.55 Cr. PAT recovered to ₹9.64 Cr from ₹6.56 Cr, though still far below FY22 peak of ₹14.90 Cr. The 4-year PAT CAGR stands at -10.31%, a structural earnings decline. Operating margins bottomed at 8.9% in FY25 and marginally recovered to ~10% in FY26, but remain sharply below the 20.9% achieved in FY22. Employee cost escalation (12.17% to 19.14% of revenue over four years) is the primary margin compressor. ROE at 3.23% and ROCE at 5.82% both sit below the cost of capital, suggesting value destruction. (Sources: Screener.in, Company Filing, Value Research Online)
Medicamen Biotech Limited Dividend History
| Financial Year | Type | DPS (₹) | Ex-Date | CMP at Ex-Date | Yield at Ex |
|---|---|---|---|---|---|
| FY2025-26 | Final | ₹1.00 | 18-Sep-2026 | ~₹270 | ~0.37% |
| FY2024-25 | Final | ₹1.00 | 18-Sep-2025 | ₹334 | 0.30% |
| FY2023-24 | Final | ₹1.00 | 19-Sep-2024 | ₹463 | 0.22% |
| FY2022-23 | Final | ₹1.00 | 20-Sep-2023 | ₹664 | 0.15% |
| FY2021-22 | Final | ₹1.00 | 19-Sep-2022 | ₹1,072 | 0.09% |
| FY2020-21 | Final | ₹1.00 | 16-Sep-2021 | N/A | N/A |
| FY2019-20 | Final | ₹0.50 | 17-Sep-2020 | N/A | N/A |
| FY2018-19 | Final | ₹1.00 | 17-Sep-2019 | N/A | N/A |
| FY2016-17 | Interim | ₹1.00 | 08-Aug-2017 | N/A | N/A |
| FY2009-10 | Final | ₹0.75 | 21-Sep-2010 | N/A | N/A |
Medicamen Biotech has paid dividends 10 times since 2002, distributing a cumulative ₹9.25 per share over this period. The company maintained a flat ₹1 per share dividend for six consecutive years (FY21–FY26), except FY20 when it was halved to ₹0.50. The dividend has shown zero growth despite earnings fluctuating significantly. Classification: Consistent but Stagnant Payer — reliable at ₹1/share but no real growth in payout even when profits were higher. The rising yield trend (0.09% → 0.37%) reflects the falling share price, not a dividend increase. (Sources: Trendlyne, StockPriceArchive, Simply Wall St)
Expert Commentary on Medicamen Biotech Dividend
The Face-Value Illusion: Medicamen Biotech's "10% dividend" sounds attractive until you decode what it actually means. The 10% is calculated on the ₹10 face value, not the market price. In reality, shareholders receive just ₹1 per share — which at a CMP of ~₹319 translates to a yield of merely 0.31%. A fixed deposit yields 10–15x more. The company has maintained an identical ₹1/share payout for six straight years regardless of whether profits were ₹14.90 Cr (FY22) or ₹6.56 Cr (FY25). This mechanical constancy raises questions about whether the board views dividends as a genuine capital return tool or merely a formality. The total outflow of ₹1.36 Cr against FY26 PAT of ₹9.64 Cr (payout ratio: 14.07%) shows the company is barely sharing profits with shareholders.
Medicamen Biotech Limited – Future Outlook
Medicamen's revenue recovery in FY26 (+21.67% YoY) suggests some operational stabilization, but the structural margin compression from FY22 (20.9% OPM) to FY26 (~10% OPM) remains a concern. Employee costs rising to 19.14% of revenue reflect either business model dilution or capacity build-out for future growth. Q1 FY27 results (Apr–Jun 2026) showed revenue of ₹47.90 Cr (up 11.3% YoY) with PAT of ₹4.45 Cr (up 178% YoY from a low base of ₹1.60 Cr). The negative OCF of -₹33 Cr is the most pressing concern — the company is generating accounting profits but consuming cash operationally, possibly due to rising receivables or inventory build-up. Future dividend growth hinges entirely on whether management can convert profits into actual cash flows and arrest the multi-year margin compression trend.
Medicamen Biotech Dividend Announcement Summary
On 14 August 2026, Medicamen Biotech Limited's Board of Directors recommended a Final Dividend of Re. 1 per equity share (10% on Face Value of ₹10) for FY2025-26 at its board meeting. The dividend was subject to approval by shareholders at the 33rd Annual General Meeting held on 26 September 2026 via video conferencing. The record date was fixed as 19 September 2026 (Saturday), making the ex-dividend date 18 September 2026 (Friday). Books were closed from 20–26 September 2026. Payment is expected by 26 October 2026. The CMP on the announcement date was approximately ₹240.75, giving an announcement-date yield of 0.42%. As of today, the record date has passed and only shareholders who held shares before the ex-date are eligible for this dividend. (Source: BSE Filing, Regulation 30 LODR)
Medicamen Biotech Dividend – Key Dates Timeline
Note: The record date (19 Sep 2026) and ex-date (18 Sep 2026) have already passed. This dividend is now in the payment phase.
Medicamen Biotech Dividend Yield Analysis
Yield Metrics
| Current Yield (CMP ₹319) | 0.31% |
| Announcement Yield (₹240.75) | 0.42% |
| 52W High Yield (₹454) | 0.22% |
| 52W Low Yield (₹210) | 0.48% |
| Pharma Sector Avg Yield | 0.70% |
Yield Reality Check
Medicamen's yield has increased from 0.09% (Sep 2022) to 0.31% (current) — but this is entirely due to the falling share price, not any dividend increase. The stock has fallen from ₹1,072 to ₹319 (a 70% decline) while the dividend remained fixed at ₹1. This is a classic yield trap signal — rising yield from price destruction, not income growth. At 0.31%, the yield remains below the pharma sector average of 0.70% and far below the top 25% of Indian dividend payers (1.48%). Even at the 52-week low of ₹210, the yield only reaches 0.48%.
Medicamen Biotech Dividend History Analysis
Medicamen has paid dividends in 10 of the 24 years since its first payout in 2002, making it an irregular historical payer that turned consistent post-2017. The last six consecutive years (FY21–FY26) saw an identical ₹1/share payout — a mechanical repetition regardless of earnings. In FY22, when EPS was ₹12.19, the company paid just ₹1 (payout: 8.2%). In FY25, with EPS at ₹5.16, the payout ratio rose to 19.4% — not because the dividend grew, but because earnings shrank. The single exception was FY20 (₹0.50, a COVID-year cut). There have been no special dividends or bonus issues. Classification: Consistent but Stagnant Payer. Shareholders receiving the same nominal amount year after year are effectively losing purchasing power to inflation. (Sources: Trendlyne, Simply Wall St)
Medicamen Biotech – Financial Performance Analysis
| Metric | FY22 | FY23 | FY24 | FY25 | FY26 |
|---|---|---|---|---|---|
| Revenue (₹ Cr) | 115.45 | 140.87 | 179.31 | 162.55 | 197.77 |
| Net Profit (₹ Cr) | 14.90 | 14.73 | 9.49 | 6.56 | 9.64 |
| EPS (₹) | 12.19 | 11.64 | 7.47 | 5.16 | 7.22 |
| OPM (%) | 20.9% | 17.3% | 13.1% | 8.9% | ~10.0% |
| NPM (%) | 12.72% | 10.28% | 5.23% | 3.88% | 4.87% |
| ROE (%) | 11.25% | 9.13% | 4.94% | 3.23% | ~4.57% |
| DPS (₹) | 1.00 | 1.00 | 1.00 | 1.00 | 1.00 |
Operating Leverage Alert: Revenue grew 21.67% in FY26, but operating margins only marginally improved from 8.9% to ~10%. This means the company is growing topline but not converting it proportionally to bottom line — a sign of cost-side pressure. Employee costs, the largest non-material expense, rose from 12.17% (FY22) to 19.14% (FY25) of revenue. The 4-year PAT CAGR is -10.31%, meaning profits have shrunk at a double-digit rate despite revenue growing at a 14.4% CAGR. This divergence between topline growth and profitability erosion is the central financial concern. (Sources: Value Research Online, Company Filing)
Medicamen Biotech – Cash Flow Analysis
| Cash Flow (₹ Cr) | FY22 | FY23 | FY24 | FY25 | FY26 |
|---|---|---|---|---|---|
| Operating Cash Flow | 4.11 | -6.29 | -6.74 | -8.16 | -33.00 |
| Free Cash Flow | N/A | N/A | N/A | N/A | -38.00 |
| Net Profit | 14.90 | 14.73 | 9.49 | 6.56 | 9.64 |
⚠ Critical Cash Flow Warning
Medicamen Biotech has reported negative operating cash flows for four consecutive years (FY23–FY26). FY26's OCF of -₹33 Cr is the worst in this series, despite reporting a net profit of ₹9.64 Cr. This means the company is showing profits on paper but consuming cash in operations — a classic "accrual vs. cash" divergence. The likely causes include rising receivables, inventory build-up, or aggressive revenue recognition. FCF of -₹38 Cr means the dividend of ₹1.36 Cr is being funded entirely from existing cash reserves or borrowings, not from operations. This is the single most important red flag in Medicamen's dividend story. (Source: Screener.in, Simply Wall St)
Medicamen Biotech – Balance Sheet Strength
Balance Sheet Metrics (FY26)
| Total Assets | ₹372 Cr |
| Reserves | ₹262 Cr |
| Total Debt | ₹27.41 Cr |
| Debt-to-Equity | 0.13 |
| Current Ratio | 2.12 |
| Book Value/Share | ₹203.23 |
Despite the cash flow concerns, Medicamen's balance sheet remains reasonably strong. Debt-to-equity at 0.13 is low for a manufacturing pharma company. The current ratio of 2.12 indicates adequate short-term liquidity. Reserves of ₹262 Cr against a total debt of ₹27.41 Cr provide a substantial buffer. However, the company's total assets grew from ₹225.69 Cr (FY22) to ₹372 Cr (FY26) — a ₹146 Cr increase — while net profit declined. This suggests capital is being deployed but not generating proportional returns. The dividend outflow of ₹1.36 Cr is negligible relative to reserves but the persistent negative OCF signals that even this small payout draws from accumulated reserves. (Source: Screener.in, Finology)
Medicamen Biotech Dividend Sustainability Analysis
Four-Test Sustainability Scorecard
Score: 2/4 — Moderately Sustainable
The ₹1/share dividend is easily covered by earnings (7.22× coverage) and the balance sheet has adequate liquidity. However, the company is paying this dividend despite generating negative operating and free cash flows for four consecutive years. The dividend is being funded from reserves, not from current operations. While the small outflow (₹1.36 Cr) can be sustained from accumulated reserves for many years, the underlying cash flow trajectory raises concerns about long-term sustainability.
Medicamen Biotech – Peer Comparison
| Metric | Medicamen | Pharma Sector Avg | Nifty Pharma Index |
|---|---|---|---|
| Dividend Yield | 0.31% | 0.70% | ~0.50% |
| Payout Ratio | 14.07% | ~25% | ~20–30% |
| ROE | 3.23% | ~15% | ~18% |
| ROCE | 5.82% | ~18% | ~20% |
| P/E Ratio | ~39× | ~34× | ~30× |
| Net Margin | 4.87% | ~12% | ~15% |
Medicamen Biotech significantly underperforms its pharma peers across every metric. Its dividend yield of 0.31% is less than half the sector average of 0.70%. Its ROE of 3.23% is roughly one-fifth of the pharma sector average (~15%), indicating poor capital efficiency. Despite this, the stock trades at a P/E of ~39×, a 15% premium to the sector average, suggesting overvaluation relative to fundamentals. The payout ratio of 14.07% is also below industry norms, meaning even the modest ₹1 dividend could potentially be higher. For dividend-focused investors, established pharma names offering higher yields with stronger cash flows would likely be more suitable. (Sources: MarketsMojo, Simply Wall St, Screener.in)
Medicamen Biotech – Promoter Impact Analysis
Shareholding Pattern (Jun 2026)
| Promoter (Shivalik Rasayan Ltd) | 40.46% |
| Promoter Pledging | 0.00% |
| FII | 0.07% |
| DII | 0.40% |
| Public | 59.01% |
| Shareholders | 11,047 |
Promoter Dividend Income
| Promoter Shares | 54,87,095 |
| Dividend Per Share | ₹1.00 |
| Promoter Dividend Income | ₹54.87 Lakh |
| Share of Total Outflow | 40.46% |
The promoter entity Shivalik Rasayan Limited receives ₹54.87 Lakh from this dividend — 40.46% of the ₹1.36 Cr total outflow. Promoter holding has declined from 43.16% to 40.46% in recent quarters. FII presence is virtually zero (0.07%) and DII holding is negligible (0.40%), indicating minimal institutional confidence. Zero promoter pledging is a positive.
Medicamen Biotech Dividend – Taxation Analysis
Indian Dividend Tax Rules (Current)
Dividends in India are taxable in the hands of shareholders at their applicable income tax slab rate (post-April 2020 regime). TDS at 10% is deducted by the company if total dividend to an individual shareholder exceeds ₹5,000 in a financial year. Non-resident shareholders face a higher TDS rate of 20% (subject to DTAA provisions).
Worked Example: Tax Impact on ₹1 Dividend
| Shares Held | 1,000 |
| Gross Dividend (1,000 × ₹1) | ₹1,000 |
| Tax Slab (30% + 4% Cess) | 31.20% |
| Tax Payable | ₹312 |
| Net Dividend Received | ₹688 |
| Effective Post-Tax Yield | 0.22% |
| TDS Applicable? | No (₹1,000 < ₹5,000 threshold) |
At the highest tax bracket, an investor holding 1,000 shares receives only ₹688 net from a ₹1,000 gross dividend, reducing the effective yield to a negligible 0.22%. For an investor to trigger TDS, they would need to hold over 5,000 shares (worth ~₹15.95 Lakh at CMP).
Key Risks – Medicamen Biotech Dividend
What To Monitor – Medicamen Biotech
Conclusion – Medicamen Biotech Dividend FY2025-26
Medicamen Biotech Limited's Re. 1 per share final dividend for FY2025-26 represents a mechanical continuation of a six-year flat payout rather than a meaningful shareholder return. At a yield of 0.31% (post-tax: ~0.22%), the dividend income is negligible for retail investors. The company's core challenge is the persistent disconnect between reported profits and cash generation — four consecutive years of negative OCF while paying dividends is a pattern that deserves scrutiny. On the positive side, the low payout ratio (14.07%), minimal debt (D/E: 0.13), healthy current ratio (2.12), and strong EPS coverage (7.22×) mean the dividend itself is not at risk of being cut. Revenue recovery in FY26 (+21.67%) and Q1 FY27 profit improvement (+178% YoY) offer early signs of stabilization. Investors should focus on whether cash flow improvements materialize before attributing value to this dividend.
Frequently Asked Questions – Medicamen Biotech Dividend
What dividend has Medicamen Biotech announced for FY2025-26?
What is the dividend yield of Medicamen Biotech?
What was the record date for Medicamen Biotech's FY26 dividend?
What was the ex-dividend date for Medicamen Biotech?
When will Medicamen Biotech pay the FY26 dividend?
Who was eligible for Medicamen Biotech's dividend?
How is Medicamen Biotech's dividend taxed in India?
Is Medicamen Biotech's dividend sustainable?
What is Medicamen Biotech's dividend history?
What should investors monitor about Medicamen Biotech?
Why is Medicamen Biotech's dividend yield increasing?
What is Medicamen Biotech's payout ratio?
How does Medicamen Biotech's dividend compare to pharma peers?
Disclaimer
This article is published by ShareBazaar Online for educational and informational purposes only. It does not constitute investment advice, a recommendation to buy, sell, or hold any security, or an offer or solicitation of any transaction. All data has been sourced from publicly available filings, stock exchanges, and third-party financial data providers and is believed to be accurate at the time of publication but is not independently audited. Financial metrics, ratios, and computations are based on available data and may differ from official figures. Past dividend payments do not guarantee future dividends. Share prices and dividend yields are subject to market risks and may change. Readers should conduct their own due diligence and consult a qualified financial advisor before making any investment decisions. ShareBazaar Online, its authors, and affiliates disclaim all liability for any losses arising from the use of this information. Dividend income is taxable as per applicable Indian tax laws — consult a tax professional for personalized advice.