
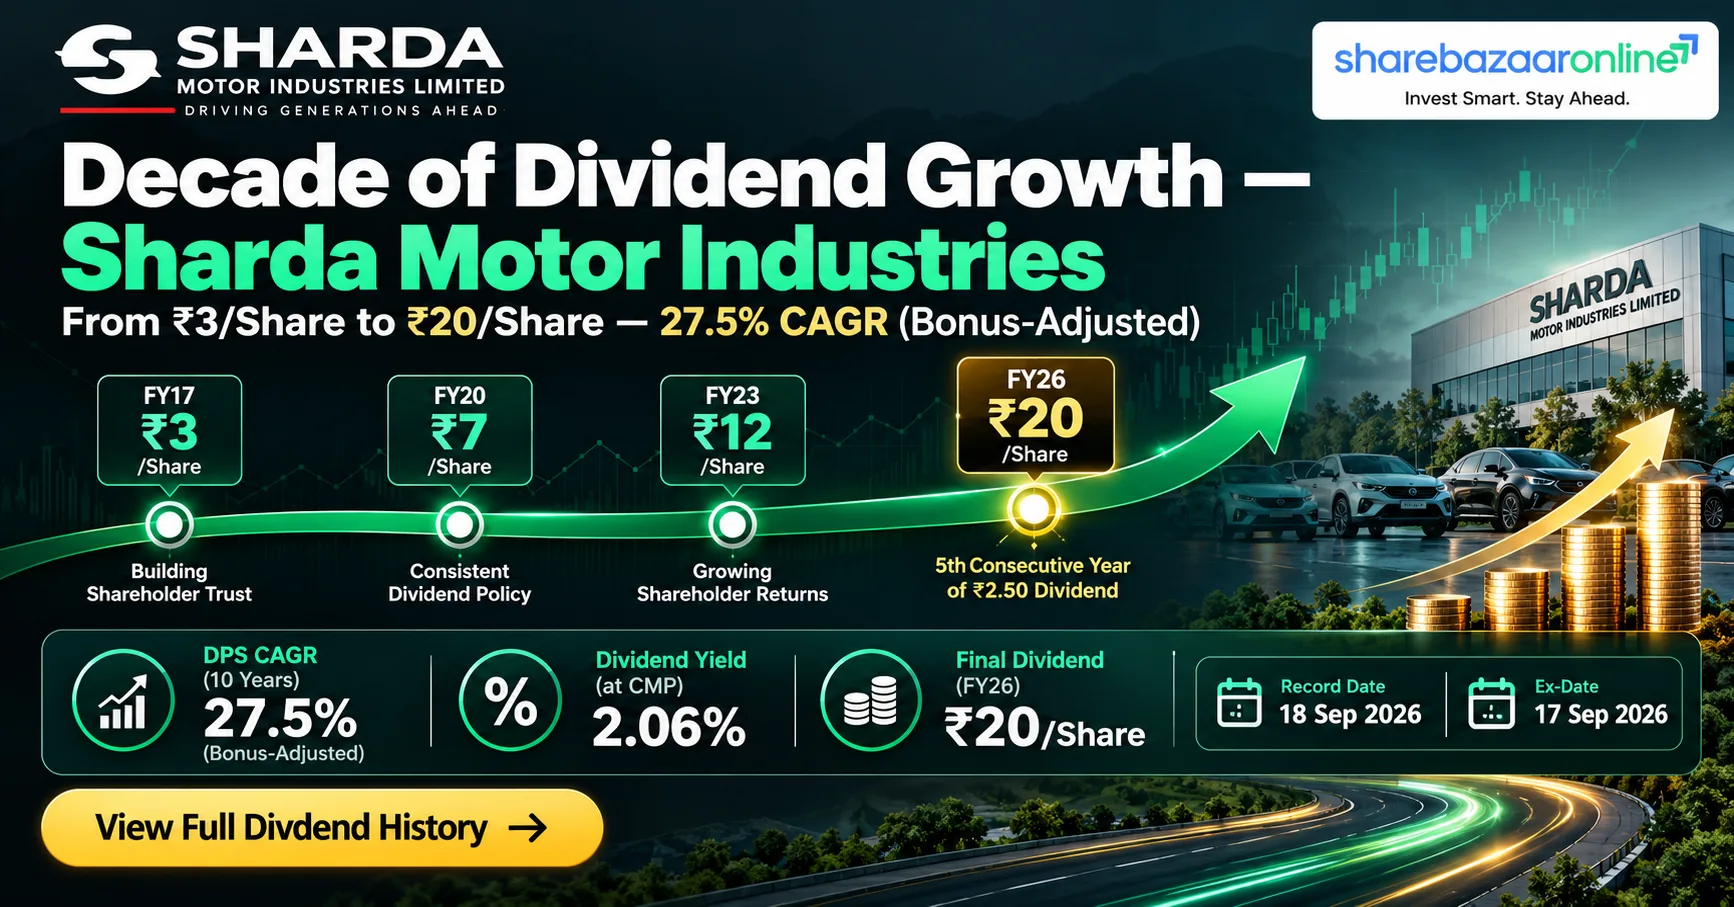
Dividend Snapshot — Sharda Motor Industries Limited
Company
Sharda Motor Industries Limited
NSE Symbol / BSE Code
SHARDAMOTR / 535602
ISIN
INE597I01028
Dividend Per Share
₹20.00
Dividend % (on Face Value ₹2)
1,000%
Dividend Yield (at CMP ₹971)
2.06%
Dividend Type
Final Dividend — FY2025-26
Dividend Outflow
₹114.82 Crore
CMP (Sep 29, 2026)
₹971
Market Cap
₹5,574 Crore
P/E Ratio
16.14x
Sharda Motor Industries Limited — Company Overview
Sharda Motor Industries Limited (CIN: L74899DL1986PLC023202) is India's largest manufacturer of exhaust systems and suspension components for the automotive sector. Headquartered in New Delhi, the company operates through a single reportable segment — manufacturing and trading of auto component parts. It supplies exhaust systems, catalytic converters, tubular components, and suspension springs to major OEMs including Maruti Suzuki, Hyundai, Tata Motors, and Mahindra. The company holds a CRISIL AA-/Stable/A1+ credit rating, reflecting robust financial strength. Its consolidated subsidiaries include Uddipt Mobility India Private Limited, with associate Relan Industrial Finance Limited and joint venture Exhaust Technology Private Limited. With ₹3,397 Crore in FY26 revenue and 34.5% ROCE, Sharda Motor is among the most capital-efficient auto component companies in India.
Sharda Motor Industries Financial Analysis
Consolidated P&L — FY2025-26
| Revenue from Operations | ₹3,397 Cr |
| Other Income | ₹86 Cr |
| Total Expenses | ₹3,049 Cr |
| Profit Before Tax | ₹459 Cr |
| Tax Expense | ₹114 Cr |
| Net Profit (PAT) | ₹345 Cr |
Key Ratios
| EPS (Basic) | ₹60.17 |
| ROCE | 34.5% |
| ROE | 25.2% |
| Revenue Growth (YoY) | 19.7% |
| PAT Growth (YoY) | 10.5% |
| P/E Ratio | 16.14x |
Revenue grew 19.7% year-on-year to ₹3,397 Crore, driven by strong OEM demand and BS-VI emission compliance orders. However, PAT growth was more modest at 10.5%, indicating margin compression. Raw material costs consumed 74.9% of revenue (₹2,543 Cr vs ₹2,039 Cr in FY25), squeezing operating leverage. Employee costs rose 8.5% to ₹160 Crore. The exceptional item of ₹18.15 Crore included ₹22.41 Crore profit on sale of PPE classified as held for sale, offset by ₹4.26 Crore provision for employee benefit past service cost under new labour codes. Despite top-line strength, investors should note that PAT growth lagged revenue growth by 920 basis points — a sign of operating cost pressures that merit monitoring.
Sharda Motor Industries Dividend History
Note: Sharda Motor issued a 1:1 bonus in July 2025. All pre-bonus DPS figures are halved (÷2) per Ind AS 33 restatement to enable like-for-like comparison on the post-bonus share base.
| Financial Year | DPS (Adjusted) | DPS (Pre-Bonus) | Type |
|---|---|---|---|
| FY2025-26 | ₹20.00 | ₹20.00 | Final |
| FY2024-25 | ₹16.25 | ₹32.50 | Final |
| FY2023-24 | ₹10.00 | ₹20.00 | Final |
| FY2022-23 | ₹10.00 | ₹20.00 | Final |
| FY2021-22 | ₹7.50 | ₹15.00 | Final |
| FY2020-21 | ₹3.75 | ₹7.50 | Final |
| FY2019-20 | ₹2.50 | ₹5.00 | Final |
| FY2018-19 | ₹3.75 | ₹7.50 | Final |
| FY2017-18 | ₹3.50 | ₹7.00 | Final |
| FY2016-17 | ₹2.25 | ₹4.50 | Final |
Sharda Motor Industries has paid dividends consistently for 10 consecutive years without a single cut or suspension — a rare trait among mid-cap auto component companies. On a bonus-adjusted basis, DPS has grown at a 27.5% CAGR from ₹2.25 (FY17) to ₹20 (FY26). The company also conducted a ₹230 Crore buyback in FY25, returning additional capital to shareholders. Classification: Consistent Payer with Strong Growth Trajectory.
Expert Commentary on Sharda Motor Industries Dividend
The ₹20 dividend on a ₹2 face value translates to 1,000% — an optically spectacular number that often misleads retail investors. The reality is more nuanced: at CMP ₹971, the actual yield is 2.06%, competitive but not exceptional for the auto components sector. What stands out is the company's capital allocation discipline. With ₹1,231 Crore in cash and investments against a ₹115 Crore dividend outflow, the payout represents just 9.3% of liquid assets. The 3.01x earnings coverage and 3.16x operating cash flow coverage signal that this dividend is comfortably funded by current operations, not by depleting reserves. The absence of meaningful debt (only ₹49 Crore in lease liabilities) further strengthens the sustainability thesis.
Sharda Motor Industries Future Outlook
The transition to BS-VI Phase 2 and tighter emission norms continues to be a structural tailwind for exhaust system manufacturers like Sharda Motor. The company's investment of ₹91.71 Crore in capex during FY26 (vs ₹92.34 Cr in FY25) indicates measured capacity expansion. However, raw material cost inflation remains the key risk — materials consumed grew 24.7% versus revenue growth of 19.7%, compressing operating margins. The ₹1,136 Crore investment portfolio reflects management's preference for treasury returns alongside operational growth. With the EV transition still years away for exhaust systems, the medium-term business outlook remains favorable. The challenge will be maintaining margin discipline as OEM pricing pressures intensify. Investors should watch quarterly margin trends closely.
Sharda Motor Industries Dividend Announcement Summary
At its Board Meeting held on May 21, 2026, Sharda Motor Industries Limited's Board of Directors recommended a final dividend of ₹20 per equity share (1,000% on face value of ₹2) for the financial year ended March 31, 2026. This dividend is subject to approval of shareholders at the ensuing Annual General Meeting scheduled for September 24, 2026. The company simultaneously announced audited standalone and consolidated financial results showing revenue from operations of ₹3,397 Crore and consolidated PAT of ₹345 Crore. The statutory auditors, S.R. Dinodia & Co. LLP, issued an unmodified opinion on both standalone and consolidated financial results. The total dividend outflow will be approximately ₹114.82 Crore on 5,74,07,706 equity shares of ₹2 each.
Sharda Motor Industries Key Dates Timeline
| Announcement Date | May 21, 2026 |
| Ex-Dividend Date | Sep 17, 2026* |
| Record Date | Sep 18, 2026 |
| AGM Date | Sep 24, 2026 |
| Payment Date | Not Disclosed by Company |
*Ex-date inferred as T+1 settlement = Record Date minus 1 trading day. Sep 18 (Fri) → Ex-Date Sep 17 (Thu).
Eligibility
The record date of September 18, 2026 has already passed. Only shareholders who held SHARDAMOTR shares in their demat account as of the record date were eligible to receive this dividend. New buyers purchasing shares after the ex-date (September 17, 2026) were not eligible for this dividend payment.
Sharda Motor Industries Dividend Yield Analysis
Yield Breakdown
| Dividend Per Share | ₹20.00 |
| CMP (Sep 29, 2026) | ₹971 |
| Yield at Current CMP | 2.06% |
| CMP on Announcement Date | ₹948 (est.) |
| Yield at Announcement CMP | 2.11% |
Yield Reality Check
The 1,000% dividend headline is a function of the ₹2 face value — the actual cash yield at market price is 2.06%. This yield is driven by a genuine earnings increase, not a declining share price or one-time special distribution. Sharda Motor's stock has appreciated from approximately ₹948 at announcement to ₹971 currently, meaning the yield is improving slightly as DPS rose faster than CMP. The yield compares favorably to the 1.2-1.5% average for the Nifty Auto Index. However, investors earning above the 30% tax bracket will see an effective post-tax yield of only 1.42%, which is below fixed deposit returns.
Sharda Motor Industries Dividend History Analysis
Sharda Motor has transformed from a modest dividend payer into one of the auto component sector's most generous distributors. The 27.5% CAGR in bonus-adjusted DPS over 9 years (FY17–FY26) outpaces both revenue CAGR (~18%) and PAT CAGR (~22%), signaling management's increasing confidence in cash generation sustainability. The FY20 dip to ₹2.50 (adjusted) during COVID was modest and quickly recovered — FY21 jumped to ₹3.75 and FY22 to ₹7.50. The FY25 buyback of ₹230 Crore (at ₹799/share pre-bonus) supplemented cash returns beyond regular dividends. No special dividends have been declared, keeping the distribution policy predictable. The FY26 DPS of ₹20 represents a 23.1% increase over the adjusted FY25 DPS of ₹16.25, tracking PAT growth closely.
Sharda Motor Industries Financial Performance Analysis
Operating Leverage
| Revenue Growth | +19.7% |
| PAT Growth | +10.5% |
| Raw Material/Revenue | 74.9% |
| Employee Cost Growth | +8.5% |
Source: Consolidated filing, May 21, 2026
Margin Analysis
Revenue rose 19.7% but PAT grew only 10.5%, indicating negative operating leverage. The primary culprit is raw material costs, which grew 24.7% (₹2,543 Cr vs ₹2,039 Cr), outpacing revenue. Raw materials now consume 74.9% of revenue versus 71.9% in FY25 — a 300 bps margin compression. This was partially offset by the ₹22.41 Cr exceptional gain from PPE sale. Without this exceptional item, PAT growth would have been even weaker — approximately 5.2%.
Sharda Motor Industries Cash Flow Analysis
Cash Flow Statement (Consolidated FY26)
| Cash from Operations (A) | ₹362.90 Cr |
| Cash from Investing (B) | -₹370.14 Cr |
| Cash from Financing (C) | -₹100.00 Cr |
| Capex (Gross) | ₹91.71 Cr |
| FCF (OCF − Net Capex) | ₹323.64 Cr |
| Dividend Paid (FY25 div) | ₹93.29 Cr |
Cash Quality Assessment
OCF (₹363 Cr) exceeds PAT (₹345 Cr) — this is a positive sign confirming that reported profits are backed by actual cash collection. The OCF/PAT ratio of 1.05x indicates clean earnings quality. However, trade receivables grew 27.0% (₹362 Cr vs ₹285 Cr), faster than revenue growth of 19.7%, suggesting some collection stretch. The dividend is funded entirely through current-year cash flow — FCF of ₹324 Cr comfortably covers the ₹115 Cr outflow. The ₹370 Cr cash used in investing includes ₹351 Cr net investment purchases (mutual funds/bonds), which are liquid and reversible, not locked-in capex.
Sharda Motor Industries Balance Sheet Strength
Balance Sheet Snapshot (Consolidated, Mar 2026)
| Total Assets | ₹2,215 Cr |
| Total Equity | ₹1,313 Cr |
| Cash & Equivalents | ₹92 Cr |
| Total Investments | ₹1,136 Cr |
| Cash + Investments | ₹1,231 Cr |
| Financial Debt (Leases) | ₹49 Cr |
| Net Cash Position | ₹46 Cr |
Strength Assessment
Sharda Motor operates with a fortress balance sheet. The company has zero long-term borrowings — confirmed explicitly in the filing (CRISIL noted "NIL long-term bank borrowings"). The only financial liabilities are ₹49 Crore in lease obligations. Against this, the company holds ₹1,231 Crore in cash and investments — more than 55% of total assets. This treasury pile is 10.72x the dividend outflow, meaning the company could theoretically pay this dividend for over a decade from liquid assets alone, without earning another rupee. The trade payable of ₹775 Crore is the largest liability, reflecting normal supplier credit terms for an auto component manufacturer.
Sharda Motor Industries Dividend Sustainability Analysis
4-Test Sustainability Scorecard
| Test | Ratio | Threshold | Result |
|---|---|---|---|
| Earnings Coverage (EPS ÷ DPS) | 3.01x | ≥1.5x | PASS |
| OCF Coverage (OCF ÷ Outflow) | 3.16x | ≥1.5x | PASS |
| FCF Coverage (FCF ÷ Outflow) | 2.82x | ≥1.0x | PASS |
| Cash Coverage (Cash+Inv ÷ Outflow) | 10.72x | ≥3.0x | PASS |
Verdict: SUSTAINABLE (4/4 Tests Passed)
Sharda Motor's dividend passes all four sustainability tests with comfortable margins. The 3.01x earnings coverage means the company earns ₹3 for every ₹1 it distributes. The 10.72x cash coverage is exceptional — few mid-cap companies maintain liquid reserves at 10x their annual dividend. The dividend is funded by operating cash flow, not by drawing down reserves or borrowing. The only caution: if raw material inflation continues compressing margins, earnings coverage could decline in future years. However, the current level provides a substantial buffer before sustainability becomes a concern.
Sharda Motor Industries Peer Comparison
| Company | MCap (Cr) | P/E | ROCE | ROE | Div Yield | Payout |
|---|---|---|---|---|---|---|
| Sharda Motor | ₹5,574 | 16.1x | 34.5% | 25.2% | 2.06% | 33% |
| Jamna Auto | ₹5,451 | 22.5x | 26.0% | 22.3% | 1.83% | 43% |
| Lumax Industries | ₹5,322 | 26.5x | 17.7% | 22.0% | 0.97% | 30% |
| Sandhar Tech | ₹3,560 | 17.0x | 12.3% | 11.5% | 0.68% | 12% |
Source: Screener.in, Sep 29, 2026. Peer data is approximate and subject to reporting period differences.
Sharda Motor leads peers across nearly every metric. It offers the highest dividend yield (2.06%) in the peer set, combined with the highest ROCE (34.5%) and the lowest P/E (16.1x). Jamna Auto is the closest comparable with 1.83% yield but trades at a 40% premium on P/E. Lumax Industries, despite similar market cap, yields under 1% and commands a 26.5x multiple. Sandhar Tech's 0.68% yield and 12.3% ROCE highlight Sharda Motor's superior capital efficiency. The only area where Sharda trails is payout ratio — Jamna Auto's 43% exceeds Sharda's 33%, though Sharda's lower payout signals greater room for dividend growth.
Sharda Motor Industries Promoter Impact Analysis
Shareholding Pattern (Jun 2026)
| Promoter & Promoter Group | 64.31% |
| FII / FPI | 1.73% |
| DII (Mutual Funds etc.) | 11.99% |
| Public & Others | 21.97% |
Promoter Dividend Income
With 64.31% promoter holding, the Relan family (led by Managing Director Ajay Relan) will receive approximately ₹73.84 Crore from this dividend. This represents the largest single beneficiary of the distribution. Minority shareholders (35.69%) will collectively receive ₹40.98 Crore. The high promoter stake aligns management interests with dividend sustainability — promoters benefit most from continued payouts. DII holding of 11.99% includes institutional investors who typically favor consistent dividend payers, providing a stable shareholder base. FII participation at 1.73% remains low, suggesting the stock is under-owned by foreign institutions.
Sharda Motor Industries Dividend Taxation Analysis
Indian Dividend Tax Rules
Under current Indian tax law, dividends are taxable at the shareholder's applicable income tax slab rate. Companies deduct TDS at 10% on dividend exceeding ₹5,000 per shareholder per financial year (Section 194). Shareholders can claim this TDS as credit while filing their annual income tax return. Non-resident shareholders may face different TDS rates based on applicable DTAA provisions.
Worked Example: 1,000 Shares at 30% Tax Slab
| Shares Held | 1,000 |
| DPS | ₹20 |
| Gross Dividend | ₹20,000 |
| TDS Deducted (10%) | ₹2,000 |
| Tax at 30% Slab | ₹6,000 |
| Health & Education Cess (4%) | ₹240 |
| Total Tax Liability | ₹6,240 |
| Net Dividend (Post-Tax) | ₹13,760 |
| Effective Yield (Post-Tax) | 1.42% |
Sharda Motor Industries Key Risks
- Raw Material Inflation: Steel and precious metals (palladium, platinum for catalytic converters) constitute 74.9% of revenue. Any sustained commodity spike directly compresses margins and threatens earnings-funded dividends.
- OEM Concentration Risk: Revenue is concentrated among a handful of OEMs (Maruti Suzuki, Hyundai, Tata Motors). Loss of a single major client would materially impact volumes and cash flows.
- EV Transition Threat: Electric vehicles do not require exhaust systems — Sharda Motor's core product. While the timeline is uncertain (likely 2030+), the structural obsolescence risk for ICE exhaust components is real and growing.
- Receivables Growth Outpacing Revenue: Trade receivables grew 27% vs 19.7% revenue growth in FY26, signaling potential collection delays or extended credit terms to OEMs that could strain working capital.
- Large Investment Portfolio Risk: ₹1,136 Crore in investments (51% of total assets) exposes the company to mark-to-market volatility. A significant market downturn could impair investment values.
- Regulatory Changes: New labour codes (already recognized as exceptional item) and evolving emission norms create compliance cost uncertainties that may affect future profitability.
- Low FII Participation: Only 1.73% FII holding indicates limited institutional oversight and potentially lower governance scrutiny compared to broader-held peers.
Sharda Motor Industries — What To Monitor
- Quarterly Raw Material Cost as % of Revenue: FY26's 74.9% is elevated. Any sustained move above 76% would directly threaten dividend sustainability by compressing PAT.
- Trade Receivable Days: Monitor whether the FY26 increase in receivables (27% growth vs 19.7% revenue) reverses or worsens, indicating OEM payment stress.
- EV Penetration Rate in India: Track quarterly EV sales mix — particularly in passenger vehicles. A rapid shift would accelerate the timeline for exhaust system demand decline.
- Investment Portfolio Composition: ₹1,136 Crore in investments is substantial. Track whether management shifts toward higher-risk instruments or maintains conservative treasury allocation.
- Promoter Holding Changes: Any reduction from the current 64.31% stake would be a negative signal for dividend continuity and alignment of interests.
- New Order Wins and Client Diversification: Watch for announcements of new OEM relationships or export orders that reduce concentration risk.
- Capex Plans for Non-Exhaust Products: Any investment in EV-compatible components (battery casings, thermal management) would signal strategic adaptation.
Sharda Motor Industries Dividend — Conclusion
Sharda Motor Industries' ₹20 final dividend for FY2025-26 reflects a company at the peak of its operational cycle — ₹3,397 Crore revenue, ₹345 Crore PAT, 34.5% ROCE, and a fortress balance sheet with ₹1,231 Crore in liquid assets against zero long-term debt. The dividend passes all four sustainability tests with room to spare. The 2.06% yield leads the auto component peer set, and the 27.5% DPS CAGR over 9 years demonstrates management's commitment to progressive shareholder returns. On the other side, raw material margin compression (PAT growth lagging revenue by 920 bps), receivables stretch, and the long-term EV transition risk warrant attention. This is not a passive income play — it is a capital-efficient compounder that distributes a disciplined share of its growing earnings.
Frequently Asked Questions About Sharda Motor Industries Dividend
What dividend has Sharda Motor Industries announced for FY2025-26?
What is the dividend yield of Sharda Motor Industries?
What is the record date for Sharda Motor Industries dividend?
What is the ex-dividend date for Sharda Motor Industries?
When will Sharda Motor Industries dividend be paid?
Who is eligible for Sharda Motor Industries FY26 dividend?
How is Sharda Motor Industries dividend taxed in India?
Is Sharda Motor Industries dividend sustainable?
What is Sharda Motor Industries dividend history?
What should investors monitor about Sharda Motor Industries going forward?
Why does Sharda Motor Industries show 1000% dividend?
How does Sharda Motor Industries dividend compare with peers?
Disclaimer
This article is published by ShareBazaar Online for informational and educational purposes only. It does not constitute investment advice, a recommendation to buy, sell, or hold any security, or a solicitation to invest in any financial instrument. All data has been sourced from publicly available company filings, stock exchanges, and third-party financial data providers. While every effort has been made to ensure accuracy, ShareBazaar Online does not guarantee the completeness or correctness of any information presented. Investors should conduct their own independent research and consult a qualified financial advisor before making any investment decisions. Past dividend payments do not guarantee future distributions. Stock prices and dividend yields are subject to market risks. ShareBazaar Online, its authors, and affiliates do not hold any position in Sharda Motor Industries Limited. Data as of September 29, 2026 unless otherwise stated.