
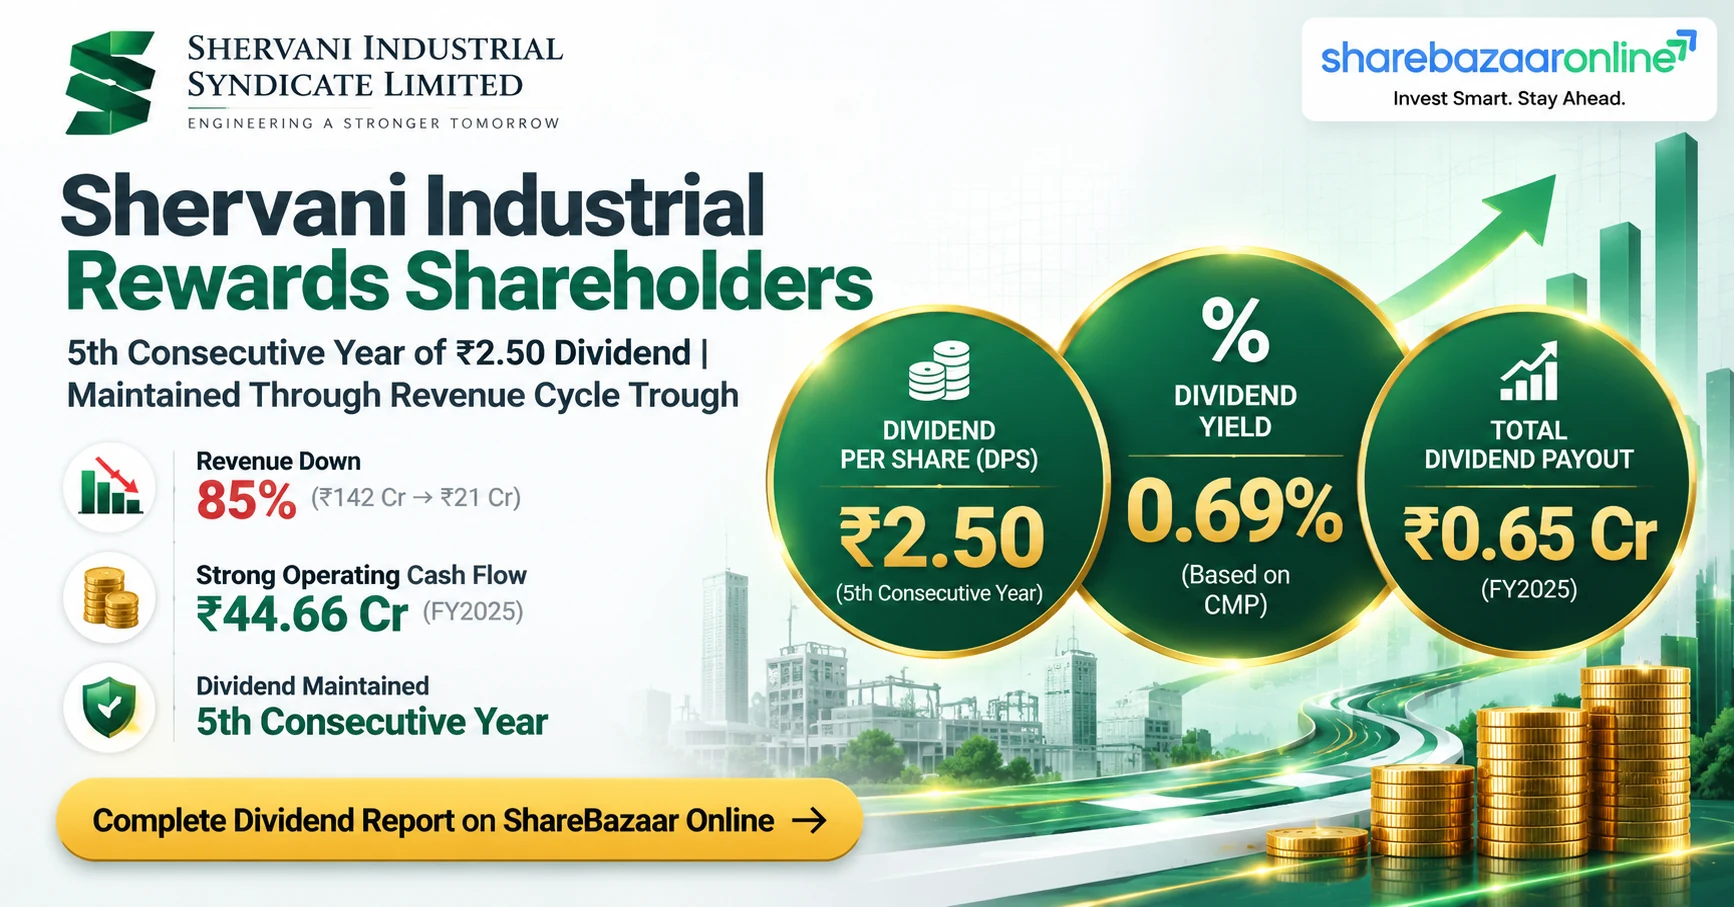
Dividend Snapshot – Shervani Industrial Syndicate Limited
Dividend Details
| Company | Shervani Industrial Syndicate Ltd |
| BSE Code | 526117 |
| NSE Symbol | SHERVANI |
| ISIN | INE011D01013 |
| Dividend Type | Final Dividend |
| Face Value | ₹10 |
| Dividend Rate | 25% |
| Dividend Per Share | ₹2.50 |
| Financial Year | 2025–26 |
| Dividend Yield | 0.69% |
Key Dates & Market Data
| Announcement Date | 30-Aug-2026 |
| Record Date | 18-Sep-2026 |
| Ex-Dividend Date | 17-Sep-2026 (Inferred) |
| AGM Date | 28-Sep-2026 (Passed) |
| Expected Payment | By 28-Oct-2026 |
| CMP (Announcement) | ₹342.75 |
| CMP (Latest) | ₹359.85 |
| Market Cap | ₹93.20 Cr |
| P/B Ratio | 0.70x |
| Book Value | ₹512.63/share |
Shervani Industrial Syndicate Limited – Company Overview
Shervani Industrial Syndicate Limited (BSE: 526117, NSE: SHERVANI) is a Lucknow-headquartered company primarily engaged in real estate development and hospitality. Incorporated in 1983, the company develops residential and commercial properties in Uttar Pradesh and operates the Shervani brand of hotels. Its equity capital stands at ₹2.59 Cr (25,90,000 shares of ₹10 face value), making it a micro-cap with a market capitalisation of ₹93.20 Cr. Promoter holding is 62.07%, with minimal institutional participation. The company's revenues are cyclical, driven by real estate project completion timelines — FY26 revenue was ₹21.37 Cr, down sharply from ₹142.70 Cr in FY24, reflecting project delivery cycles rather than business decline.
Shervani Industrial Syndicate Limited – Financial Analysis
Profitability Metrics (FY26)
| Revenue | ₹21.37 Cr |
| Net Profit (PAT) | ₹-0.73 Cr (Loss) |
| EPS | ₹-2.84 |
| ROE | -0.55% |
| ROCE | 1.35% |
Balance Sheet Highlights
| Total Equity | ₹132.77 Cr |
| Total Borrowings | ₹72.10 Cr |
| Debt-to-Equity | 0.54x |
| Book Value/Share | ₹512.63 |
| Cash & Investments | ₹2.60 Cr |
Operating Leverage Breakdown
Revenue declined 85% from ₹142.70 Cr (FY24) to ₹21.37 Cr (FY26), while PAT swung from ₹6.80 Cr profit to ₹-0.73 Cr loss. This operating deleverage is structural in real estate — once a project is delivered, revenue recognition halts until the next project reaches completion. Fixed costs (employee expenses, interest on ₹72.10 Cr borrowings) persisted, converting a revenue drought into a net loss. The EBITDA margin compressed sharply as overhead spread over a fraction of previous revenue. This is not margin erosion from input costs but a project-cycle gap that could reverse when ongoing developments reach revenue-recognition milestones.
Expert Commentary on Shervani Industrial Syndicate Limited Dividend
Shervani Industrial Syndicate's decision to declare a ₹2.50 final dividend despite a net loss of ₹0.73 Cr raises a critical question: is the company rewarding shareholders or masking weakness? The dividend is funded not by current profits but by strong operating cash flow of ₹44.66 Cr — largely advance collections from real estate buyers. While legally permissible from accumulated reserves, this pattern demands scrutiny. The 0.69% yield offers negligible income. However, the company trades at just 0.70x book value (₹512.63 vs CMP ₹359.85), suggesting the market prices in project-cycle uncertainty. The real story here is not the dividend — it is whether Shervani's ongoing real estate pipeline can convert ₹44 Cr of advances into recognised revenue and restore profitability.
Future Outlook – Shervani Industrial Syndicate Limited
Shervani's near-term outlook hinges on its real estate project pipeline in Uttar Pradesh. The ₹44.66 Cr operating cash flow indicates active advance collection, suggesting projects are selling. Revenue recognition will follow project completion. Borrowings doubling to ₹72.10 Cr signals active construction investment — potentially positive if projects deliver on time. The hospitality segment provides steady but small contribution. Key watchpoints: RERA-registered project timelines, land bank monetisation, and whether FY27 brings a revenue recovery. If revenue returns to even half of FY24 levels (₹70+ Cr), profitability and dividend sustainability would improve materially. Until then, dividend continuation at this level depends on management's willingness to distribute from reserves despite losses.
Shervani Industrial Syndicate Limited – Dividend Announcement Summary
The Board of Directors of Shervani Industrial Syndicate Limited recommended a final dividend of 25% (₹2.50 per share) on equity shares of ₹10 face value for FY2025–26. The recommendation was announced on 30 August 2026. This dividend was subject to shareholder approval at the Annual General Meeting held on 28 September 2026, which has now passed. Shareholders who held shares on the record date of 18 September 2026 were eligible. The total dividend outflow is approximately ₹0.65 Cr on 25,90,000 equity shares. The dividend is expected to be credited within 30 days of AGM approval — by 28 October 2026. This continues the company's practice of maintaining dividends even during cyclical revenue downturns.
Shervani Industrial Syndicate Limited – Key Dates Timeline
Shervani Industrial Syndicate Limited – Dividend Yield Analysis
Yield Calculations
| DPS | ₹2.50 |
| CMP (Latest) | ₹359.85 |
| Current Yield | 0.69% |
| CMP (Announcement Date) | ₹342.75 |
| Announcement Yield | 0.73% |
Yield Reality Check
At 0.69%, Shervani's yield is significantly below the 1-year bank FD rate (~7%) and even below most large-cap dividend payers (~1–2%). The low yield is driven by a modest ₹2.50 DPS on a ₹360 stock — not by an elevated share price. The stock trades at a 30% discount to book value, so the low yield reflects genuinely small payouts, not an inflated denominator. This dividend is symbolic continuity rather than meaningful income. Income-focused investors would find this yield insufficient as a standalone return proposition.
Shervani Industrial Syndicate Limited – Dividend History Analysis
| Financial Year | DPS (₹) | Dividend % | Type |
|---|---|---|---|
| FY2025–26 | ₹2.50 | 25% | Final |
| FY2024–25 | ₹2.50 | 25% | Final |
| FY2023–24 | ₹2.50 | 25% | Final |
| FY2022–23 | ₹2.50 | 25% | Final |
| FY2021–22 | ₹2.50 | 25% | Final |
| FY2020–21 | Nil | 0% | — |
| FY2019–20 | Nil | 0% | — |
| FY2018–19 | ₹2.50 | 25% | Final |
| FY2017–18 | ₹2.50 | 25% | Final |
| FY2016–17 | ₹2.00 | 20% | Final |
History Classification: Irregular Payer
Shervani has paid dividends in 8 of the last 10 years, with a two-year gap during FY20–FY21 (COVID era). When paid, the dividend has been remarkably consistent at ₹2.50/share (25%) since FY18. There is no dividend growth — the same ₹2.50 has been maintained for five consecutive years. The two-year suspension classifies this as an Irregular Payer rather than a Consistent Payer. Notably, the company has maintained the same ₹2.50 payout regardless of profit levels — paying through both strong years (FY24 PAT ₹6.80 Cr) and loss years (FY26 PAT ₹-0.73 Cr), suggesting management treats the dividend as a fixed commitment.
Shervani Industrial Syndicate Limited – Financial Performance Analysis
| Metric | FY24 | FY25 | FY26 | Trend |
|---|---|---|---|---|
| Revenue (₹ Cr) | 142.70 | 57.58 | 21.37 | ▼ 85% |
| PAT (₹ Cr) | 6.80 | 4.80 | -0.73 | ▼ Loss |
| EPS (₹) | 25.19 | 18.68 | -2.84 | ▼ Loss |
| ROE (%) | 5.36% | 3.66% | -0.55% | ▼ |
| DPS (₹) | 2.50 | 2.50 | 2.50 | → Flat |
The financial trajectory shows a company in the trough of a real estate project cycle. Revenue declined from ₹142.70 Cr to ₹21.37 Cr over two years — an 85% collapse — as completed projects were delivered and new ones have not yet reached revenue-recognition stages. PAT swung to a ₹0.73 Cr loss in FY26. Despite this, dividends remained unchanged at ₹2.50, resulting in a negative payout ratio (dividend from loss). The company is distributing ₹0.65 Cr to shareholders while losing money — funded from accumulated reserves of its profitable years, not current earnings.
Shervani Industrial Syndicate Limited – Cash Flow Analysis
Cash Flow Summary (FY26)
| Operating Cash Flow | ₹44.66 Cr |
| Net Profit (PAT) | ₹-0.73 Cr |
| OCF / PAT | Negative PAT |
| Capital Expenditure | ₹12.91 Cr |
| Free Cash Flow | ₹31.75 Cr |
| FCF / Dividend Outflow | 48.8x |
| Cash & Equivalents | ₹2.60 Cr |
Critical OCF vs PAT Divergence
This is the most important number in Shervani's financials: OCF of ₹44.66 Cr versus PAT of ₹-0.73 Cr. The company is loss-making on accrual accounting but generated massive cash. The divergence comes from real estate advance collections — buyers pay advances for under-construction projects. These appear as operating cash inflow but cannot be recognised as revenue until project completion. This means the company has cash, but it is committed money — future delivery obligations, not free profit. FCF of ₹31.75 Cr covers the ₹0.65 Cr dividend 48.8 times over, but this cash coverage may be misleading given the delivery obligations attached to these advances.
Balance Sheet Strength – Shervani Industrial Syndicate Limited
Strength Indicators
- ✅ Book Value ₹512.63/share vs CMP ₹359.85 — 30% margin of safety
- ✅ Equity base of ₹132.77 Cr supports modest dividend outflow
- ✅ OCF ₹44.66 Cr demonstrates cash generation ability
Concern Areas
- ⚠️ Borrowings doubled from ₹31.54 Cr (FY24) to ₹72.10 Cr (FY26)
- ⚠️ D/E ratio at 0.54x — moderate but rising fast
- ⚠️ Cash on hand only ₹2.60 Cr — thin liquid buffer
- ⚠️ Interest burden growing while revenue declining
The balance sheet tells a tale of two forces. On one hand, ₹132.77 Cr equity and ₹512.63 book value provide a substantial asset base. On the other, borrowings have doubled in two years to ₹72.10 Cr, signaling aggressive project funding through debt during a revenue trough. The company's cash position of just ₹2.60 Cr is thin for a company with ₹72 Cr in debt. Net debt stands at approximately ₹69.50 Cr. While the 0.54x D/E ratio appears moderate in isolation, the rapid trajectory from 0.25x to 0.54x in two years warrants monitoring.
Shervani Industrial Syndicate Limited – Dividend Sustainability Analysis
4-Test Sustainability Scorecard
| Test | Metric | Value | Result |
|---|---|---|---|
| Earnings Coverage | EPS vs DPS | ₹-2.84 vs ₹2.50 | ❌ FAIL |
| OCF Coverage | OCF vs Outflow | ₹44.66 Cr vs ₹0.65 Cr | ✅ PASS |
| FCF Coverage | FCF vs Outflow | ₹31.75 Cr vs ₹0.65 Cr | ✅ PASS |
| Liquidity Buffer | Cash / Outflow | ₹2.60 Cr / ₹0.65 Cr = 4.0x | ✅ PASS |
Verdict: Conditionally Sustainable
The dividend passes 3 of 4 tests — but the one it fails is the most fundamental. The earnings test failure (negative EPS) means the dividend is not backed by current profits. It survives because of strong cash flows from advance collections and modest payout size (₹0.65 Cr is tiny relative to the balance sheet). Sustainability is conditional on: (a) real estate projects being completed to convert advances into revenue, and (b) borrowings not consuming the cash position. If multiple projects face delays simultaneously, the cash cushion could evaporate.
Shervani Industrial Syndicate Limited – Peer Comparison
| Company | Yield | ROE | D/E | P/B |
|---|---|---|---|---|
| Shervani Industrial | 0.69% | -0.55% | 0.54x | 0.70x |
| DLF Ltd | ~0.6% | ~9% | ~0.08x | ~5.5x |
| Godrej Properties | ~0.3% | ~8% | ~0.5x | ~5.0x |
| Oberoi Realty | ~0.4% | ~15% | ~0.1x | ~3.0x |
| Prestige Estates | ~0.2% | ~6% | ~0.9x | ~4.5x |
Source: Screener.in, Moneycontrol. Peer data approximate based on latest available filings.
Shervani's 0.69% yield is broadly in line with the real estate sector, where yields are typically low (0.2–0.6%) as companies reinvest in land and projects. However, peers trade at 3x–5.5x book value versus Shervani's 0.70x — reflecting the market's premium for larger, more predictable developers. Shervani's negative ROE is the clear outlier; all peers generate positive returns. The D/E of 0.54x is moderate relative to Prestige (0.9x) but high compared to asset-light models like DLF and Oberoi. The deep book-value discount may reflect micro-cap illiquidity, cyclical trough, and limited institutional coverage rather than asset impairment.
Promoter Impact Analysis – Shervani Industrial Syndicate Limited
Promoter Dividend Benefit
| Promoter Holding | 62.07% |
| Promoter Shares | 16,07,613 |
| Total Dividend Outflow | ₹0.65 Cr |
| Promoter Dividend Income | ₹0.40 Cr |
| Minority Share | ₹0.25 Cr |
Capital Allocation Assessment
Promoters receive ₹0.40 Cr (62% of the outflow) — a modest sum that is unlikely to be the primary motivation for declaring dividends during a loss year. The total outflow of ₹0.65 Cr is negligible relative to the company's ₹132.77 Cr equity or ₹44.66 Cr OCF. Alternative uses for this capital include: debt reduction (₹0.65 Cr against ₹72.10 Cr debt is immaterial), project investment, or share buyback (impractical given micro-cap size). The dividend appears to serve a signaling function — maintaining continuity to reassure shareholders during a project-cycle trough.
Shervani Industrial Syndicate Limited – Dividend Taxation Analysis
Indian Dividend Tax Rules (Current Regime)
Under current Indian tax law, dividends are taxable in the hands of the shareholder at their applicable income tax slab rate. Companies deduct TDS at 10% if aggregate dividend income from a company exceeds ₹5,000 in a financial year. Shareholders must report all dividend income in their ITR and pay the applicable tax. No surcharge exemption applies to dividend income for individuals in higher brackets.
Worked Example: 1,000 Shares at 30% Tax Slab
| Shares Held | 1,000 |
| Dividend Per Share | ₹2.50 |
| Gross Dividend | ₹2,500 |
| TDS (10%) | ₹250 (if > ₹5,000 aggregate) |
| Tax at 30% Slab | ₹750 |
| Net Dividend After Tax | ₹1,750 |
| Effective Post-Tax Yield | 0.49% |
| Investment Value (1000 × ₹359.85) | ₹3,59,850 |
Note: Actual TDS is deducted only if aggregate dividend from this company exceeds ₹5,000 in the financial year. For 1,000 shares (₹2,500 dividend), TDS may not apply. Tax is still payable at filing.
Key Risks – Shervani Industrial Syndicate Limited Dividend
- 1.Dividend from losses: The company is paying dividends despite a net loss of ₹0.73 Cr in FY26. Sustained losses would deplete reserves and force a dividend cut or suspension, as occurred in FY20–21.
- 2.Borrowings doubling: Debt surged from ₹31.54 Cr (FY24) to ₹72.10 Cr (FY26), raising interest costs during a revenue trough. If project deliveries are delayed, debt-servicing could strain the cash position.
- 3.Revenue concentration risk: Revenue collapsed 85% in two years due to project-cycle dependence. A single delayed project can wipe out an entire year's revenue recognition.
- 4.Micro-cap illiquidity: With only 25.9 lakh shares and ₹93 Cr market cap, trading volumes are extremely thin. Exit at desired prices may be difficult during market stress.
- 5.Advance collection risk: The ₹44.66 Cr OCF is primarily buyer advances — committed money with delivery obligations. If projects face construction or regulatory delays, this cash cannot be treated as distributable profit.
- 6.Geographic concentration: Operations concentrated in Uttar Pradesh expose the company to state-level regulatory, demand, and real estate cycle risks.
- 7.No institutional ownership: Minimal FII/DII participation means limited external governance oversight and price discovery is driven by retail flows.
What To Monitor – Shervani Industrial Syndicate Limited
- 1.Quarterly revenue recognition: Watch for a revenue rebound in Q2–Q4 FY27 as ongoing projects near completion. A return to ₹50+ Cr quarterly revenue would signal cycle recovery.
- 2.Borrowing trajectory: Track whether debt continues rising beyond ₹72 Cr or stabilises. Further aggressive borrowing without matching revenue recovery is a red flag.
- 3.RERA project status: Check RERA-registered project completion timelines in Uttar Pradesh. These are the lead indicators for future revenue recognition.
- 4.Operating cash flow sustainability: FY26's ₹44.66 Cr OCF was driven by advances. If advance inflows slow while delivery obligations remain, the cash flow picture could deteriorate.
- 5.Promoter holding changes: Any reduction in 62.07% promoter stake would be a negative signal, particularly in a micro-cap with thin institutional holding.
- 6.Interest coverage ratio: With growing debt and falling profits, monitor whether operating income remains sufficient to cover interest payments.
- 7.New project launches: Announcements of new residential or commercial projects would indicate management confidence in the pipeline and future revenue visibility.
Conclusion – Shervani Industrial Syndicate Limited Dividend
Shervani Industrial Syndicate's 25% final dividend (₹2.50/share) for FY2025–26 continues a five-year streak of consistent payouts, but the context has changed materially. The company is paying from a net loss position — a first in its recent dividend history. The 0.69% yield offers minimal income value, especially after tax (effective ~0.49% at 30% slab). The investment case here is not dividend income — it is the deep 30% discount to book value, strong OCF generation, and potential revenue recovery as real estate projects complete. Key positives: cash flow strength, consistent dividend culture, and sub-book valuation. Key negatives: net loss, doubling debt, revenue collapse, and micro-cap risks. Investors should evaluate Shervani as a cyclical asset-value play rather than a dividend income stock.
Frequently Asked Questions – Shervani Industrial Syndicate Limited Dividend
What dividend has Shervani Industrial Syndicate Limited announced for FY2025–26?
What is the dividend yield of Shervani Industrial Syndicate shares?
What is the record date for Shervani Industrial Syndicate dividend?
What is the ex-dividend date for Shervani Industrial Syndicate?
When will Shervani Industrial Syndicate pay the dividend?
Who is eligible for the Shervani Industrial Syndicate dividend?
How is Shervani Industrial Syndicate's dividend taxed in India?
Is Shervani Industrial Syndicate's dividend sustainable?
What is Shervani Industrial Syndicate's dividend history over the last 10 years?
What should investors monitor after this dividend announcement?
Why is Shervani paying a dividend despite reporting a net loss?
How does Shervani Industrial Syndicate's dividend yield compare with peers?
Disclaimer
This article is published by ShareBazaar Online for educational and informational purposes only. It does not constitute investment advice, stock recommendation, or an offer to buy or sell securities. The information presented is based on publicly available data, company filings, and third-party sources believed to be reliable but not independently verified for completeness or accuracy. All financial figures, ratios, and calculations are based on data available as of the date of publication and may change. Dividend payments are subject to company decisions and regulatory approvals. Past dividend payments do not guarantee future dividends. Stock investments are subject to market risks. Readers should consult a qualified financial advisor before making investment decisions. The author and ShareBazaar Online do not hold any position in the stocks mentioned and have no business relationship with the company discussed. Keyword metrics in this article are marked "Not Independently Verified (NIV)" where Semrush/Ahrefs tools were unavailable at the time of research.