
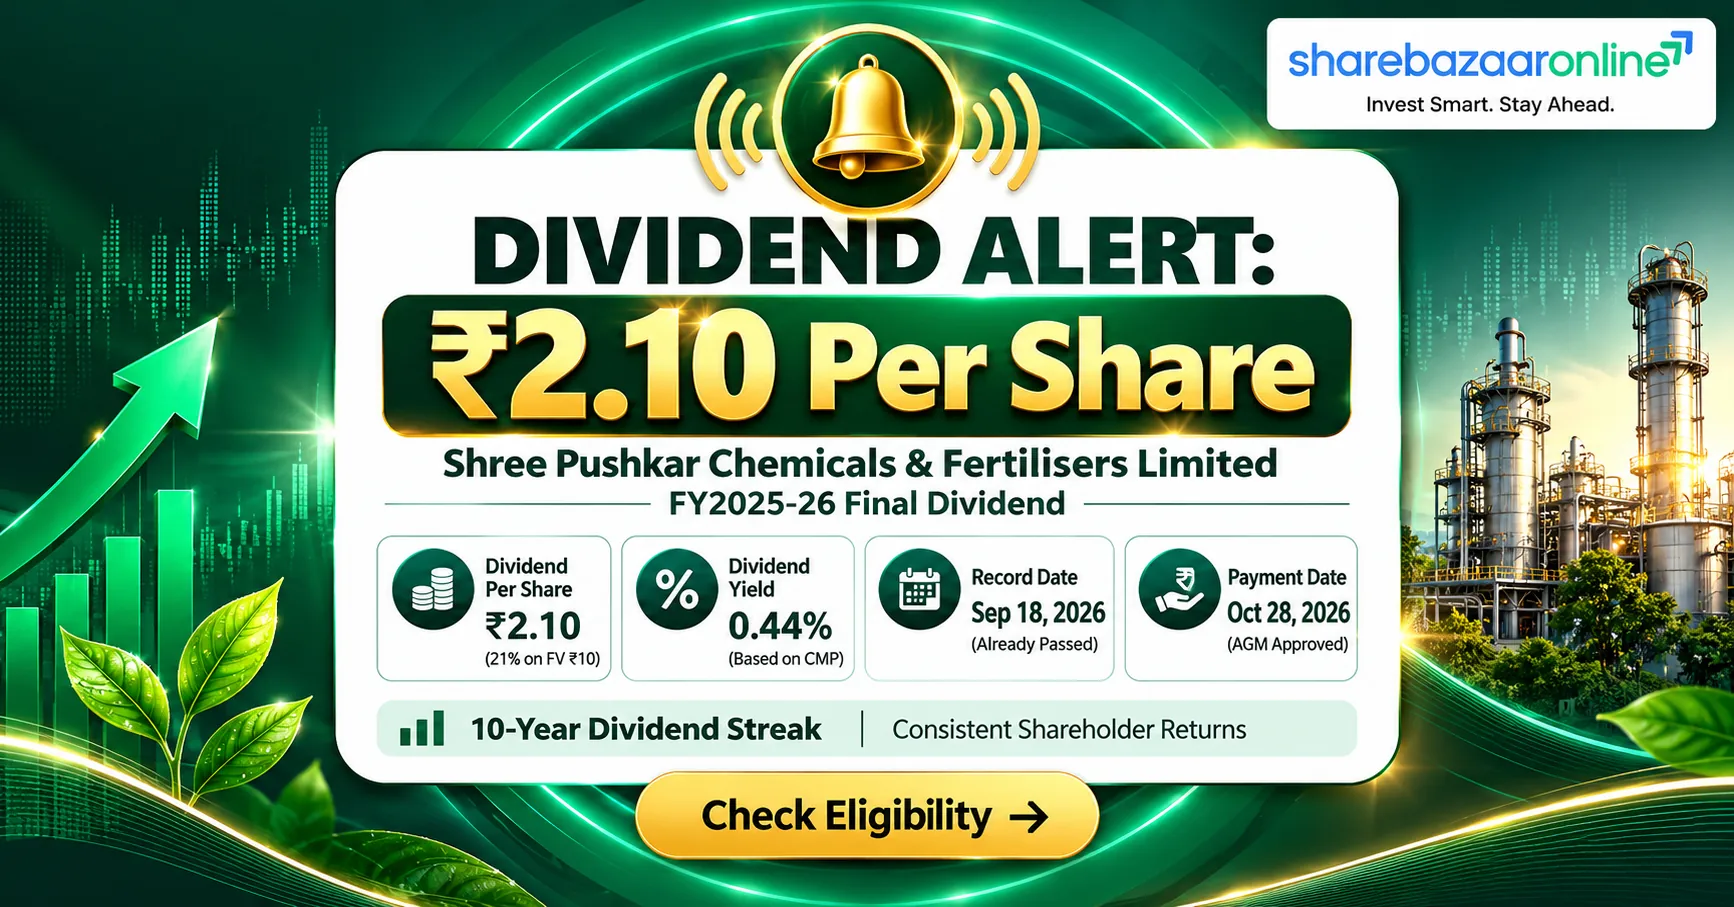
Dividend Snapshot – Shree Pushkar Chemicals & Fertilisers Limited
Dividend Details
| Company | Shree Pushkar Chemicals & Fertilisers Ltd |
| NSE / BSE | SHREEPUSHK / 539334 |
| ISIN | INE712K01011 |
| Dividend Type | Final Dividend |
| Face Value | ₹10 |
| Dividend Per Share | ₹2.10 (21%) |
| Financial Year | FY2025-26 |
| Dividend Yield (CMP) | 0.44% |
Market Data
| CMP (Sep 29, 2026) | ₹482 |
| Market Cap | ₹1,555 Cr |
| 52-Week Range | ₹272 – ₹545 |
| EPS (FY26) | ₹21.68 |
| P/E Ratio | 22.2x |
| ROE / ROCE | 12.1% / 13.0% |
| Promoter Holding | 69.36% |
| Dividend Outflow | ₹6.79 Cr |
Shree Pushkar Chemicals & Fertilisers – Company Overview
Shree Pushkar Chemicals & Fertilisers Limited is a specialty chemicals manufacturer headquartered in Mumbai, listed on both NSE (SHREEPUSHK) and BSE (539334). The company operates across dyes & dye intermediates, fertilisers (SSP) and cattle feed segments. Its product portfolio includes H-Acid, Vinyl Sulphone, Gamma Acid and other intermediates used in textile dyes. For FY2025-26, consolidated revenue reached ₹977 Cr with PAT of ₹70 Cr. The company has four subsidiaries: Kisan Phosphates Pvt Ltd, Madhya Bharat Phosphate Pvt Ltd, Dyecol Color Technologies Pvt Ltd (w.e.f. Sep 2025) and Dyecol Bangladesh Ltd (w.e.f. Nov 2025). Promoter holding stands at 69.36% with negligible institutional interest (FII: 0.50%, DII: 0.00%).
Shree Pushkar Chemicals Financial Analysis – FY2025-26
Profitability
Consolidated revenue grew 21.1% YoY to ₹977 Cr in FY26, driven by stronger dye intermediate volumes and improved SSP realisations. PAT rose 19.6% to ₹70 Cr, translating to EPS of ₹21.68 (vs ₹18.13 in FY25). Positive operating leverage is visible: revenue growth is tracking ahead of cost escalation. ROCE stands at 13% and ROE at 12.1% — both moderate for specialty chemicals but improving from prior years. The dividend payout ratio is a conservative 9.69%, leaving ample room for reinvestment.
Key Ratios
| Revenue (FY26) | ₹976.63 Cr |
| PAT (FY26) | ₹70.10 Cr |
| EPS (FY26) | ₹21.68 |
| Revenue Growth | +21.1% |
| PAT Growth | +19.6% |
| Payout Ratio | 9.69% |
| Coverage Ratio | 10.32x |
Shree Pushkar Chemicals Dividend History (Last 10 Years)
| Financial Year | Type | DPS (₹) | Dividend % | Trend |
|---|---|---|---|---|
| FY2025-26 | Final | 2.10 | 21% | ▲ |
| FY2024-25 | Final | 2.00 | 20% | ▲ |
| FY2023-24 | Final | 1.50 | 15% | — |
| FY2022-23 | Final | 1.50 | 15% | — |
| FY2021-22 | Final | 1.50 | 15% | ▲ |
| FY2020-21 | Final | 1.00 | 10% | ▲ |
| FY2019-20 | Final | 0.50 | 5% | ▼ |
| FY2018-19 | Final | 1.00 | 10% | — |
| FY2017-18 | Final | 1.00 | 10% | ▲ |
| FY2016-17 | Final | 0.50 | 5% | — |
Source: Company filings, BSE. Classification: Consistent Payer – Growing Trend. DPS has grown from ₹0.50 to ₹2.10 over 10 years (320% growth). No dividend suspensions on record.
Shree Pushkar Chemicals – Expert Commentary
The 21% dividend on face value may appear generous, but the actual yield at CMP of ₹482 is just 0.44% — significantly below bank FD rates and most specialty chemical peers. This is a face-value illusion: a ₹2.10 payout on a ₹482 stock offers negligible current income. The positive signals are the growing dividend trajectory (DPS up 320% over 10 years) and a conservative 9.69% payout ratio that leaves 90% of earnings for reinvestment. The concern is negative FCF (₹-14.68 Cr) driven by heavy capex, suggesting the company is in an expansion phase. Management is funding dividends from operating cash flows, not borrowings — a healthy sign despite the tight FCF position.
Shree Pushkar Chemicals – Future Outlook
The company is investing aggressively via new subsidiaries (Dyecol Color Technologies and Dyecol Bangladesh, both added in FY26) to expand its dye intermediate footprint. Revenue grew 21% in FY26 and earnings momentum remains positive. If capex cycles normalise and FCF turns positive in FY27-28, dividend growth could accelerate beyond the current 5% annual increment. The key variable is raw material costs — sulphuric acid, naphthalene and phosphate rock prices directly impact margins. With 69.36% promoter holding and minimal institutional interest, promoters have strong incentive to sustain dividends (promoter income: ₹4.71 Cr). Investors should watch for quarterly margin trends and the capex-to-OCF ratio as leading indicators.
Shree Pushkar Chemicals Dividend Announcement Summary
On May 18, 2026, the Board of Directors of Shree Pushkar Chemicals & Fertilisers Limited recommended a final dividend of ₹2.10 per share (21% on face value of ₹10) for FY2025-26. The dividend was subject to shareholder approval at the AGM. The AGM was held on September 28, 2026, and the dividend has been approved. The record date was set as September 18, 2026. The total dividend outflow is approximately ₹6.79 Cr on 3.23 Cr equity shares. This represents a 5% increase over the ₹2.00 DPS paid in FY25, continuing the company’s progressive dividend policy.
Shree Pushkar Chemicals – Key Dates Timeline
Announcement
18 May 2026
Board Meeting
Ex-Date
18 Sep 2026
Passed
Record Date
18 Sep 2026
Passed
Payment Date
28 Oct 2026
Upcoming
AGM held on September 28, 2026. Dividend approved by shareholders. Shareholders who held shares on the record date (Sep 18, 2026) are eligible.
Shree Pushkar Chemicals Dividend Yield Analysis
Yield Breakdown
| DPS | ₹2.10 |
| CMP (Sep 29, 2026) | ₹482 |
| Current Yield | 0.44% |
| Ann. Date CMP (Est.) | ~₹370 |
| Announcement Yield | 0.57% |
Yield Reality Check
The 0.44% yield is below the 1-year bank FD rate (~7%) and the specialty chemicals sector average (~0.5%). The 21% dividend on face value creates a face-value illusion — the stock trades at 48x its face value, compressing actual yield. This is not a yield play. The investment thesis rests on capital appreciation driven by the company’s expanding dye intermediates business and new subsidiaries. The stock has appreciated 77% from its 52-week low of ₹272, partially offsetting the low current yield through capital gains.
Shree Pushkar Chemicals Dividend History Analysis
Shree Pushkar has paid dividends consistently for 10 consecutive years since listing, with no suspensions. DPS has grown from ₹0.50 (FY17) to ₹2.10 (FY26) — a 320% increase. The trajectory shows a clear step-up pattern: ₹0.50-1.00 (FY17-19), ₹1.00-1.50 (FY20-22), and ₹2.00-2.10 (FY25-26). The only dip occurred in FY20 (COVID year) when DPS halved to ₹0.50 before recovering. This classifies the company as a Consistent Payer with a Growing Trend. At just 9.69% payout ratio, management prioritises reinvestment while maintaining a token but growing dividend — appropriate for a mid-cap growth company.
Shree Pushkar Chemicals – Financial Performance Analysis
FY26 marked a strong year for Shree Pushkar. Consolidated revenue surged 21.1% from ₹807 Cr to ₹977 Cr, driven by capacity expansion in dye intermediates and better SSP realisations. PAT grew 19.6% to ₹70.10 Cr. Notably, revenue growth slightly outpaced PAT growth, suggesting minor margin dilution likely from new subsidiary integration costs (Dyecol entities added in FY26). EPS improved to ₹21.68 from ₹18.13. The debt-to-equity ratio at 0.26 remains conservative. Five-year revenue CAGR is approximately 15-17%, and PAT CAGR roughly 20%, indicating strong earnings compounding that underpins dividend growth.
Shree Pushkar Chemicals Cash Flow Analysis
Cash Flow Metrics (FY26)
| Operating Cash Flow | ₹101.82 Cr |
| Net Profit | ₹70.10 Cr |
| OCF/PAT Ratio | 1.45x |
| Capex (Investing) | ~₹116.50 Cr |
| Free Cash Flow | ₹-14.68 Cr |
| Dividend Outflow | ₹6.79 Cr |
Cash Quality Assessment
Positive: OCF at ₹101.82 Cr significantly exceeds reported PAT of ₹70.10 Cr (1.45x ratio), confirming earnings quality is high. Profits are backed by real cash generation, not accounting adjustments. Negative: FCF is ₹-14.68 Cr due to heavy capex (~₹117 Cr) for subsidiary expansion and capacity addition. The dividend is being funded from operating cash flows, not borrowings — a critical distinction. However, the negative FCF means the company is simultaneously borrowing for capex while paying dividends. This structure is acceptable during an expansion cycle but must be monitored.
Shree Pushkar Chemicals – Balance Sheet Strength
Cash & Bank
₹4.20 Cr
Total Borrowings
₹131.00 Cr
Net Debt
₹126.80 Cr
D/E Ratio
0.26
The balance sheet carries ₹131 Cr in borrowings against equity of ~₹506 Cr, yielding a conservative D/E of 0.26. Cash reserves at ₹4.20 Cr are thin — covering only 0.62x the annual dividend outflow. Net debt stands at ₹126.80 Cr, meaning the company is net-debt positive. However, borrowings are at a manageable level relative to OCF (1.29x OCF covers total borrowings). The thin cash buffer is a watch point — any earnings disruption could pressure dividend payments despite the low payout ratio.
Shree Pushkar Chemicals Dividend Sustainability Analysis
4-Test Sustainability Scorecard
| Test | Metric | Threshold | Result |
|---|---|---|---|
| Earnings Coverage | Payout 9.69% | <60% | ✔ PASS |
| OCF Coverage | 15.0x | >1.0x | ✔ PASS |
| FCF Coverage | -2.16x | >1.0x | ✘ FAIL |
| Liquidity Coverage | 0.62x | >1.0x | ✘ FAIL |
Verdict: Moderately Sustainable (2 of 4 tests passed)
Earnings comfortably cover the small payout and OCF is strong at 15x coverage. However, negative FCF from heavy capex and thin cash reserves prevent a fully sustainable rating. The dividend remains safe as long as OCF sustains at current levels.
Shree Pushkar Chemicals – Peer Comparison
| Company | Yield % | Payout % | ROE % | ROCE % |
|---|---|---|---|---|
| Shree Pushkar Chemicals | 0.44% | 9.69% | 12.1% | 13.0% |
| Aarti Industries | 0.45% | 12% | 10.5% | 12.0% |
| Vinati Organics | 0.12% | 8% | 16.0% | 20.0% |
| Clean Science | 0.30% | 15% | 18.5% | 23.0% |
| Navin Fluorine | 0.25% | 10% | 8.0% | 10.0% |
| NOCIL Ltd | 0.80% | 25% | 7.5% | 9.5% |
Source: Screener.in, company filings. Shree Pushkar’s yield is at par with Aarti Industries but its payout ratio is the lowest, indicating greater reinvestment focus. ROE and ROCE sit in the mid-range for the sector.
Shree Pushkar Chemicals – Promoter Impact Analysis
Promoter Dividend Income
| Promoter Holding | 69.36% |
| Total Dividend Outflow | ₹6.79 Cr |
| Promoter’s Share | ₹4.71 Cr |
| Minority Share | ₹2.08 Cr |
Analysis
With 69.36% promoter holding, the promoter group receives ₹4.71 Cr of the ₹6.79 Cr dividend outflow. This creates a natural incentive to sustain dividends. However, the absolute amount is modest. The near-zero institutional ownership (FII 0.50%, DII 0.00%) means there is no institutional pressure for higher payouts. The capital allocation choice between dividends, capex and debt reduction is entirely at the promoter’s discretion. Given the expansion phase (new subsidiaries), management has rightly prioritised reinvestment over dividend escalation.
Shree Pushkar Chemicals Dividend Taxation Analysis
Indian Dividend Tax Rules
Dividends are taxable at the investor’s income tax slab rate under the Income Tax Act (post Finance Act 2020). TDS of 10% is deducted if total dividend from a company exceeds ₹5,000 in a financial year. No TDS applies on amounts below this threshold. Investors must report dividend income under “Income from Other Sources” in their ITR and can claim TDS credit.
Worked Example (1,000 Shares)
| Shares Held | 1,000 |
| DPS | ₹2.10 |
| Gross Dividend | ₹2,100 |
| Tax (30% slab) | ₹630 |
| Net Dividend | ₹1,470 |
| Effective Yield | 0.30% |
At 30% tax slab, effective post-tax yield drops to just 0.30%. No TDS applies as gross dividend (₹2,100) is below ₹5,000 threshold.
Shree Pushkar Chemicals – Key Risks
- 1. Raw Material Volatility: Key inputs — sulphuric acid, naphthalene, phosphate rock — are globally traded commodities. A sharp spike can compress margins without immediate price pass-through to customers.
- 2. Negative Free Cash Flow: FCF was ₹-14.68 Cr in FY26. If capex remains elevated without proportionate revenue growth, the company may need to fund dividends from borrowings or cut payouts.
- 3. Thin Cash Buffer: Cash at ₹4.20 Cr covers only 0.62x of the annual dividend, leaving no room for earnings disruptions.
- 4. New Subsidiary Integration: Two new subsidiaries (Dyecol entities) added in FY26 carry integration risk. Bangladesh operations face currency and regulatory risk.
- 5. Concentration Risk: Heavy dependence on the dye intermediates market, which is cyclical and export-sensitive. Any downturn in the textile industry directly impacts volumes.
- 6. Low Institutional Interest: FII at 0.50% and DII at 0.00% — minimal institutional validation may limit price discovery and liquidity.
- 7. Regulatory and Environmental: Chemical manufacturing faces stringent pollution control norms. Any non-compliance can lead to plant shutdowns and penalty costs.
Shree Pushkar Chemicals – What To Monitor
- 1. Quarterly OCF Trend: Monitor whether operating cash flow sustains above ₹100 Cr annually. Any sharp drop signals earnings quality deterioration.
- 2. Capex-to-OCF Ratio: Currently above 1x (capex ₹117 Cr vs OCF ₹102 Cr). Normalisation below 0.7x would turn FCF positive and strengthen the sustainability rating.
- 3. Dyecol Subsidiary Performance: Track revenue contribution and profitability from Dyecol Color Technologies and Dyecol Bangladesh in quarterly results.
- 4. Raw Material Cost Movement: Watch naphthalene and sulphuric acid prices. Rising input costs without price hikes will compress EBITDA margins.
- 5. Debt Trajectory: Borrowings at ₹131 Cr. If debt rises significantly above ₹150 Cr while dividends are maintained, capital allocation discipline should be questioned.
- 6. Institutional Entry: Any meaningful FII or mutual fund entry would signal improved market confidence and potentially better governance standards.
- 7. SSP Fertiliser Policy: Government subsidy and pricing policy changes for Single Super Phosphate directly impact the fertiliser segment’s profitability.
Shree Pushkar Chemicals Dividend – Conclusion
Shree Pushkar Chemicals’ ₹2.10 final dividend for FY26 continues its 10-year record of consistent, growing payouts. At a 0.44% yield, this is not an income stock — the real value lies in capital appreciation backed by 21% revenue growth and a strategic expansion into Bangladesh. The 9.69% payout ratio is ultra-conservative, ensuring nearly all earnings are reinvested. The Moderately Sustainable verdict reflects strong earnings and OCF coverage offset by negative FCF from aggressive capex and thin cash reserves. The dividend is safe at current earnings levels but investors should watch the capex cycle closely. With payment due on October 28, 2026, eligible shareholders will receive their payout within 30 days of the AGM approval.
Frequently Asked Questions About Shree Pushkar Chemicals Dividend
What dividend has Shree Pushkar Chemicals announced for FY2025-26?
What is the dividend yield of Shree Pushkar Chemicals?
What is the record date for Shree Pushkar Chemicals dividend?
What is the ex-dividend date for Shree Pushkar Chemicals?
When will Shree Pushkar Chemicals pay the dividend?
Who is eligible for Shree Pushkar Chemicals dividend?
How is Shree Pushkar Chemicals dividend taxed?
Is Shree Pushkar Chemicals dividend sustainable?
What is Shree Pushkar Chemicals’ dividend history?
What should investors monitor about Shree Pushkar Chemicals?
What is Shree Pushkar Chemicals’ payout ratio?
How does Shree Pushkar Chemicals dividend compare to peers?
Disclaimer
This article is published by ShareBazaar Online for informational and educational purposes only. It does not constitute investment advice, a buy/sell/hold recommendation, or a solicitation to invest. All data is sourced from company filings (BSE), Screener.in and publicly available information. Computed figures (dividend yield, payout ratio, sustainability scores) are based on data available as of September 30, 2026 and may change. Keyword metrics sourced from Google Keyword Planner (September 2026). Past dividend performance does not guarantee future payments. Investors should consult a SEBI-registered financial advisor before making investment decisions. ShareBazaar Online and its authors do not hold positions in Shree Pushkar Chemicals & Fertilisers Limited (NSE: SHREEPUSHK, BSE: 539334, ISIN: INE712K01011). Market data is indicative and subject to change.