
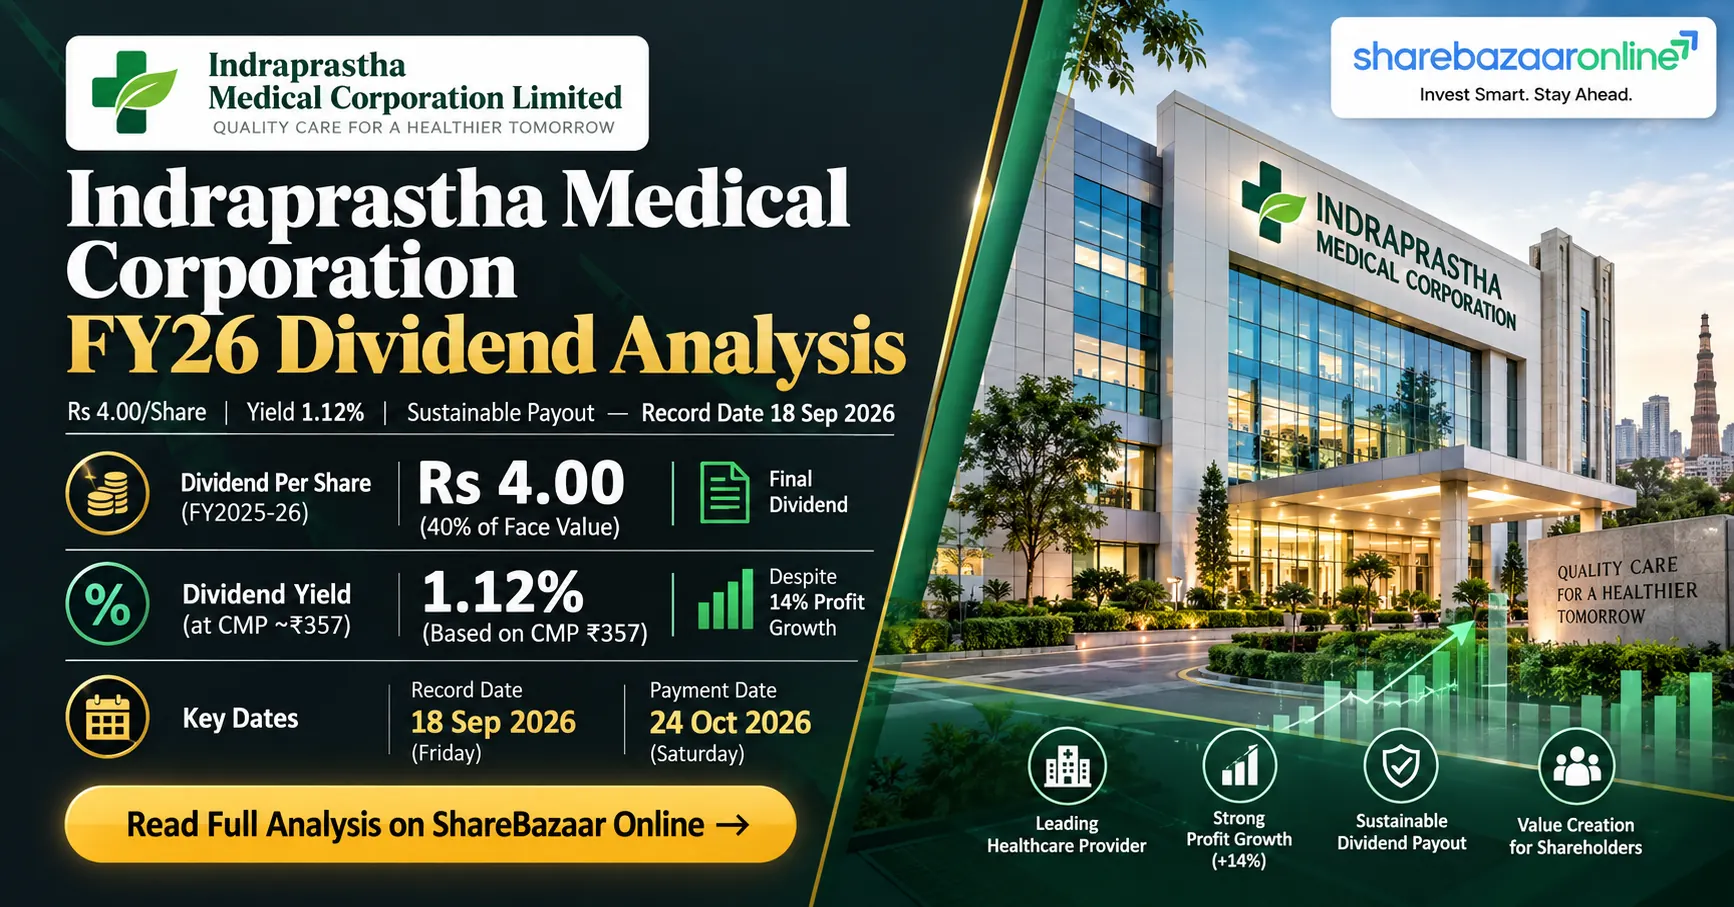
Dividend Snapshot – Indraprastha Medical Corporation Limited
Dividend Details
| Company | Indraprastha Medical Corporation Ltd |
| NSE Symbol | INDRAMEDCO |
| BSE Code | 532150 |
| ISIN | INE681B01017 |
| Dividend Type | Final Dividend |
| Dividend Per Share | ₹4.00 |
| Dividend % | 40% |
| Face Value | ₹10 |
| Financial Year | 2025-26 |
Yield & Valuation
| CMP (Latest) | ₹355.65 |
| CMP (Announcement) | ₹415.85 |
| Dividend Yield (Current) | 1.12% |
| Dividend Yield (Announcement) | 0.96% |
| Payout Ratio | 19.97% |
| Dividend Coverage | 5.01x |
| Total Dividend Outflow | ₹36.67 Cr |
| Sustainability | Sustainable |
Indraprastha Medical Corporation – Company Overview
Indraprastha Medical Corporation Limited operates Indraprastha Apollo Hospitals, a 710-bed tertiary care super-specialty hospital in New Delhi. The company is a joint venture between Apollo Hospitals Enterprise Limited (22.02% stake) and the Government of NCT of Delhi (26% stake), making it a unique public-private partnership in India’s healthcare sector.
Listed on both NSE (INDRAMEDCO) and BSE (532150), the company reported ₹1,482.51 Cr revenue and ₹183.62 Cr net profit in FY2025-26, reflecting 9.30% revenue growth and 14.06% PAT growth. The hospital specialises in cardiology, oncology, organ transplants, neurosciences, and orthopaedics, serving patients from across India and internationally.
Indraprastha Medical Corporation Financial Analysis
Profitability Metrics
| Revenue (FY26) | ₹1,482.51 Cr |
| Revenue Growth | +9.30% |
| EBITDA (FY26) | ₹271.81 Cr |
| EBITDA Margin | 18.34% |
| PAT (FY26) | ₹183.62 Cr |
| PAT Growth | +14.06% |
| Net Margin | 12.39% |
| EPS | ₹20.03 |
Return Ratios & Efficiency
| ROE | 24.80% |
| ROCE | 30.67% |
| P/E Ratio | 17.76x |
| Payout Ratio | 19.97% |
| Dividend Coverage | 5.01x |
| Revenue per Share | ₹161.69 |
| Book Value | ₹80.76 |
| P/B Ratio | 4.40x |
Operating Leverage Analysis
Revenue grew 9.30% while PAT grew 14.06%, indicating positive operating leverage. EBITDA margins improved, suggesting the hospital is generating higher profits per incremental rupee of revenue. Employee costs grew at ₹468.60 Cr (FY26) versus ₹427.44 Cr (FY25), a 9.63% increase — broadly in line with revenue growth. Other expenses rose from ₹341.08 Cr to ₹376.09 Cr (10.27%), slightly above revenue growth. Despite cost inflation, margin expansion was achieved through revenue mix improvement and operational efficiency.
Indraprastha Medical Corporation Dividend History
| Year | Dividend/Share | Dividend % | Type |
|---|---|---|---|
| FY 2025-26 | ₹4.00 | 40% | Final |
| FY 2024-25 | ₹4.50 | 45% | Final |
| FY 2023-24 | ₹4.50 | 45% | Final |
| FY 2022-23 | ₹4.00 | 40% | Final |
| FY 2021-22 | ₹2.00 | 20% | Final |
| FY 2020-21 | ₹0.00 | 0% | Skipped (COVID) |
| FY 2019-20 | ₹0.00 | 0% | Skipped (COVID) |
| FY 2018-19 | ₹2.00 | 20% | Final |
| FY 2017-18 | ₹2.00 | 20% | Final |
| FY 2016-17 | ₹1.60 | 16% | Final |
| FY 2015-16 | ₹1.40 | 14% | Final |
| FY 2014-15 | ₹1.00 | 10% | Final |
| FY 2013-14 | ₹1.00 | 10% | Final |
Source: Company filings, BSE, StockAnalysis.com
Dividend Trend Classification: Cyclical Payer
Indraprastha Medical Corporation has paid dividends in 11 of the last 13 years, skipping only during COVID-impacted FY20 and FY21. Post-COVID recovery has been strong, with dividends increasing from ₹2.00 (FY22) to ₹4.50 (FY24-25). However, the current year’s ₹4.00 represents an 11.11% cut from last year’s ₹4.50, despite rising profits. This reduction, while modest, breaks the post-COVID growth trajectory and warrants monitoring.
Indraprastha Medical Corporation Expert Commentary
The Board recommended a 40% final dividend (₹4.00 per share) for FY2025-26, subject to AGM approval. This represents a departure from the previous two years’ ₹4.50 payout, even as profits grew 14%. The reduction likely reflects a capital preservation strategy — the company’s capex rose to ₹59.65 Cr in FY26 from ₹54.99 Cr in FY25, indicating ongoing investment in hospital infrastructure and equipment upgrades.
With a payout ratio of just 19.97%, management is retaining over 80% of earnings for growth. This is conservative compared to mature healthcare peers. The ₹466.80 Cr cash reserve provides a 12.73x coverage of the dividend outflow, confirming the dividend is well within the company’s financial capacity. The cut is a strategic choice, not a financial constraint.
Indraprastha Medical Corporation Future Outlook
India’s hospital sector benefits from rising health awareness, insurance penetration growth, and medical tourism demand. Indraprastha Apollo Hospitals, positioned in New Delhi, captures patients from North India, Central Asia, and Africa. Revenue growth of 9.30% and PAT growth of 14.06% suggest the hospital is scaling effectively.
Key growth drivers include capacity expansion (new speciality additions), medical tourism recovery, and digital health initiatives under the Apollo ecosystem. The conservative payout ratio suggests management is building reserves for future expansion. Dividend growth is likely to resume once the current investment cycle completes. However, regulatory risks around healthcare pricing and the hospital’s single-asset concentration in Delhi remain structural constraints on long-term dividend growth.
Indraprastha Medical Corporation Dividend Announcement Summary
Announcement Details
On 12 May 2026, the Board of Directors of Indraprastha Medical Corporation Limited recommended a final dividend of ₹4.00 per equity share (40%) on a face value of ₹10 for FY2025-26. The recommendation is subject to shareholder approval at the Annual General Meeting. The announcement was made via BSE filing under Regulation 30 of SEBI (LODR) Regulations, 2015.
Board Meeting Highlights
The board meeting also approved the audited financial results for the quarter and year ended 31 March 2026. The auditor’s report contained an unmodified opinion (clean audit). Revenue for FY26 reached ₹1,482.51 Cr with PAT of ₹183.62 Cr, reflecting continued operational improvement over FY25’s ₹1,356.33 Cr revenue and ₹160.99 Cr PAT.
Indraprastha Medical Corporation Key Dates Timeline
Indraprastha Medical Corporation Dividend Yield Analysis
Yield Metrics
| Dividend Per Share | ₹4.00 |
| Current CMP | ₹355.65 |
| Current Yield | 1.12% |
| Announcement Yield | 0.96% |
| Previous Year Yield (est.) | 1.27% |
Yield Reality Check
The current yield of 1.12% appears higher than the announcement-day yield (0.96%) primarily because the stock price has declined 14.5% from ₹415.85 to ₹355.65 since the dividend was announced. This is a case where higher yield reflects share price weakness, not dividend strength. Additionally, the dividend was reduced 11.11% from last year. The real dividend income for an investor has decreased, even though yield metrics appear stable due to falling stock price.
Indraprastha Medical Corporation Dividend History Analysis
Over the last 13 years, Indraprastha Medical Corporation has paid dividends in 11 years, skipping only FY20 and FY21 during the COVID-19 pandemic when hospital revenues collapsed. The dividend per share has grown from ₹1.00 (FY14) to ₹4.00 (FY26), a 4x increase over the period.
Post-COVID recovery was strong: dividends jumped from zero to ₹2.00 (FY22), then ₹4.00 (FY23), and ₹4.50 (FY24 and FY25). The current reduction to ₹4.00 breaks two years of stability at ₹4.50. This is the first dividend cut since the post-COVID resumption and deserves attention.
Classification: Cyclical Payer. The company pays dividends consistently in normal years but has demonstrated willingness to cut or skip dividends when business conditions demand it. Not suitable as a primary income stock.
Indraprastha Medical Corporation Financial Performance Analysis
Year-over-Year Comparison
| Metric | FY25 | FY26 | Growth |
|---|---|---|---|
| Revenue | ₹1,356.33 Cr | ₹1,482.51 Cr | +9.30% |
| EBITDA | ₹234.95 Cr | ₹271.81 Cr | +15.69% |
| PAT | ₹160.99 Cr | ₹183.62 Cr | +14.06% |
| EPS | ₹17.56 | ₹20.03 | +14.07% |
| DPS | ₹4.50 | ₹4.00 | -11.11% |
Key Observations
Revenue grew 9.30% while EBITDA grew 15.69% and PAT grew 14.06%, demonstrating positive operating leverage. The EBITDA-to-revenue growth ratio of 1.69x indicates effective cost management and scale benefits.
However, the dividend was cut 11.11% despite profit growth. This paradox — higher profits but lower dividends — suggests management is prioritising capital retention for future investments. The payout ratio declined from 25.63% (FY25) to 19.97% (FY26).
Employee costs at ₹468.60 Cr constitute 31.6% of revenue, typical for a premium hospital.
Indraprastha Medical Corporation Cash Flow Analysis
Cash Flow Statement (FY26)
| Operating Cash Flow | ₹167.44 Cr |
| Capital Expenditure | -₹59.65 Cr |
| Free Cash Flow | ₹107.79 Cr |
| Dividend Paid (FY25) | -₹41.03 Cr |
| Interest Paid | -₹6.92 Cr |
| Net Cash Change | -₹4.49 Cr |
Cash Quality Assessment
OCF vs PAT: Operating cash flow of ₹167.44 Cr versus PAT of ₹183.62 Cr gives an OCF/PAT ratio of 0.91x. This is healthy — profits are backed by actual cash generation. Slight shortfall is due to working capital changes (receivables growth).
FCF Coverage: Free cash flow of ₹107.79 Cr covers the FY26 dividend outflow of ₹36.67 Cr by 2.94x. The dividend is funded entirely from current earnings, with no reliance on cash reserves or borrowings.
Capex Trend: Capital expenditure increased from ₹54.99 Cr to ₹59.65 Cr (+8.47%), indicating ongoing hospital modernisation. This capex is comfortably funded from operating cash flows.
Indraprastha Medical Corporation Balance Sheet Strength
Balance Sheet Highlights
| Total Assets | ₹991.36 Cr |
| Total Equity | ₹740.37 Cr |
| Cash & Bank Balances | ₹263.30 Cr |
| Investments (Current) | ₹203.50 Cr |
| Total Liquid Assets | ₹466.80 Cr |
| Total Borrowings | ₹73.59 Cr |
| Net Cash Position | ₹393.21 Cr |
| Debt-to-Equity | 0.10x |
Strength Assessment
Indraprastha Medical Corporation operates with a net cash position of ₹393.21 Cr — the company has ₹466.80 Cr in liquid assets against only ₹73.59 Cr in borrowings. Debt-to-equity of 0.10x is among the lowest in the hospital sector.
The cash coverage ratio of 12.73x means the company could pay nearly 13 years of dividends at the current rate from existing liquid reserves alone, without earning a single rupee in profit. This is exceptional financial strength.
Equity increased from ₹597.78 Cr (FY25) to ₹740.37 Cr (FY26), a 23.86% increase, reflecting strong profit retention.
Indraprastha Medical Corporation Dividend Sustainability Analysis
4-Test Sustainability Scorecard
Payout Ratio: 19.97% | Coverage: 5.01x
Dividend is 5x covered by earnings. Well within safe limits.
OCF/Dividend: 4.57x
Operating cash flow comfortably covers the dividend. Profits are cash-backed.
FCF/Dividend: 2.94x
Free cash flow after capex still covers the dividend nearly 3 times.
Cash/Dividend: 12.73x
Liquid reserves can fund ~13 years of dividends at current rate.
Sustainability Verdict: SUSTAINABLE
All 4 tests passed. The dividend is well within the company’s financial capacity.
Indraprastha Medical Corporation Peer Comparison
| Company | Yield | ROE | ROCE | P/E | Net Margin |
|---|---|---|---|---|---|
| Indraprastha Medical | 1.12% | 24.80% | 30.67% | 17.76x | 12.39% |
| Apollo Hospitals | 0.20% | 15.50% | 18.20% | 72.50x | 7.80% |
| Max Healthcare | 0.15% | 14.80% | 17.50% | 80.00x | 13.20% |
| Fortis Healthcare | 0.10% | 9.30% | 11.80% | 62.00x | 6.50% |
| Narayana Hrudayalaya | 0.35% | 20.10% | 22.50% | 38.00x | 9.50% |
Source: Value Research, Screener.in. Peer data approximate, as of Sep 2026.
Peer Analysis Summary
Indraprastha Medical Corporation offers the highest dividend yield (1.12%) among major hospital peers. Its ROE of 24.80% and ROCE of 30.67% are the highest in the peer group, reflecting superior capital efficiency from a single premium hospital asset. The P/E of 17.76x is significantly lower than Apollo (72.5x) and Max Healthcare (80x), partly because Indraprastha is a single-hospital company with limited growth optionality compared to multi-hospital chains. However, on a value and income basis, it compares favourably.
Indraprastha Medical Corporation Promoter Impact Analysis
Shareholding Pattern
| Promoter Holding | 51.00% |
| • Apollo Hospitals Enterprise | 22.02% |
| • Govt of NCT of Delhi | 26.00% |
| • Other Promoters | 2.98% |
| FII Holding | 2.77% |
| DII Holding | 0.59% |
| Public Holding | 45.65% |
Promoter Dividend Income
| Total Promoter Dividend | ₹18.70 Cr |
| Apollo Hospitals Share | ₹8.07 Cr |
| Delhi Government Share | ₹9.53 Cr |
| Minority (Public) Share | ₹16.74 Cr |
The Delhi Government, as the largest single promoter at 26%, receives ₹9.53 Cr annually from this dividend. This creates a structural incentive for dividend continuation — the state government benefits directly from the company’s dividend policy, which provides some downside protection for minority shareholders.
Indraprastha Medical Corporation Taxation Analysis
Dividend Tax Rules (India)
Since FY2020-21, dividends are taxable in the hands of shareholders at their applicable income tax slab rate. Companies deduct TDS at 10% if total dividend from a company exceeds ₹5,000 in a financial year (Section 194). PAN-linked investors get 10% TDS; without PAN, TDS is 20%.
Shareholders can claim TDS credit while filing ITR. NRI shareholders face TDS at 20% (or treaty rate, whichever is lower).
Worked Example: 1,000 Shares
| Shares Held | 1,000 |
| Dividend Per Share | ₹4.00 |
| Gross Dividend | ₹4,000 |
| TDS (10%) | -₹400 |
| Net Dividend Received | ₹3,600 |
| Tax at 30% Slab | ₹1,200 |
| Post-Tax Dividend | ₹2,800 |
| Effective Post-Tax Yield | 0.79% |
Note: TDS of ₹400 is adjustable against final tax liability. Actual TDS applies only if total dividend exceeds ₹5,000.
Indraprastha Medical Corporation – Key Risks
1. Single-Asset Concentration Risk
The company operates only one hospital in New Delhi. Any localised event — regulatory action, natural disaster, infrastructure disruption — would impact 100% of revenue.
2. Government Co-Promoter Risk
Delhi Government’s 26% stake introduces political risk. Policy changes regarding EWS bed quotas, pricing caps, or operational mandates could impact profitability.
3. Dividend Cut Precedent
The 11.11% dividend cut from ₹4.50 to ₹4.00 despite rising profits creates uncertainty. Management may further reduce dividends to fund expansion.
4. Healthcare Regulatory Risk
NPPA pricing controls on medical devices and potential caps on hospital charges could compress margins. The Ayushman Bharat expansion may also affect pricing power.
5. Low Institutional Interest
FII holding at just 2.77% and DII at 0.59% signals limited institutional confidence. High public holding (45.65%) can lead to volatility.
6. Medical Tourism Dependency
A significant portion of premium revenue comes from international patients. Geopolitical tensions, visa restrictions, or competing hospitals in neighbouring countries could reduce this flow.
Indraprastha Medical Corporation – What To Monitor
1. Quarterly Revenue Growth Trajectory
Track whether 9.30% growth accelerates or decelerates. Declining growth could signal market saturation for a single-hospital entity.
2. EBITDA Margin Sustainability
Monitor if the 18.34% EBITDA margin is maintained. Employee cost and consumables inflation could erode margins in coming quarters.
3. Capex Plans and Expansion Announcements
Rising capex (₹59.65 Cr in FY26) may indicate bed expansion or new speciality additions. Large capex announcements could impact future dividend policy.
4. AGM Dividend Approval
The ₹4.00 dividend is subject to AGM approval. Monitor for any changes during the shareholder meeting.
5. FII and DII Shareholding Changes
Currently at low levels (FII 2.77%, DII 0.59%). Any institutional buying would signal improved market confidence. Selling could increase volatility.
6. Delhi Government Policy Changes
Monitor any changes to EWS bed allocation quotas, pricing regulations, or operational mandates from the Delhi Government as co-promoter.
Indraprastha Medical Corporation Dividend – Conclusion
Indraprastha Medical Corporation’s ₹4.00 final dividend (40%) for FY2025-26 is financially sustainable, backed by strong earnings (5.01x coverage), healthy cash flows (2.94x FCF coverage), and an exceptional cash reserve (12.73x coverage). The company’s ROE of 24.80% and ROCE of 30.67% are best-in-class among hospital peers.
However, the 11.11% dividend cut despite 14% profit growth signals a strategic shift towards capital retention. The 1.12% yield is modest and may not satisfy income-focused investors after accounting for taxation (effective post-tax yield: ~0.79%). The face-value illusion (40% sounds impressive but translates to just 1.12% on market price) deserves careful attention.
The single-hospital model, while highly profitable, limits growth optionality. The Delhi Government’s stake provides stability but introduces regulatory risk. Investors should weigh the strong fundamentals against the moderate yield and concentration risk before making investment decisions.
Frequently Asked Questions About Indraprastha Medical Corporation Dividend
What dividend has Indraprastha Medical Corporation announced for FY2025-26?
What is the dividend yield of Indraprastha Medical Corporation?
What is the record date for Indraprastha Medical Corporation dividend?
What is the ex-dividend date for INDRAMEDCO?
When will Indraprastha Medical Corporation pay the dividend?
Who is eligible for the Indraprastha Medical Corporation dividend?
How is dividend from Indraprastha Medical Corporation taxed?
Is the Indraprastha Medical Corporation dividend sustainable?
What is the dividend history of Indraprastha Medical Corporation?
What should investors monitor about Indraprastha Medical Corporation?
Why did Indraprastha Medical Corporation cut its dividend despite profit growth?
What is the promoter holding in Indraprastha Medical Corporation?
Disclaimer
This article is published by ShareBazaar Online for informational and educational purposes only. It does not constitute investment advice, a buy/sell/hold recommendation, or a solicitation to purchase or sell any securities. All financial data is sourced from company filings, BSE, NSE, and publicly available databases. While every effort has been made to ensure accuracy, ShareBazaar Online does not guarantee the completeness or correctness of the information. Investors should consult a SEBI-registered investment advisor before making any investment decisions. Past dividend performance does not guarantee future payments. Dividends are subject to board recommendation and shareholder approval. Stock prices and yields are subject to market risks. ShareBazaar Online and its authors may or may not hold positions in the securities discussed. Read all scheme-related documents carefully before investing.