
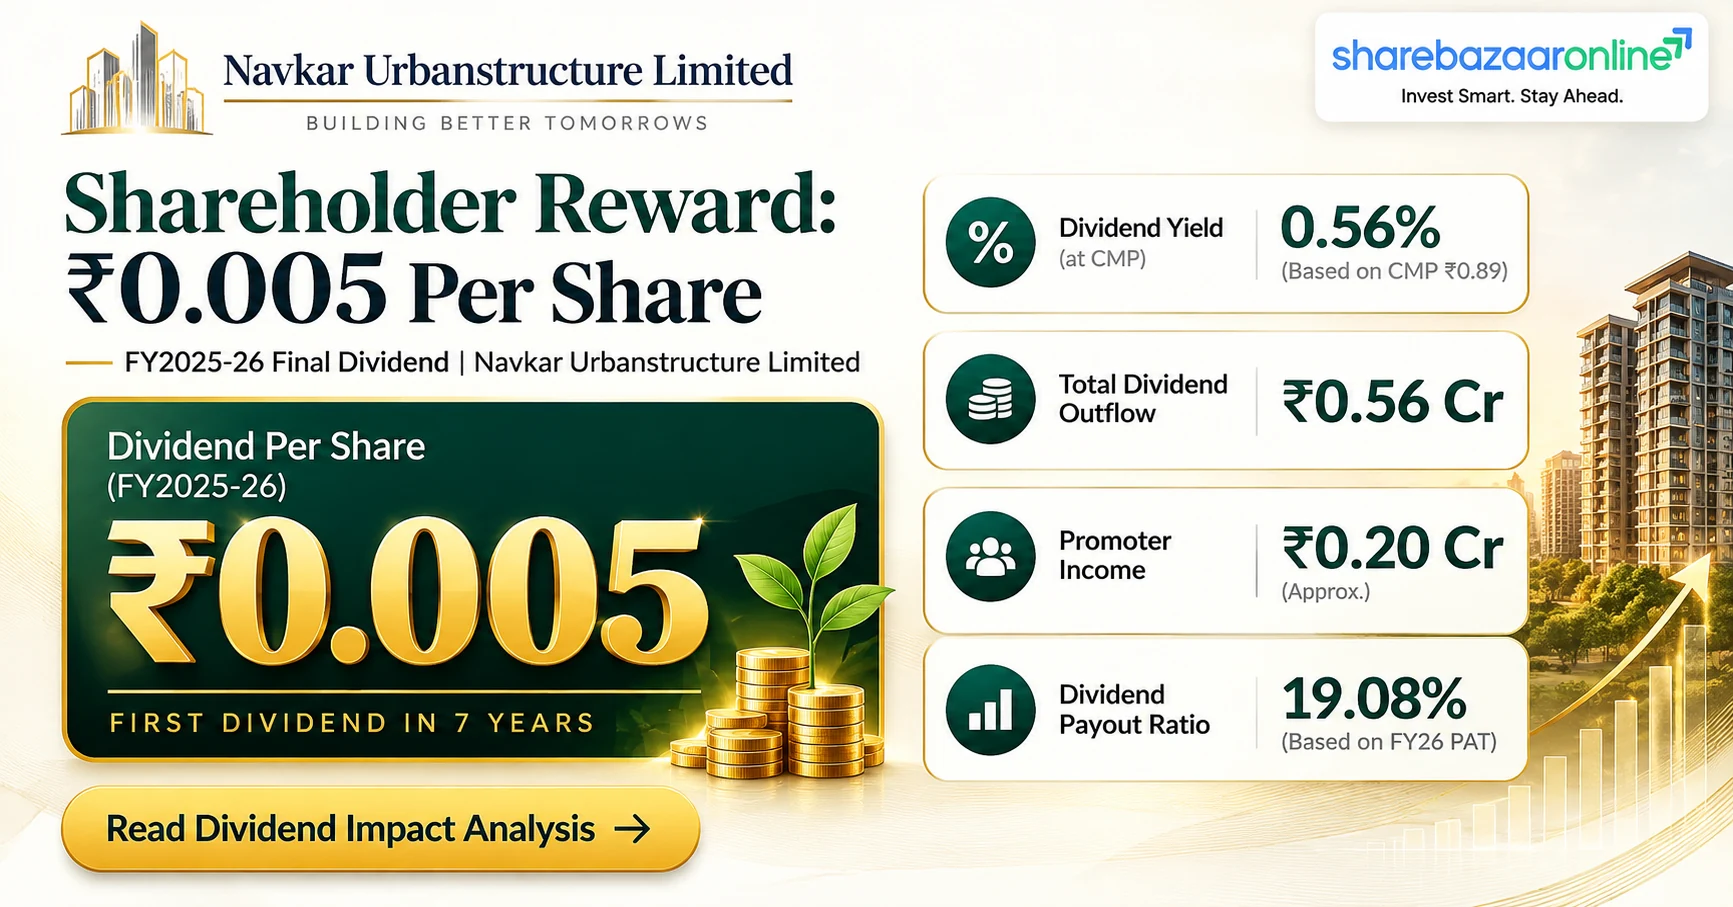
Dividend Snapshot – Navkar Urbanstructure Limited
Company Identifiers
Dividend Details
Market Data
Sustainability Verdict
Navkar Urbanstructure Limited – Company Overview
Navkar Urbanstructure Limited is an Ahmedabad-based infrastructure company incorporated in 1992. The company operates in construction, Ready Mix Concrete (RMC), and RCC pipe manufacturing segments. With a current market capitalisation of approximately ₹101 Crore, Navkar Urbanstructure is a micro-cap company listed on both NSE (NAVKARURB) and BSE (531494).
The company has approximately 10 employees and a promoter holding of 35%. Notably, the board recently approved a slump sale of its UNIT-1 for ₹1 lakh, signalling a strategic restructuring of operations. FY2025-26 saw a significant turnaround with revenue growing 45.45% and PAT surging 848%, driven by improved project execution and operational efficiency.
Navkar Urbanstructure Limited Financial Analysis
Profitability Metrics
Growth Trajectory
Navkar Urbanstructure's FY2025-26 performance marks a dramatic turnaround from the prior year. Revenue rose from ₹16.06 Cr to ₹23.36 Cr, while PAT surged from ₹0.31 Cr to ₹2.94 Cr. Despite the impressive growth, return ratios remain subdued — ROE at 1.84% reflects the company's large equity base of ₹160 Crore relative to modest earnings. The stock trades at 0.63x book value, suggesting deep value territory, though this also reflects the market's cautious assessment of earnings sustainability.
Navkar Urbanstructure Limited Dividend History
All historical figures restated per Ind AS 33 for stock split (₹10→₹2, Jun 2022) and bonus issue (3:2, Apr 2025, FV became ₹1). Adjustment factor: ÷2.5 post-split/pre-bonus; ÷12.5 pre-split.
| Financial Year | Dividend Type | Restated DPS (₹) | Original DPS (₹) | Face Value (₹) |
|---|---|---|---|---|
| FY2025-26 | Final | 0.005 | 0.005 | 1 |
| FY2024-25 | — | No Dividend Declared | ||
| FY2023-24 | — | No Dividend Declared | ||
| FY2022-23 | — | No Dividend Declared | ||
| FY2021-22 | — | No Dividend Declared | ||
| FY2020-21 | — | No Dividend Declared | ||
| FY2019-20 | — | No Dividend Declared | ||
| FY2018-19 | — | No Dividend Declared | ||
| FY2017-18 | Final | 0.08 | 1.00 | 10 |
| FY2016-17 | Final | 0.08 | 1.00 | 10 |
Dividend Classification
Irregular Payer — Navkar Urbanstructure has paid dividends in only 3 out of the last 10 financial years. The current FY2025-26 dividend is the company's first payout after a 7-year gap (last paid in FY2017-18). This inconsistency reflects the cyclical nature of the infrastructure business and the company's modest profitability during the intervening period.
Expert Commentary on Navkar Urbanstructure Limited Dividend
The Face-Value Illusion
At first glance, a 0.5% dividend on face value ₹1 appears insignificant. However, context matters. This is the company's first dividend in 7 years, signalling management's confidence in the FY26 earnings turnaround. The ₹0.005 per share dividend, while tiny in absolute terms, represents a payout ratio of only 19.08% — meaning the company is retaining over 80% of profits for reinvestment. For a micro-cap undergoing restructuring (including the slump sale of UNIT-1), this conservative payout is a prudent capital allocation decision rather than a generous shareholder reward.
What the Market Price Tells You
The stock trades at ₹0.90, which is below its book value of ₹1.43 (P/B 0.63x). The dividend yield at current CMP is 0.56% — marginally above the announcement-date yield of 0.50%. This is not a yield play. The real story is whether the FY26 turnaround (PAT up 848%) is the beginning of a structural improvement or a one-off event.
Navkar Urbanstructure Limited Future Outlook
Navkar Urbanstructure's FY2025-26 results suggest a possible turnaround, but sustainability remains uncertain. Revenue growth of 45.45% and PAT growth of 848% were achieved off a low base. The slump sale of UNIT-1 for ₹1 lakh signals asset rationalisation, which could either free up capital for core operations or indicate distress in non-core segments. With only 10 employees and promoter holding at 35%, the company operates with lean resources. Future dividends will depend on whether the infrastructure order pipeline sustains revenue momentum and whether operating margins continue to expand from FY25's depressed levels.
Navkar Urbanstructure Limited Dividend Announcement Summary
Navkar Urbanstructure Limited's Board of Directors, in its meeting held on 22 May 2026, recommended a final dividend of ₹0.005 per equity share (0.5% on face value ₹1) for the financial year 2025-26. This dividend is subject to approval by shareholders at the Annual General Meeting scheduled for 30 September 2026. The total dividend outflow is estimated at ₹0.56 Crore. This marks the company's first dividend declaration since FY2017-18, following seven consecutive years of no payouts.
Navkar Urbanstructure Limited Dividend Key Dates
*Ex-Date is inferred as Record Date minus 1 trading day under T+1 settlement. Not independently confirmed by exchange circular.
Navkar Urbanstructure Limited Dividend Yield Analysis
Yield at Current CMP
Yield at Announcement CMP
Yield Reality Check
The dividend yield of 0.56% is significantly below the 1-year bank FD rate (~7%) and the Nifty 50 average dividend yield (~1.2%). This is not a yield stock. The marginal increase in yield from 0.50% to 0.56% reflects a 10% decline in share price from ₹1.00 to ₹0.90 since announcement — the yield improvement comes from price erosion, not dividend generosity. Investors should not view this as an income investment.
Navkar Urbanstructure Limited Financial Performance Analysis
| Metric | FY2024-25 | FY2025-26 | Growth |
|---|---|---|---|
| Revenue | ₹16.06 Cr | ₹23.36 Cr | +45.45% |
| PAT | ₹0.31 Cr | ₹2.94 Cr | +848.39% |
| EPS | ₹0.0028 | ₹0.0262 | +835.71% |
| ROE | ~0.19% | 1.84% | Improved |
Operating Leverage
Revenue grew 45.45% while PAT surged 848%, demonstrating significant operating leverage — fixed costs were already absorbed, allowing incremental revenue to flow disproportionately to the bottom line. However, this leverage works both ways. A revenue decline in FY27 could compress profits sharply. The low absolute PAT of ₹2.94 Crore means even a modest cost overrun could eliminate profitability entirely.
Navkar Urbanstructure Limited Cash Flow Analysis
Cash Position
Cash Quality
The company holds ₹3.03 Crore in cash and equivalents against a dividend outflow of ₹0.56 Crore, providing a comfortable 5.40x cash coverage. However, cash forms only 1.38% of total assets (₹220 Cr), indicating that the business is asset-heavy with limited liquid reserves. Detailed operating cash flow and free cash flow breakdowns are not publicly disclosed. Investors should monitor whether FY26 profits were backed by actual cash collections or remain embedded in receivables — a common risk in infrastructure companies.
Navkar Urbanstructure Limited Balance Sheet Strength
Capital Structure
Asset Quality
Navkar Urbanstructure operates with a near-debt-free balance sheet — D/E ratio of 0.04 with only ₹5.74 Crore in total borrowings against ₹160 Crore equity. The company's total assets of ₹220 Crore are substantially larger than its market cap of ~₹101 Crore, resulting in a P/B of 0.63x. While this suggests deep value, investors should examine asset quality — infrastructure companies often carry land, WIP inventory, and receivables that may not be realisable at book value.
Navkar Urbanstructure Limited Dividend Sustainability Analysis
| Sustainability Test | Metric | Value | Result |
|---|---|---|---|
| Earnings Coverage | EPS ÷ DPS | 5.24x | ✓ Pass |
| Payout Ratio | Dividend ÷ PAT | 19.08% | ✓ Pass |
| Cash Coverage | Cash ÷ Outflow | 5.40x | ✓ Pass |
| Debt Check | D/E Ratio | 0.04 | ✓ Pass |
Verdict: Sustainable
All four sustainability tests pass. The dividend of ₹0.005 per share is comfortably covered by earnings (5.24x), backed by cash reserves (5.40x), and paid from a conservative payout ratio of 19.08%. The near-zero debt further supports sustainability. However, this verdict applies to the current micro-dividend — any meaningful increase in payout would require sustained earnings growth, which the company's 7-year dividend gap suggests cannot be taken for granted.
Navkar Urbanstructure Limited Peer Comparison
| Company | CMP (₹) | Div Yield | P/E | ROE | D/E |
|---|---|---|---|---|---|
| Navkar Urbanstructure | 0.90 | 0.56% | 34.35x | 1.84% | 0.04 |
| NCC Ltd | ~210 | ~0.9% | ~12x | ~14% | ~0.4 |
| Ashoka Buildcon | ~200 | ~0.8% | ~15x | ~10% | ~0.8 |
| KNR Constructions | ~280 | ~0.4% | ~20x | ~12% | ~0.2 |
Peer data approximate, sourced from public financial databases. Navkar Urbanstructure is a micro-cap and not directly comparable to mid/large-cap infrastructure peers.
Against listed infrastructure peers, Navkar Urbanstructure's dividend yield of 0.56% is in line with the sector's low-yield profile. However, its ROE of 1.84% is dramatically lower than peers like NCC (~14%) and Ashoka Buildcon (~10%). The P/E of 34.35x is elevated relative to peers, driven by the very low absolute earnings base. The near-zero D/E ratio is a positive distinguishing factor, though this may also reflect limited access to project financing rather than deliberate capital conservatism.
Navkar Urbanstructure Limited Promoter Impact Analysis
Shareholding Pattern
Promoter Dividend Income
With a 35% promoter holding, the promoter group receives approximately ₹0.20 Crore from the total outflow of ₹0.56 Crore. The absence of any FII or DII holding is notable — zero institutional ownership typically indicates limited market visibility, weak corporate governance perception, or insufficient float for institutional mandates. The 65% public holding consists entirely of retail investors, making the stock susceptible to speculative trading. Promoter holding at 35% is on the lower side for a micro-cap, warranting monitoring for any further dilution or stake changes.
Navkar Urbanstructure Limited Dividend Taxation Analysis
Indian Dividend Tax Rules (FY2025-26)
Dividends are taxable in the hands of shareholders at their applicable income tax slab rate. TDS at 10% is deducted on dividend income exceeding ₹5,000 per financial year (Section 194). Shareholders can claim credit for TDS while filing their ITR.
Worked Example: 1,000 Shares
| Component | Amount |
|---|---|
| Shares Held | 1,000 |
| Dividend Per Share | ₹0.005 |
| Gross Dividend | ₹5.00 |
| Tax @ 30% Slab | ₹1.50 |
| Net Dividend | ₹3.50 |
| Effective Yield (on ₹900 investment) | 0.39% |
TDS unlikely to apply as gross dividend (₹5.00) is well below the ₹5,000 threshold. Tax computed at highest slab for illustration.
Navkar Urbanstructure Limited Key Risks
Risk Factors
1. Earnings Sustainability Risk: FY26 PAT growth of 848% was off a very low base (₹0.31 Cr). A single delayed project or cost overrun could erase profitability and future dividend capacity.
2. Micro-Cap Liquidity Risk: With a market cap of ~₹101 Crore and zero institutional ownership, the stock faces severe liquidity constraints. Large position exits could cause disproportionate price impact.
3. Asset Monetisation Risk: The approved slump sale of UNIT-1 for ₹1 lakh raises questions about asset quality and whether other assets are similarly impaired relative to book value.
4. Concentration Risk: With only ~10 employees, the company's operations are highly concentrated. Loss of key personnel or a single project failure could materially impact financials.
5. Governance & Transparency Risk: Limited institutional coverage, no analyst reports, and minimal public disclosures beyond regulatory filings make independent verification difficult.
6. Promoter Holding Risk: Promoter stake at 35% is relatively low for a micro-cap, providing limited downside support and raising questions about long-term commitment.
7. Sector Cyclicality: Infrastructure and construction businesses are inherently cyclical, dependent on government spending, real estate demand, and commodity prices.
What To Monitor – Navkar Urbanstructure Limited
1. Q1 FY27 Revenue Trajectory: Whether the 45% revenue growth sustains or decelerates will determine if FY26 was a structural inflection or a one-off.
2. Operating Cash Flow: Watch for the first detailed OCF disclosure — positive OCF confirming PAT quality is critical for micro-caps.
3. Slump Sale Completion: Track the UNIT-1 disposal — asset write-downs and any one-time impact on FY27 financials.
4. Receivables Ageing: Infrastructure companies often show receivable build-up. Monitor trade receivables relative to revenue for collection delays.
5. Promoter Stake Changes: Any increase would signal confidence; a decrease at these levels would be a significant red flag.
6. Order Book Disclosure: A visible pipeline of projects would provide forward revenue visibility currently absent from public disclosures.
7. Capital Expenditure Plans: Whether management reinvests retained earnings (80%+ of PAT) into capacity expansion or new segments.
Conclusion – Navkar Urbanstructure Limited Dividend FY2025-26
Navkar Urbanstructure Limited's ₹0.005 per share final dividend for FY2025-26 is a symbolic gesture rather than a meaningful income event. The 0.56% yield provides negligible income, and the micro-cap's 7-year dividend gap classifies it as an irregular payer. On the positive side, the dividend is well-covered (5.24x earnings, 5.40x cash), paid from a conservative 19.08% payout ratio, and the company is nearly debt-free (D/E 0.04). The FY26 earnings turnaround (PAT +848%) is encouraging, and the stock trades at a significant discount to book value (P/B 0.63x). However, weak return ratios (ROE 1.84%), zero institutional ownership, minimal transparency, and the slump sale of UNIT-1 warrant caution. This is a turnaround monitoring story, not a dividend income play.