
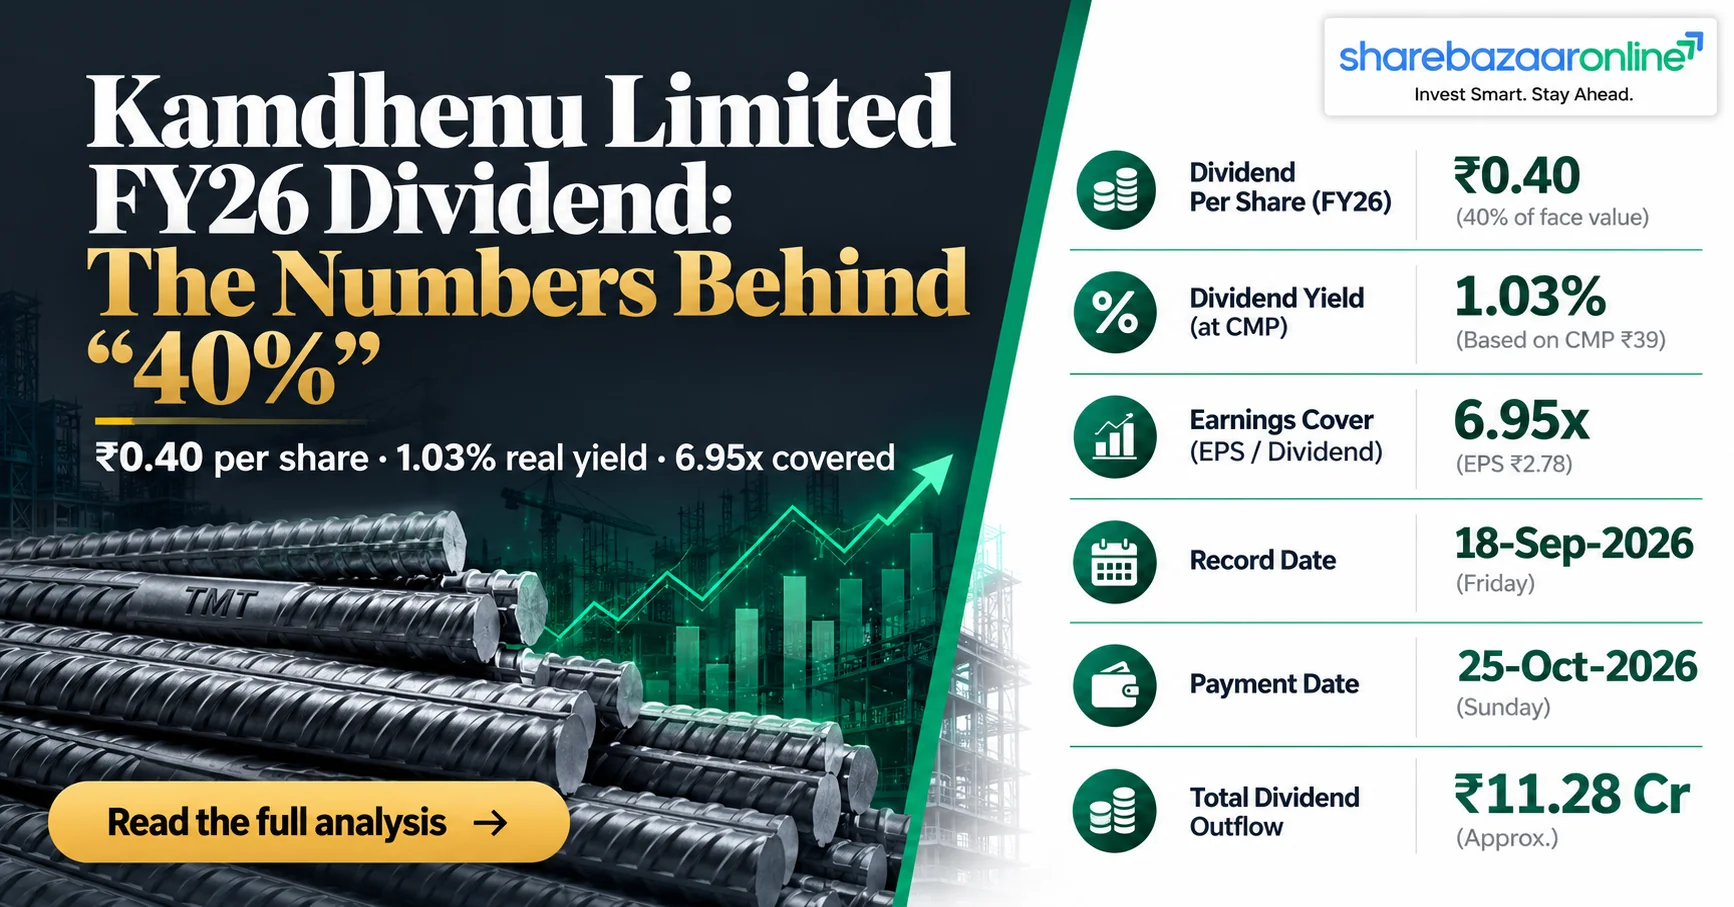
Dividend Snapshot – Kamdhenu Limited FY26 Final Dividend
Kamdhenu Limited (NSE: KAMDHENU, BSE: 532741, ISIN: INE390H01020) paid a final dividend of ₹0.40 per share for FY2025-26. That is 40% of the ₹1 face value, but at the latest price of ₹39.00 the real yield is only 1.03%. The headline number is about 39 times the yield an investor actually receives.
- Dividend per share: ₹0.40 (Final)
- Dividend %: 40% on ₹1 face value
- Market yield: 1.03% (CMP ₹39.00, 28 Sep 2026)
- Growth vs FY25: +60% (₹0.25 to ₹0.40)
- Total outflow: ₹11.28 crore
- Payout ratio: 14.39% of FY26 PAT
- Record date: 18 September 2026
- AGM approval: 25 September 2026
Kamdhenu Limited Company Overview
Business Model
Kamdhenu Limited was incorporated in 1994 as Kamdhenu Ispat and renamed in 2016. It sells TMT bars, structural steel and colour-coated sheets under the Kamdhenu brand. Most of this steel is made by franchise units that pay Kamdhenu a royalty on every tonne. That makes the company asset-light: it earns brand income without owning most of the factories.
FY26 Scale
Royalty income rose 25% to ₹174.5 crore, or 22.9% of revenue (up from 18.6%). Franchise volumes grew 10% to 37.9 lakh MT, and brand sales turnover was about ₹23,000 crore (per company results commentary). The company reports a single business segment, steel.
Kamdhenu Limited Financial Analysis at a Glance
| Metric (₹ crore) | FY26 | FY25 | Change |
|---|---|---|---|
| Revenue from operations | 763.39 | 747.49 | +2.13% |
| EBITDA | 100.82 | 75.42 | +33.69% |
| Profit before tax | 105.52 | 80.40 | +31.25% |
| Net profit (PAT) | 78.35 | 60.87 | +28.73% |
| Basic EPS (₹) | 2.78 | 2.21 | +25.79% |
Profit grew about 13 times faster than sales. Kamdhenu Limited prepares only standalone accounts: its one subsidiary is a not-for-profit CSR foundation, so there are no consolidated statements. Tax expense was 25.75% of PBT, and diluted EPS was ₹2.72 because of warrant conversions. At ₹39.00, the stock trades at 14.0 times FY26 EPS and 2.77 times book value. Source: audited results filed 27 May 2026.
Kamdhenu Limited Dividend History Table (Split-Adjusted)
| Year | DPS (₹1 FV basis) | Original DPS | Record Date | Payout |
|---|---|---|---|---|
| FY26 | 0.40 | 0.40 | 18-09-2026 | 14% |
| FY25 | 0.25 | 0.25 | 18-09-2025 | 11% |
| FY24 | 0.20 | 2.00 (₹10 FV) | 31-07-2024 | 11% |
| FY23 | 0.15 | 1.50 | 16-08-2023 | 10% |
| FY22 | 0.10 | 1.00 | 26-07-2022 | 10% |
| FY21 | 0.08 | 0.80 | 10-09-2021 | 14% |
| FY20 | 0.05 | 0.50 | 21-09-2020 | 71% |
| FY19 | 0.10 | 1.00 | 27-09-2019 | 12% |
| FY18 | 0.10 | 1.00 | 15-09-2018 | 15% |
| FY17 | 0.08 | 0.80 | 22-09-2017 | 23% |
| FY16 | 0.07 | 0.70 | Sep 2016 | 20% |
Figures before FY25 are divided by 10 to reflect the 10:1 stock split (record date 8 January 2025). Record dates are from TipRanks, payout ratios from Screener.in, and FY17 is cross-checked against the ₹0.80 per ₹10 share reported in May 2017.
Expert Commentary on Kamdhenu Limited Dividend
What Stands Out
A 60% dividend increase looks generous. But Kamdhenu Limited still paid out only 14.39% of profit, while cash and investments reached ₹304.29 crore. That is about 27.7% of its ₹1,099 crore market value. The cash is available, but management has chosen to invest it rather than distribute it.
The Caution Flag
PAT rose 28.73% in FY26, but operating cash flow fell 4.21%. Cash converted from profit dropped from 113% to 84%. Earnings quality is still reasonable, but it moved in the wrong direction during a record profit year.
Kamdhenu Limited Future Outlook
Management Direction
On the FY26 earnings call, management said it aims for roughly 10% volume growth a year and 10–15% annual increases in royalty per tonne. The CFO said there is no plan to invest further in the group paint business, and that surplus cash will go to the steel business and shareholder rewards (per earnings-call coverage).
Early FY27 Signal
Q1 FY27 revenue rose 9% to ₹213.3 crore, and PAT rose 34% to ₹28.7 crore. However, about ₹17 crore of that quarter's roughly ₹36 crore PBT came from other income. Operating margin was about 10%, well below Q4 FY26's roughly 17%.
Kamdhenu Limited Dividend Announcement Summary
At its meeting on 27 May 2026, the Board of Kamdhenu Limited recommended a final dividend of 40%, or ₹0.40 per equity share of ₹1 face value, for the year ended 31 March 2026. The same meeting approved the audited FY26 results; auditors S S Kothari Mehta & Co. LLP gave an unmodified opinion.
Shareholders approved the dividend at the 32nd AGM on 25 September 2026, held by video conference. The filing says payment will be made within 30 days of the AGM.
Outflow: ₹0.40 × 28.19 crore shares = ₹11.28 crore. This is a single final dividend; no interim dividend was declared for FY26.
Kamdhenu Limited Dividend Record Date, Ex-Date and Key Timeline
| Event | Date |
|---|---|
| Board recommendation | 27 May 2026 |
| TDS document deadline | 10 September 2026 |
| Ex-dividend date | 18 September 2026 |
| Record date | 18 September 2026 |
| Remote e-voting | 22–24 September 2026 |
| AGM (dividend approved) | 25 September 2026 |
| Payment deadline | On or before 25 October 2026 |
Under T+1 settlement, the ex-date and record date fall on the same day. Investors who held shares at the close of 17 September 2026 were eligible. The company has not disclosed an exact credit date; last year's dividend was paid on 25 October 2025.
Kamdhenu Limited Dividend Yield: The 40% Illusion
Face Value vs Market Price
"40%" is calculated on the ₹1 face value, a price nobody pays today. At the current price of ₹39.00, ₹0.40 ÷ ₹39.00 = 1.03%. Using the 11 September price of ₹39.09, the yield was 1.02%. The announcement-date closing price could not be independently verified.
Yield Reality Check
The yield rose from about 0.64% to 1.03% even though the stock gained roughly 48% over the past year. The higher yield comes from a larger dividend, not a falling share price. That is the healthier of the two ways a yield can rise.
Kamdhenu Limited Dividend History Analysis
Consistent Payer
Kamdhenu Limited has paid a dividend for 11 straight years. On a split-adjusted basis, DPS grew from ₹0.07 to ₹0.40, a 19.04% CAGR over ten years. From FY21 to FY26 the CAGR was 37.97%, and the dividend has risen every year since FY20.
One Cut on Record
In FY20, DPS was halved to ₹0.05 after EPS fell to ₹0.07, which pushed the payout ratio to 71%. Apart from that year, the payout ratio has stayed between 10% and 23%. The dividend has grown with earnings, not ahead of them.
Classification: Consistent Payer with a low, steady payout ratio. There have been no special dividends and no suspensions.
Kamdhenu Limited Financial Performance: Operating Leverage
Why Profit Outran Sales
Revenue rose just 2.13%, but EBITDA jumped 33.69% and the EBITDA margin widened from 10.09% to 13.21%. Raw-material cost fell 4.19% and other expenses fell 3.11%. Meanwhile royalty income, which carries almost no cost, grew 25%.
Q4 Told a Different Story
Q4 FY26 PAT grew only 1.99% to ₹17.43 crore. The quarter absorbed an ₹11.38 crore fair-value loss on investments, which pushed other income to negative ₹8.24 crore. Employee costs rose 9.71% for the year, much faster than sales.
Kamdhenu Limited Cash Flow Analysis
Profit Up, Cash Down
Operating cash flow was ₹65.97 crore against PAT of ₹78.35 crore, a conversion of 84% versus 113% in FY25. Trade receivables rose 17.73% while revenue rose only 2.13%, and trade payables were cut by and the company paid suppliers ₹8.48 crore more quickly than before.#8377;8.48 crore, which also drained cash.
What Funds the Dividend
Free cash flow (OCF minus ₹11.51 crore of capex) was ₹54.46 crore, which covers the dividend 4.83 times. The dividend is paid from current earnings, not borrowings or asset sales. The FY26 ‘dividend paid’ of ₹7.04 crore matches ₹0.25 × 28.19 crore shares.
Kamdhenu Limited Balance Sheet Strength
Debt-Free, Cash-Rich
As of 31 March 2026, Kamdhenu Limited had no bank borrowings, only ₹9.42 crore of lease liabilities. Cash plus current investments were ₹258.12 crore, or ₹304.29 crore including non-current investments. Net worth rose to ₹396.37 crore. Our calculated ROE is 21.99% and ROCE is 29.39%.
Capital Allocation
In FY26 the company spent ₹53.33 crore buying equity shares, including about ₹20 crore in the group paint company, which reported a 97% profit fall. There was no debt to repay. A 30% payout ratio would have meant about ₹0.83 per share, still well within free cash flow. Management chose to retain the cash.
Kamdhenu Limited Dividend Sustainability Scorecard
| Test | Coverage | Result |
|---|---|---|
| Earnings (EPS ÷ DPS) | 6.95x | Pass |
| Operating cash flow | 5.85x | Pass |
| Free cash flow | 4.83x | Pass |
| Cash & current investments | 22.9x | Pass |
Verdict: Sustainable. The company has no debt, and earnings are growing. The only weak point is the drop in cash conversion to 84%. If profit fell by 85%, earnings would still cover the dividend. Free cash flow of ₹54.46 crore leaves about ₹43 crore after the dividend, so the payout also does not reduce the cash reserve. It is funded from the current year's cash.
Kamdhenu Limited vs Steel Peers: Dividend Comparison
| Company | Yield | Payout | ROE | ROCE | Borrowings (₹ cr) |
|---|---|---|---|---|---|
| Kamdhenu Limited | 1.03% | 14% | 22.0% | 29.4% | Nil (net cash) |
| Godawari Power & Ispat | 0.44% | 8% | 15.3% | 20.5% | 443 |
| Shyam Metalics | 0.42% | 12% | 9.7% | 13.0% | 1,005 |
| APL Apollo Tubes | 0.38% | 20% | 25.4% | 31.8% | 498 |
Kamdhenu Limited has the highest yield in this group, more than twice each peer's, and it is the only one with no debt. APL Apollo returns a larger share of profit. Peer data is from Screener.in (consolidated, prices as of 28 September 2026).
Kamdhenu Limited Promoter Dividend Impact
Who Receives What
Promoters held 49.03% in June 2026, so they receive about ₹5.53 crore of the ₹11.28 crore payout. Minority shareholders receive ₹5.75 crore. FIIs hold just 2.06% and DIIs 0.03%, so nearly all the non-promoter share goes to about 48,824 retail and other holders.
Ownership Trend
Promoter holding fell from 58.74% to 49.03% over three years, mostly in September 2024. Warrant conversions also raised the share count from 27.74 crore to 28.19 crore. Minority holders now receive slightly more of the total payout than promoters.
Kamdhenu Limited Dividend Taxation Explained
Dividends are taxed at the investor's income-tax slab rate. Under the Income-tax Act, 2025, Section 393(1) requires 10% TDS for resident shareholders when dividends exceed ₹10,000 in a year, or 20% if no PAN is given. Form 121 replaces Forms 15G/15H.
Worked Example (Standard)
1,000 shares × ₹10 = ₹10,000 gross. Tax at 30% plus 4% cess (31.2%) = ₹3,120. Net income = ₹6,880. After tax, you keep 68.8% of any gross yield.
Kamdhenu Limited Case
1,000 shares × ₹0.40 = ₹400, which is below the TDS threshold. Tax at 31.2% = ₹124.80, leaving a net of ₹275.20. The post-tax yield is 0.71%.
Key Risks for Kamdhenu Limited Shareholders
- Treasury volatility: A ₹11.38 crore fair-value loss in Q4 shows how market swings in a ₹304 crore portfolio can move reported profit.
- Weaker cash conversion: Receivables grew 17.73% while sales grew 2.13%; debtor days rose from 21.8 to 25.1.
- Group investments: About ₹20 crore went into the group paint company, which reported a 97% profit decline in FY26.
- Franchise dependence: Royalty growth relies on franchisees' volumes and their willingness to accept higher per-tonne rates.
- Falling promoter stake: Promoter holding dropped 9.71 percentage points in three years.
- Low institutional ownership: Combined FII and DII holding is only 2.09%, which limits trading liquidity.
What to Monitor at Kamdhenu Limited
- Royalty per tonne: Does it rise by the targeted 10–15% a year, alongside roughly 10% volume growth?
- Cash conversion: Does OCF return above 100% of PAT from the FY26 level of 84%?
- Other income share: What portion of Q2 FY27 PBT comes from the investment portfolio rather than operations?
- Treasury use: Does cash go to steel, a buyback, a higher payout or more group investments?
- Payout ratio: Does it rise above the 10–15% band as cash keeps building?
- Q2 FY27 results: Due after the trading-window closure that begins 1 October 2026.
Kamdhenu Limited Dividend 2026: Conclusion
Positives
The dividend grew 60% and is covered 6.95 times by earnings and 4.83 times by free cash flow. The company has no debt and ₹304 crore in treasury. Its yield is more than double each steel peer's, and it has paid a dividend for 11 straight years.
Negatives
The real yield is 1.03%, not "40%". Operating cash flow fell while profit rose, receivables are growing faster than sales, profit is exposed to swings in the investment portfolio, and the payout ratio is only 14% despite the large cash pile.
The Kamdhenu Limited FY26 dividend is well covered, but it is small relative to the company's cash. The main thing to watch is how that cash gets used.
Frequently Asked Questions About Kamdhenu Limited Dividend
What dividend has Kamdhenu Limited announced for FY26?
What is the Kamdhenu dividend yield?
What was the Kamdhenu dividend record date?
What was the Kamdhenu ex-dividend date?
When will the Kamdhenu dividend be paid?
Who was eligible for the Kamdhenu Limited dividend?
How is the Kamdhenu dividend taxed?
Is the Kamdhenu Limited dividend sustainable?
What is the Kamdhenu dividend history?
What should Kamdhenu investors monitor?
Why did Kamdhenu profit grow faster than revenue?
Did the stock split affect the Kamdhenu dividend history?
How much dividend do Kamdhenu promoters receive?
Disclaimer – Kamdhenu Limited Dividend Analysis
This article is for educational and informational purposes only and is not investment advice. ShareBazaar Online is not a SEBI-registered investment adviser or research analyst. Nothing here is a recommendation to buy, sell or hold shares of Kamdhenu Limited or any other security. Financial figures come from the company's audited results filed on 27 May 2026. Market prices, peer data and shareholding figures come from public sources as of 28 September 2026 and may change. Ratios are ShareBazaar Online calculations. Tax information is general; consult a qualified tax professional. Please do your own research before making any investment decision.