
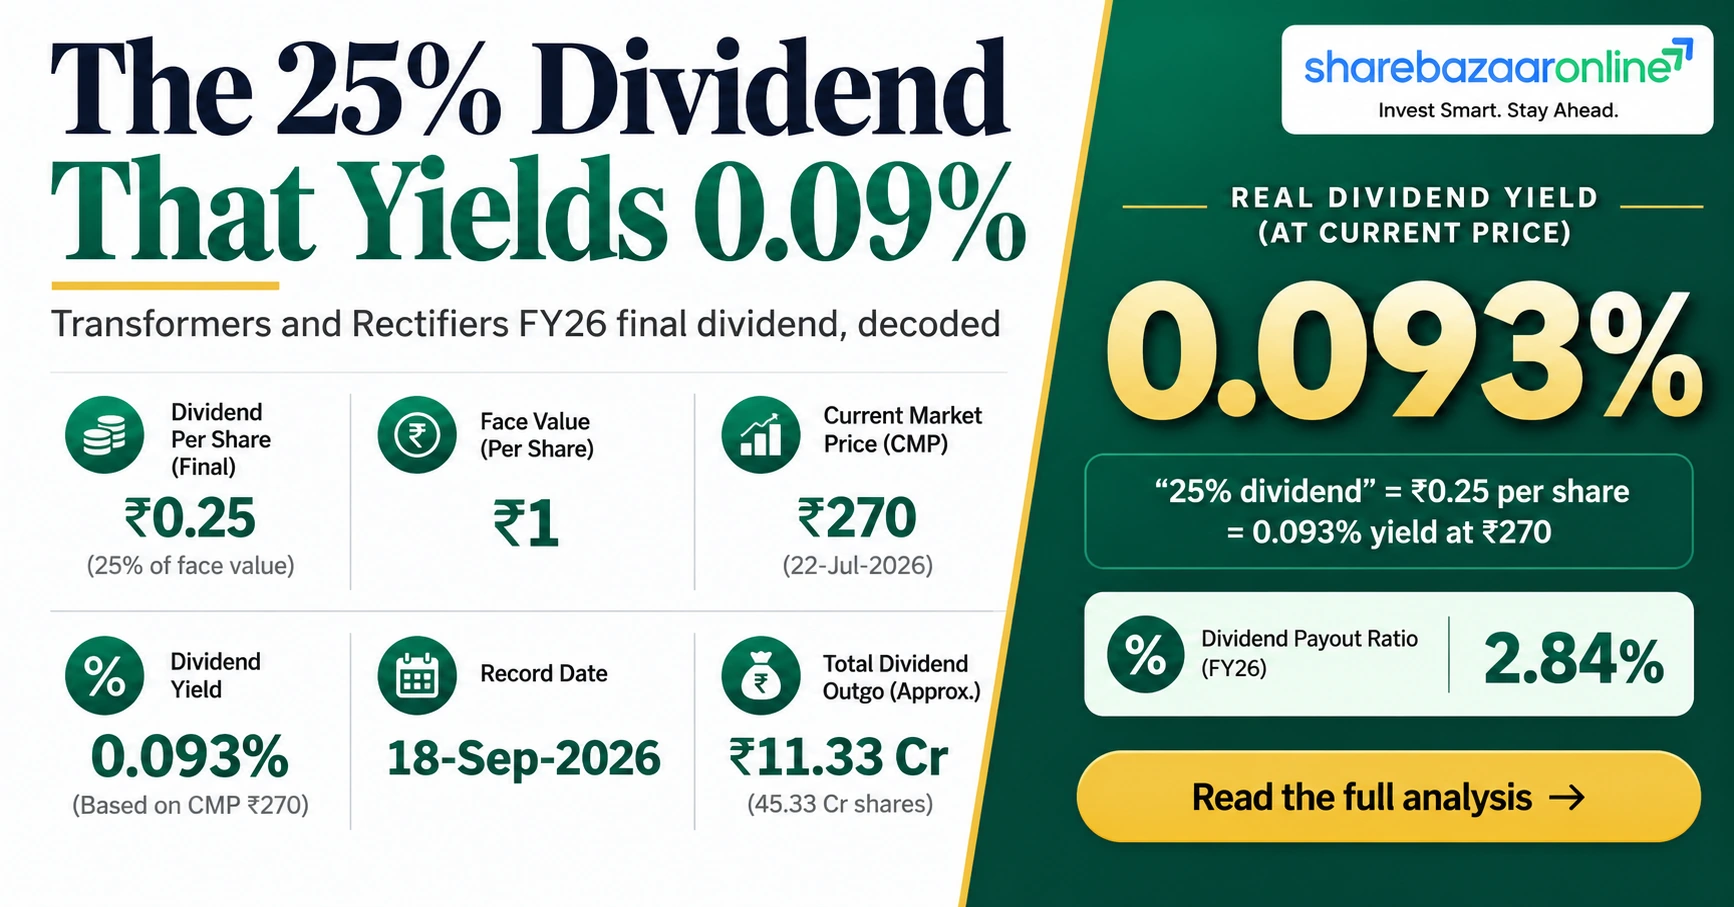
Dividend Snapshot – Transformers and Rectifiers (India) Limited
Transformers and Rectifiers (India) Limited (NSE: TARIL, BSE: 532928, ISIN: INE763I01026) declared a final dividend of ₹0.25 per share for FY2025-26. The headline says 25%. At the 28-Sep-2026 close of ₹270, the actual yield is 0.093%. The 25% figure is measured against the ₹1 face value, not the price you pay. That gap is 270 times.
| Dividend per share | ₹0.25 |
| Dividend type | Final (FY26) |
| Face value | ₹1 |
| Dividend % of face value | 25% |
| Market yield (CMP ₹270) | 0.093% |
| Total outflow | ₹7.50 crore |
| Payout ratio (consolidated) | 2.84% |
| Record date | 18-09-2026 |
Transformers and Rectifiers (India) Limited Company Overview
Transformers and Rectifiers (India) Limited is an Ahmedabad-based maker of power, furnace, rectifier and specialty transformers, plus shunt and series reactors, rated up to 1,200 kV. It sells B2B to power generation, transmission, distribution and industrial customers. The group runs one reportable segment: manufacturing of transformers.
Output rose to 33,000 MVA in FY26 from 29,118 MVA in FY25 (Source: Screener.in company notes). The company is promoted by the Mamtora family, who hold 64.36%. At ₹270 the market value is about ₹8,104 crore. The stock is down roughly 44% over one year and trades well below its 52-week high of ₹552 (Source: Screener.in, INDmoney, Sep 2026).
Transformers and Rectifiers (India) Limited Financial Analysis at a Glance
| Consolidated (₹ crore) | FY26 | FY25 | Change |
|---|---|---|---|
| Revenue from operations | 2,508.80 | 2,019.39 | +24.2% |
| EBITDA (ex other income) | 383.18 | 327.46 | +17.0% |
| Other income | 60.85 | 31.70 | +92.0% |
| PAT (owners) | 264.39 | 214.27 | +23.4% |
| Operating cash flow | (105.38) | 156.58 | Swing −261.96 |
| Borrowings | 456.61 | 282.77 | +61.5% |
Profit grew. Cash did not. Transformers and Rectifiers (India) Limited reported ₹264 crore of owners' profit while its operations consumed ₹105 crore of cash. Consolidated EPS was ₹9.07 against ₹7.21 a year earlier, and standalone profit was ₹225.43 crore. Source: company audited results, 21-Apr-2026.
Transformers and Rectifiers (India) Limited Dividend History Table (Bonus and Split Adjusted)
| Financial year | Ex-date | Declared (₹) | Adjusted (₹, current shares) |
|---|---|---|---|
| FY2025-26 | 18-09-2026* | 0.25 | 0.25 |
| FY2024-25 | 09-05-2025 | 0.20 | 0.20 |
| FY2023-24 | 10-05-2024 | 0.20 | 0.10 |
| FY2022-23 | 28-07-2023 | 0.15 | 0.075 |
| FY2021-22 | 28-07-2022 | 0.15 | 0.075 |
| FY2020-21 | 02-09-2021 | 0.10 | 0.05 |
| FY2014-15 to FY2019-20 | — | Nil | Nil |
| FY2013-14 | 04-09-2014 | 0.75 (FV ₹10) | 0.0375 |
Adjusted for the 1:1 bonus (ex 14-Feb-2025) and the ₹10-to-₹1 split (ex 28-Sep-2017), in line with Ind AS 33. Declared amounts: Trendlyne and 5paisa dividend history. *Ex-date inferred from the 18-09-2026 record date under T+1 settlement; confirm against the NSE/BSE corporate-action list.
Expert Commentary on the Transformers and Rectifiers (India) Limited Dividend
The ShareBazaar Online research desk reads this dividend as a signal, not an income source. At ₹7.50 crore, it is 2.84% of owners' profit. The company is retaining 97% of earnings for a capacity and working-capital build.
What matters more is the funding picture. FY26 free cash flow was −₹214.82 crore. Borrowings rose by ₹173.84 crore. In a year like that, every rupee paid out, however small, is effectively financed by the balance sheet rather than by operating cash. The dividend is affordable. The cash cycle behind it is the real story for shareholders to watch.
Transformers and Rectifiers (India) Limited Future Outlook
Management is targeting about 25% revenue growth in FY27 (Source: Simply Wall St summary of company guidance). Q1 FY27 revenue was ₹572 crore, but profit fell to ₹64.29 crore from about ₹67 crore a year earlier (Source: Screener.in, INDmoney).
FY26 revenue of ₹2,395 crore (standalone) fell short of the ₹2,600 crore target, and working capital reached 207 days against a 120-day goal (Source: Sharekhan results note, 22-Apr-2026). The dividend trend has risen each year since FY21. Whether it keeps rising likely depends less on profit and more on how quickly receivables turn into cash.
Transformers and Rectifiers (India) Limited Dividend Announcement Summary
On 21 April 2026, the board of Transformers and Rectifiers (India) Limited recommended a final dividend at 25%, or ₹0.25 per equity share of ₹1. The same meeting approved audited FY26 results with an unmodified audit opinion from Manubhai & Shah LLP.
Shareholders approved the dividend at the 32nd AGM on 21 September 2026; all four resolutions passed (Source: BSE scrutinizer's report). On 30.02 crore shares, the total payout works out to ₹7.50 crore. Payment date: Not Disclosed by Company in filings we could access.
Transformers and Rectifiers (India) Limited Dividend Record Date and Key Dates
| Board recommendation | 21-04-2026 |
| E-voting cut-off | 14-09-2026 |
| Record date | 18-09-2026 |
| Ex-date (inferred, T+1) | 18-09-2026 |
| Book closure | 19-09-2026 to 21-09-2026 |
| AGM (dividend approved) | 21-09-2026 |
| Payment deadline (Companies Act, 30 days) | On or before 21-10-2026 |
Record date, book closure and cut-off: company AGM notice to BSE dated 29-Aug-2026. The record date has passed. Shareholders who held the stock at the close of 17-09-2026 trading, and were on the register on 18-09-2026, were eligible. Anyone who bought on or after the ex-date is not entitled to this payout. Last year the company paid about a month after its AGM.
Transformers and Rectifiers (India) Limited Dividend Yield Analysis
Current yield: ₹0.25 ÷ ₹270 = 0.093%.
Near announcement: ₹0.25 ÷ ₹324 (24-Apr-2026 close, Sharekhan) = 0.077%. The exact 21-Apr close was not independently verified.
Yield rose only because the price fell about 17% after the announcement, not because the dividend is large. A ₹1 lakh holding at ₹270 earns roughly ₹93 before tax.
For comparison, Voltamp Transformers yields about 0.94% and GE Vernova T&D India about 0.24% (Source: Screener.in/StockEdge, Sep 2026). TARIL's yield is the lowest of the three.
Transformers and Rectifiers (India) Limited Dividend Growth Over the Years
Several aggregators list FY24 and FY25 both at ₹0.20, which reads as a flat dividend. That is wrong on a per-share basis. After adjusting for the February 2025 1:1 bonus, the FY24 payout equals ₹0.10, so the FY25 dividend doubled, and FY26 added another 25%.
On adjusted figures, the dividend grew from ₹0.05 (FY21) to ₹0.25 (FY26), a 38% compound annual rate. The longer record is weaker: no dividend for six years (FY15–FY20), when the company posted losses or thin profits. Classification: Irregular Payer, with six consecutive rising payouts since resuming.
Transformers and Rectifiers (India) Limited Dividend vs Profit Growth
Revenue rose 24.2%, but EBITDA grew only 17.0%. Margin slipped from 16.2% to 15.3%. Raw materials were not the cause: they fell from 68.6% to 67.6% of revenue. Employee costs jumped 76% (including ₹10.31 crore of ESOP expense) and other expenses 31%.
PAT still grew 25.8%, helped by other income nearly doubling to ₹60.85 crore, or 16.8% of pre-tax profit. The consolidated cash flow statement shows a ₹24.66 crore non-cash “excess provision written back”, equal to about 41% of other income. Excluding other income, pre-tax profit grew 20.9%.
Transformers and Rectifiers (India) Limited Cash Flow Analysis
Profit ₹272 crore. Operating cash flow −₹105 crore. Before working capital, operations generated ₹409.63 crore. Then ₹280.32 crore went into receivables, ₹174.79 crore into inventory, and payables were cut by ₹109.48 crore.
Total receivables rose 35.9% against 24.2% revenue growth, stretching from about 146 to 159 days of sales.
With ₹109.44 crore of capex, free cash flow was −₹214.82 crore. The dividend is therefore funded by borrowings and cash reserves, not current cash earnings. Standalone operating cash flow was also negative at −₹58.57 crore, so the pressure sits in the parent company, not only in subsidiaries.
Transformers and Rectifiers (India) Limited Balance Sheet Strength
| ₹ crore | 31-Mar-2026 | 31-Mar-2025 |
|---|---|---|
| Cash + bank + current investments | 292.31 | 409.25 |
| Total borrowings | 456.61 | 282.77 |
| Net debt / (net cash) | 164.30 | (126.48) |
| Debt-to-equity | 0.30x | 0.22x |
In one year, Transformers and Rectifiers (India) Limited moved from ₹126 crore net cash to ₹164 crore net debt, a ₹291 crore swing. Leverage remains modest at 0.30x equity, and ROE is about 19.1%. Most new debt is short-term working-capital borrowing (₹389.73 crore current). Liquid funds also fell by ₹117 crore as mutual fund holdings were redeemed to support operations.
Transformers and Rectifiers (India) Limited Dividend Sustainability
| Test | Result | Verdict |
|---|---|---|
| Earnings cover (EPS ₹9.07 ÷ DPS) | 36.3x | Pass |
| OCF cover | −14.0x | Fail |
| FCF cover | −28.6x | Fail |
| Liquidity cover (₹292 cr ÷ ₹7.50 cr) | 39.0x | Pass |
Verdict: Conditionally Sustainable. The payout is too small to strain the balance sheet: it equals only 4.3% of the year's increase in borrowings. Raising it meaningfully, however, would require operating cash flow to turn positive again. Two of four tests pass on accounting profit and liquidity; the two cash tests fail. A cash-flow recovery in FY27 would move the verdict to Sustainable.
Transformers and Rectifiers (India) Limited Peer Comparison
| Company | Yield | Payout | ROE | ROCE | Debt |
|---|---|---|---|---|---|
| Transformers and Rectifiers (India) | 0.09% | 2.8% | 19.1% | 23.3% | Net debt |
| Voltamp Transformers | 0.94% | ~31% | 17.4% | 23.5% | Almost debt-free |
| GE Vernova T&D India | 0.24% | Not verified | 18.6% | Not verified | Not verified |
Peer data: Screener.in and StockEdge, Aug–Sep 2026. Returns are similar across the group; the difference is capital allocation. Voltamp distributes about a third of profit while holding almost no debt. TARIL keeps 97% of profit and still borrowed to fund growth. Hitachi Energy India was excluded because its current figures could not be verified.
Transformers and Rectifiers (India) Limited Promoter Dividend Impact
Promoter share (64.36%): about ₹4.83 crore.
Public and institutions (35.64%): about ₹2.67 crore.
Holding as of June 2026 (Source: Screener.in shareholding). Promoter stake fell from 74.91% in 2023 through the FY25 QIP and sales.
The amounts are too small for the payout to be a meaningful cash route for promoters. With over 2.15 lakh shareholders, the typical retail holder receives a token sum. Retaining cash benefits all holders equally, provided it earns more than the cost of the new borrowings.
Transformers and Rectifiers (India) Limited Dividend Taxation
Dividends are taxed at your slab rate. From 1-Apr-2026, TDS falls under Section 393(1), Table serial 7 of the Income-tax Act, 2025 (formerly Section 194): 10% for residents with PAN when a company's dividends to you exceed ₹10,000 in a year, and 20% without PAN. Non-residents: 20% plus surcharge and cess, or the treaty rate.
Illustration: 1,000 shares, ₹10 per share, 30% slab (+4% cess). Gross ₹10,000; tax ₹3,120; net ₹6,880. No TDS, because ₹10,000 does not exceed the threshold. At ₹270, gross yield is 3.70% and net 2.55%.
Actual TARIL case: 1,000 shares receive ₹250. Tax is ₹78, leaving ₹172, a post-tax yield of 0.064%.
Key Risks for Transformers and Rectifiers (India) Limited Shareholders
- Working capital: about 207 days against a 120-day target; receivables growing faster than revenue.
- Rising debt: borrowings up 61.5% to ₹456.61 crore; finance cost already ₹51 crore a year.
- Earnings quality: other income (+92%) and a ₹24.66 crore provision write-back supported FY26 profit.
- Margin pressure: EBITDA margin down 94 bps; Q1 FY27 profit fell year on year.
- Execution: FY26 revenue and margin guidance were missed.
- Share price volatility: the stock fell about 44% in a year, which makes any yield figure unstable.
- Customer concentration: B2B utility and government-linked orders can delay payments.
What to Monitor at Transformers and Rectifiers (India) Limited
- Operating cash flow in the H1 FY27 results: does it turn positive?
- Receivable days: progress toward the 120-day working-capital target.
- Net debt: whether it falls from ₹164 crore or keeps rising.
- EBITDA margin against the 16–17% guidance band.
- Order inflow and backlog quality after selective bidding.
- Other income mix: how much is recurring rather than write-backs.
- Next dividend decision at the Q4 FY27 board meeting, likely in April 2027.
- ESOP dilution: 26.33 lakh options granted, mostly at ₹372.
Transformers and Rectifiers (India) Limited Dividend: Conclusion
Positives: adjusted dividend up fivefold since FY21; 36x earnings cover; 19% ROE; revenue up 24%; modest 0.30x leverage.
Negatives: 0.093% real yield; negative operating and free cash flow; ₹291 crore net-cash-to-net-debt swing; margin compression.
The Transformers and Rectifiers (India) Limited dividend of ₹0.25 is best read as a token of consistency from a growth company, not as income. The “25% dividend” headline describes face value; the real return at today's price is under one-tenth of a percent. The FY27 cash flow statement, more than the next dividend, will show whether FY26's profit growth turns into cash.
Frequently Asked Questions About the Transformers and Rectifiers (India) Limited Dividend
What dividend has Transformers and Rectifiers (India) Limited announced for FY26?
What is the TARIL dividend yield?
What was the record date for the TARIL dividend 2026?
What was the ex-dividend date?
When will the Transformers and Rectifiers dividend be paid?
Who was eligible for the dividend?
How is the TARIL dividend taxed?
Is the Transformers and Rectifiers dividend sustainable?
What is the TARIL dividend history?
Did the dividend really stay flat at ₹0.20 in FY24 and FY25?
Why is operating cash flow negative when profit rose?
How much dividend do the promoters receive?
What should investors monitor next?
Disclaimer – Transformers and Rectifiers (India) Limited Dividend Analysis
This article is for information and education only. ShareBazaar Online is not registered with SEBI as an investment adviser or research analyst, and nothing here is a recommendation to buy, sell or hold any security. Figures come from the company's audited results dated 21-Apr-2026, its exchange filings, and cited third-party sources; market prices change daily. Ex-date and payment timing are inferred where stated. Please verify details with official NSE/BSE filings and consult a registered adviser before making investment decisions.