
Ceinsys Tech Limited Company Overview
Ceinsys Tech Limited, which now trades under the brand CS TECH Ai, is a Nagpur-based Meghe Group company founded in 1998. It works on the digital side of infrastructure: GIS mapping, LiDAR, water-network design for programmes such as the Jal Jeevan Mission, vehicle and manufacturing engineering, and software resale. For FY26, the board recommended a Ceinsys Tech dividend of ₹3.50 per share on 14 May 2026. It was placed before shareholders at the 28th AGM on 26 September 2026.
Listing Identifiers
- NSE Symbol: CEINSYS (listed 19 February 2026)
- BSE Code: 538734
- ISIN: INE016Q01014
- Face Value: ₹10 per share
- Shares Outstanding: 2,09,37,661
FY26 Segment Revenue (Consolidated)
- Geospatial & Engineering Services: ₹358.87 crore
- Technology Solutions: ₹300.91 crore
- Others (power generation): ₹0.92 crore
- Order book (31 March 2026): ₹876 crore
Ceinsys Tech Limited Financial Analysis at a Glance
| Consolidated (₹ crore) | FY25 | FY26 | Change |
|---|---|---|---|
| Revenue from Operations | 418.06 | 660.70 | +58.0% |
| EBITDA (excl. other income) | 77.99 | 146.03 | +87.2% |
| Net Profit | 63.24 | 133.42 | +111.0% |
| Basic EPS (₹) | 37.37 | 74.76 | +100.1% |
| Operating Cash Flow | 5.68 | 3.49 | −38.6% |
| Net Worth | 411.88 | 673.06 | +63.4% |
The profit line doubled. The cash line did not. Ceinsys Tech converted only 2.6% of its FY26 net profit into operating cash, and that gap runs through the rest of this analysis. Source: audited consolidated results filed on 14 May 2026.
Ceinsys Tech Limited Dividend History Table (FY15–FY26)
| Financial Year | Type | DPS (₹) | % of FV | Approx. Payout |
|---|---|---|---|---|
| FY26 | Final | 3.50 | 35.0% | 5.5% |
| FY25 | Final | 3.50 | 35.0% | 9.7% |
| FY24 | Final | 2.50 | 25.0% | 11.7% |
| FY23 | Final | 2.00 | 20.0% | 10.0% |
| FY22 | Final | 2.25 | 22.5% | 37.8% |
| FY21 | Final | 2.25 | 22.5% | 125.7% |
| FY20 | Final | 2.50 | 25.0% | 12.6% |
| FY19 | Final | 2.25 | 22.5% | 72.8% |
| FY18 | Final | 1.25 | 12.5% | 30.6% |
| FY17 | Final | 1.25 | 12.5% | 22.7% |
| FY16 | Final | 1.00 | 10.0% | 22.1% |
| FY15 | Final | 0.75 | 7.5% | 11.0% |
Red marks a cut from the prior year. Ceinsys Tech has not done a bonus issue or stock split in this period, and face value has stayed at ₹10, so no per-share restatement is needed. Payout is DPS divided by annual EPS. Sources: Trendlyne dividend record, Screener.in EPS series, company filings.
Ceinsys Tech Limited Dividend: Expert Commentary
What Management Says
In the FY26 annual report, the chairman says the company has “strengthened every significant metric on our balance sheet” and delivered positive operating cash flow. Both statements are accurate. Net cash nearly doubled, and OCF was positive at ₹3.49 crore.
ShareBazaar Desk View
The cash build came mainly from ₹130.43 crore of preferential warrant money, not from operations. OCF was just 2.6% of net profit, and unbilled receivables grew 138%. The dividend is easy to pay today. Whether it can grow depends on turning milestone billings into cash.
Ceinsys Tech Limited Future Outlook
Management calls FY27 a “year of acceleration”. Early numbers are mixed. Q1 FY27 revenue was ₹157.8 crore, up only 0.8% year on year. EBITDA margin improved to 24.4%, while consolidated net profit came in at ₹31.0 crore, 16.6% lower than Q4 FY26.
Growth Levers
- ₹25 crore joint venture with AI Fabrik Inc. for sovereign AI cloud
- ₹235.05 crore of unused preferential money set aside for acquisitions
- ₹67.04 crore PMAY-Urban letter of intent (July 2026)
Headwinds
- Reported ₹112.4 crore cut to the pending order book after SWSM cancelled IoT schemes
- CFO resignation effective 15 October 2026
Sources: Q1 FY27 results (11 Aug 2026), exchange disclosures as reported by Groww and ScanX.
Dividend Snapshot – Ceinsys Tech Limited
- Dividend Type: Final Dividend, FY 2025-26
- Dividend Per Share: ₹3.50
- Headline Rate: 35% of ₹10 face value
- Yield at CMP (₹686): 0.51%
- Total Outflow: ₹7.33 crore
- Payout Ratio (Consolidated): 5.5%
- Record Date: 19 September 2026
- Ex-Date: 18 September 2026 (inferred)
CMP is ₹686 as of 28 September 2026 at 9:59 am (Screener.in). The outflow of ₹732.82 lakh matches the FY26 Board’s Report exactly: 2,09,37,661 shares multiplied by ₹3.50. The payout ratio is the lowest in the company’s 12-year dividend record, even though absolute profit is at a record high.
Ceinsys Tech Limited Dividend Announcement Summary
The board met on Thursday, 14 May 2026, from 1:30 PM to 4:00 PM. It approved the audited FY26 results and recommended a final dividend of ₹3.50 per share (35%), subject to shareholder approval at the AGM. There was no interim dividend in FY26.
Other Items Cleared at the Same Meeting
- Change in how the preferential-issue money will be used, subject to a shareholder vote
- Appointment of PricewaterhouseCoopers Services LLP as internal auditor for FY27
- Resignation of Anand Paranjape, Head of Mobility, effective 5 June 2026
- Postal ballot on pay revisions for the Chairman, two Managing Directors and a related party
Ceinsys Tech Limited Dividend Record Date and Key Dates Timeline
| Event | Date |
|---|---|
| Board recommendation | 14 May 2026 |
| AGM notice circulated | 4 September 2026 |
| Ex-dividend date (inferred) | 18 September 2026 (Friday) |
| Record date and tax-form deadline | 19 September 2026 (Saturday) |
| Book closure | 20–26 September 2026 |
| Remote e-voting | 23–25 September 2026 |
| 28th AGM | 26 September 2026 |
| Payment date | Not Disclosed by Company |
The record date fell on a Saturday. Under India’s T+1 settlement, that puts the ex-date on the previous trading day, 18 September. Ventura Securities lists the same date, but readers should confirm it against the NSE/BSE corporate-action circular. Section 127 of the Companies Act requires a declared dividend to be paid within 30 days of declaration, which means by 26 October 2026.
Ceinsys Tech Limited Dividend Yield: The 35% Illusion
Headline (on face value)
35%
₹3.50 ÷ ₹10 face value
Real yield (on market price)
0.51%
₹3.50 ÷ ₹686 CMP
The “35% dividend” headline overstates what an investor actually earns by about 68.6 times. On announcement day, the yield was even lower, at 0.35%, against a derived closing price of about ₹1,002.56 on 14 May 2026. The yield rose from 0.35% to 0.51% for one reason: the share price fell roughly 56% over the past year (Screener.in). The dividend did not change. This is a yield created by a falling price, not by higher payouts.
Ceinsys Tech Limited Dividend History Analysis
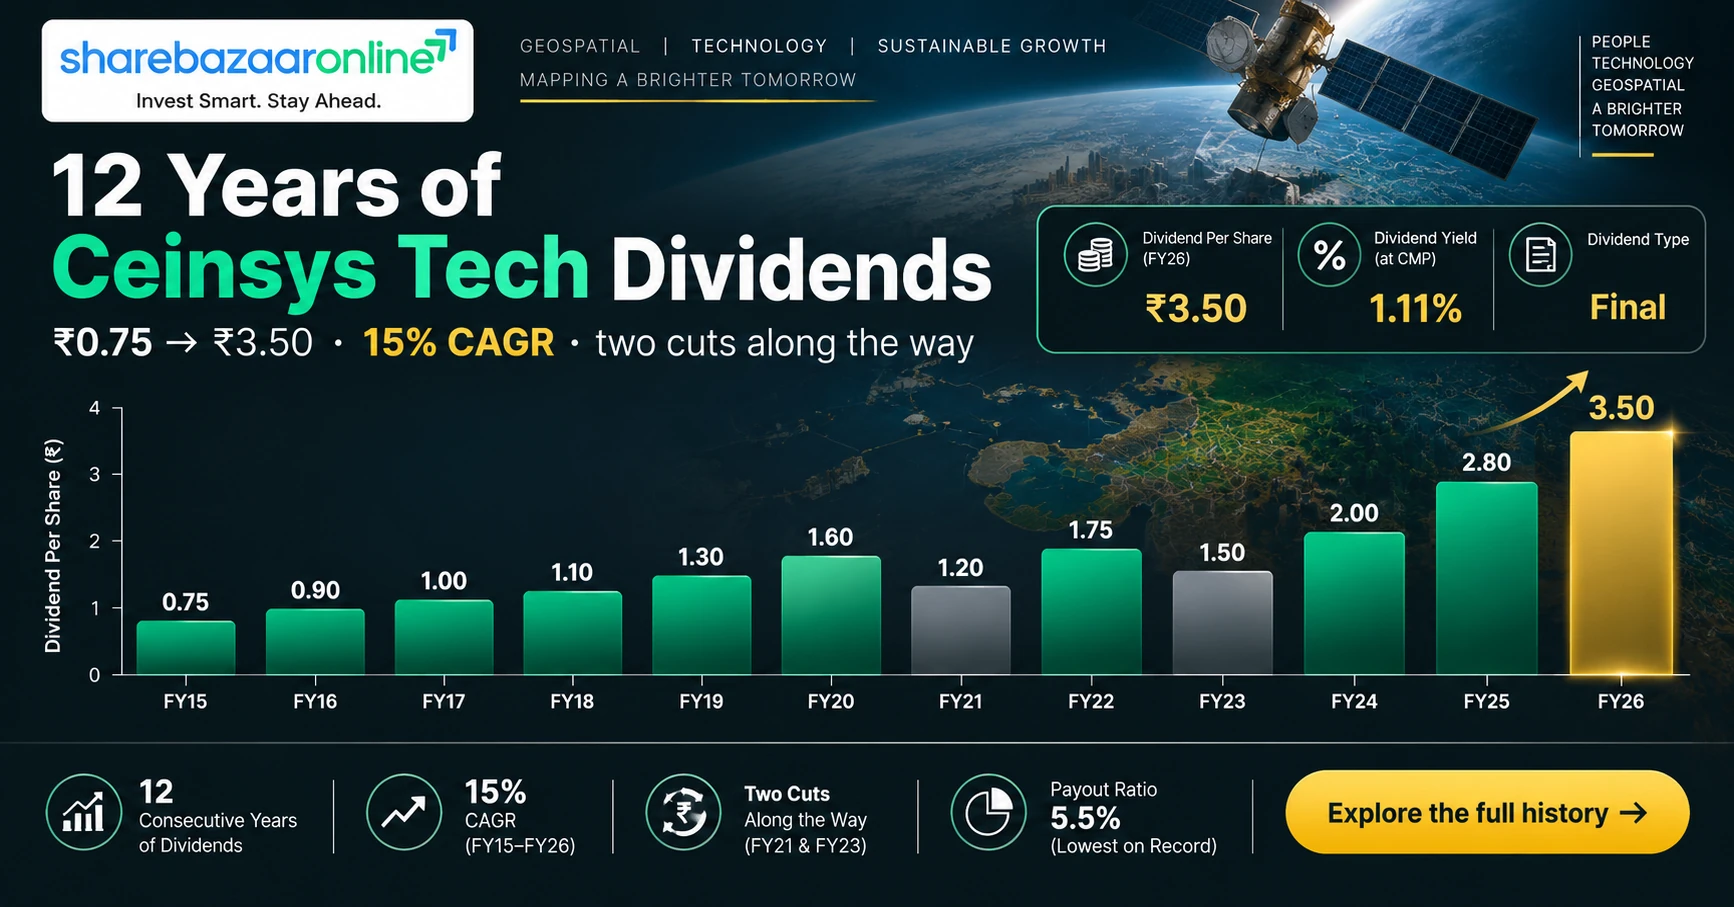
Ceinsys Tech has paid a final dividend every year for 12 years, rising from ₹0.75 in FY15 to ₹3.50 in FY26, a 15.0% compound annual growth rate. The path has not been smooth. The dividend was cut in FY21 (₹2.50 to ₹2.25) and again in FY23 (₹2.25 to ₹2.00). The FY26 payout was held at ₹3.50 even though EPS roughly doubled.
Classification
Consistent Payer, with low and irregular growth
Pattern
Payout has fallen from 37.8% in FY22 to 5.5% in FY26. Retained profit is going into growth and working capital, not into distributions.
Ceinsys Tech Limited Dividend vs Profit Growth: Financial Performance
Operating Leverage
- Revenue: +58.0%
- EBITDA: +87.2% (margin 18.7% to 22.1%)
- Profit before tax: +74.3%
- Net profit: +111.0%
The Tax Gap
Net profit grew faster than PBT because the effective tax rate fell from 29.4% to 14.5%. The drop came from a ₹36.43 crore ESOP perquisite deduction (Note 6) and a ₹7.76 crore write-back of earlier-year tax. At the FY25 tax rate, net profit would have been about ₹110.2 crore, up 74.3%.
On the cost side, project and operating expenses rose 106.8% while employee cost rose only 8.4%. That points to a shift toward pass-through project work, where margins depend more on execution than on headcount.
Ceinsys Tech Limited Cash Flow Analysis
Key finding: Net profit was ₹133.42 crore, but operating cash flow was only ₹3.49 crore. The main reason is that the cash-flow statement shows ₹198.11 crore absorbed by unbilled receivables (work completed but not yet invoiced). The unbilled balance climbed 138% to ₹318.60 crore, while revenue grew 58%.
- Capex: ₹13.56 crore
- Free cash flow: −₹10.07 crore
- Payables up 108% to ₹155.53 crore, which helped support OCF
- Standalone OCF: ₹19.43 crore
Where the Dividend Money Comes From
From cash reserves, largely built from ₹130.43 crore of warrant-conversion money. It does not come from current free cash flow, asset sales or borrowings. As a check, the FY26 cash flow line “dividends paid” of ₹6.24 crore matches the FY25 dividend of ₹3.50 on about 1.78 crore shares.
Ceinsys Tech Limited Balance Sheet Strength
Liquidity
- Cash and bank balances: ₹291.60 crore
- Borrowings: ₹46.60 crore
- Net cash: ₹245.00 crore
- Debt-to-equity: 0.07
The Caveat
₹235.05 crore of the cash is unused preferential-issue money, earmarked for acquisitions and expansion. Excluding it, free cash is about ₹56.55 crore, which still covers the dividend 7.7 times.
Total trade receivables are ₹469.27 crore, equal to 71% of annual revenue and 70% of net worth. CARE upgraded the company’s bank facilities to BBB+/Stable in September 2026. The balance sheet can easily absorb the dividend. Its weak point is how quickly receivables turn into cash.
Ceinsys Tech Limited Dividend Sustainability Scorecard
| Test | Result | Verdict |
|---|---|---|
| Earnings coverage (EPS ÷ DPS) | 21.4x | Pass |
| OCF coverage | 0.48x | Fail |
| FCF coverage | Negative | Fail |
| Cash coverage | 39.8x (7.7x excluding earmarked cash) | Pass |
Verdict: Moderately Sustainable. A ₹7.33 crore payout is small next to a net-cash balance sheet and a 5.5% payout ratio. It fails the cash-flow tests, though. Keeping the dividend at this level carries little risk. Raising it will need operating cash to catch up with reported profit. Two of the four tests pass, both on the strength of the balance sheet rather than cash generation.
Ceinsys Tech Limited Dividend vs Geospatial and Engineering Peers
| Company | Yield | Payout | ROE | ROCE | OCF ÷ PAT (FY26) |
|---|---|---|---|---|---|
| Ceinsys Tech | 0.51% | 5.5% | 24.8% | 27.7% | 2.6% |
| C.E. Info Systems (MapmyIndia) | 0.40% | 14% | 12.0% | 19.1% | 69% |
| Genesys International | 0.00% | 0% | 5.7% | 8.3% | 48% |
| Cyient | 1.46% | 42% | 8.6% | 12.3% | 170% |
Ceinsys Tech has the highest ROE and ROCE in this group, but its cash conversion is by far the weakest. Cyient pays the most because its operating cash flow runs ahead of its profit. Peer figures are consolidated, from Screener.in (prices as of 25 September 2026).
Ceinsys Tech Limited Promoter Dividend Impact
| Holder Group (June 2026) | Stake | Dividend Share |
|---|---|---|
| Promoters (Meghe Group) | 50.88% | ₹3.73 crore |
| FIIs | 10.05% | ₹0.74 crore |
| DIIs | 0.24% | ₹0.02 crore |
| Public | 38.83% | ₹2.85 crore |
Promoter family members put ₹67.50 crore into the company in FY26 through warrant conversion at ₹559.90. Set against that capital, their ₹3.73 crore dividend is small. With a 5.5% payout, this dividend is not a meaningful route for moving cash to the promoters. Its benefit is spread across all holders in proportion to their stakes.
Ceinsys Tech Limited Dividend Taxation
Dividends are taxed at the shareholder’s income-tax slab rate. From 1 April 2026, TDS falls under Section 393 of the Income-tax Act, 2025 (which replaces Section 194). The rate is 10% when a company pays a resident more than ₹10,000 in a year, and 20% if PAN is missing. The company’s AGM notice asked for Form 15G/15H by 19 September 2026. The new Act uses Form 121 for this.
Standard Example (1,000 shares, ₹10 DPS, 30% slab)
- Gross dividend: ₹10,000
- Tax at 30%: ₹3,000 (₹3,120 including 4% cess)
- Net dividend: ₹7,000
- Effective yield at ₹686: 1.46% gross, 1.02% after tax
Actual Ceinsys Payout (1,000 shares)
- Gross dividend: ₹3,500 (below the TDS threshold)
- Tax at 30%: ₹1,050
- Net dividend: ₹2,450
- Post-tax yield: 0.36%
Ceinsys Tech Limited Key Risks
- Receivable conversion: ₹318.60 crore of work is completed but not yet billed. Payment depends on government milestone certification.
- Government funding exposure: The reported ₹112.4 crore SWSM cancellation shows that Jal Jeevan Mission-linked orders can be withdrawn.
- Tax normalisation: Without the one-time ESOP deduction, the tax rate returns toward 29%, which would reduce EPS growth.
- Capital deployment: ₹235 crore is earmarked for acquisitions and the AI JV, and execution risk is high.
- Leadership change: The CFO leaves on 15 October 2026, while receivables are the central issue.
- Dilution: Equity capital rose 20.1% in FY26, spreading future per-share gains across more shares.
What To Monitor for Ceinsys Tech Limited Dividend Investors
- H1 FY27 operating cash flow: whether OCF rises to at least half of net profit
- Unbilled receivables: whether the ₹318.60 crore balance falls in the September 2026 balance sheet
- Order inflow: new wins against the reported ₹990 crore order book at June 2026
- Use of preferential money: any acquisition announcement and its price
- Effective tax rate: the FY27 quarterly trend back toward 25–29%
- FY27 dividend decision: whether the payout ratio moves up from 5.5%
- Dividend credit: whether the FY26 payment reaches bank accounts by the 26 October 2026 statutory deadline
Ceinsys Tech Limited Dividend: Conclusion
Positives
- 12 straight years of dividends
- ₹245 crore net cash and earnings cover of 21.4x
- Highest ROE and ROCE among the peers compared
Negatives
- Real yield of 0.51%, not 35%
- OCF only 2.6% of net profit and negative FCF
- Profit growth boosted by a one-time tax benefit
The Ceinsys Tech dividend of ₹3.50 is safe for now, but it is a token amount. The stock is a growth and receivables story, not an income one. Investors should weigh the cash-flow evidence alongside the profit headline.
Frequently Asked Questions About Ceinsys Tech Limited Dividend
What dividend has Ceinsys Tech announced for FY26?
What is the Ceinsys Tech dividend yield?
What was the Ceinsys Tech dividend record date?
What was the ex-dividend date?
When will the Ceinsys Tech dividend be paid?
Who is eligible for this dividend?
How is the Ceinsys Tech dividend taxed?
Is the Ceinsys Tech dividend sustainable?
What is the Ceinsys Tech dividend history?
Why is net profit so much higher than operating cash flow?
How much do Ceinsys Tech promoters receive?
How does Ceinsys Tech compare with peers on dividends?
What should Ceinsys Tech investors monitor?
Disclaimer on Ceinsys Tech Limited Dividend Analysis
This article is for educational and informational purposes only. It is not investment advice or a recommendation to buy, sell or hold any security. ShareBazaar Online is not a SEBI-registered investment adviser or research analyst. The figures come from company filings and third-party data sources such as Screener.in, Trendlyne and brokerage websites, and they may change. Market prices change constantly. Dates marked as inferred have not been confirmed by the company. Please verify details against official NSE/BSE disclosures and consult a SEBI-registered adviser before making any investment decision.