
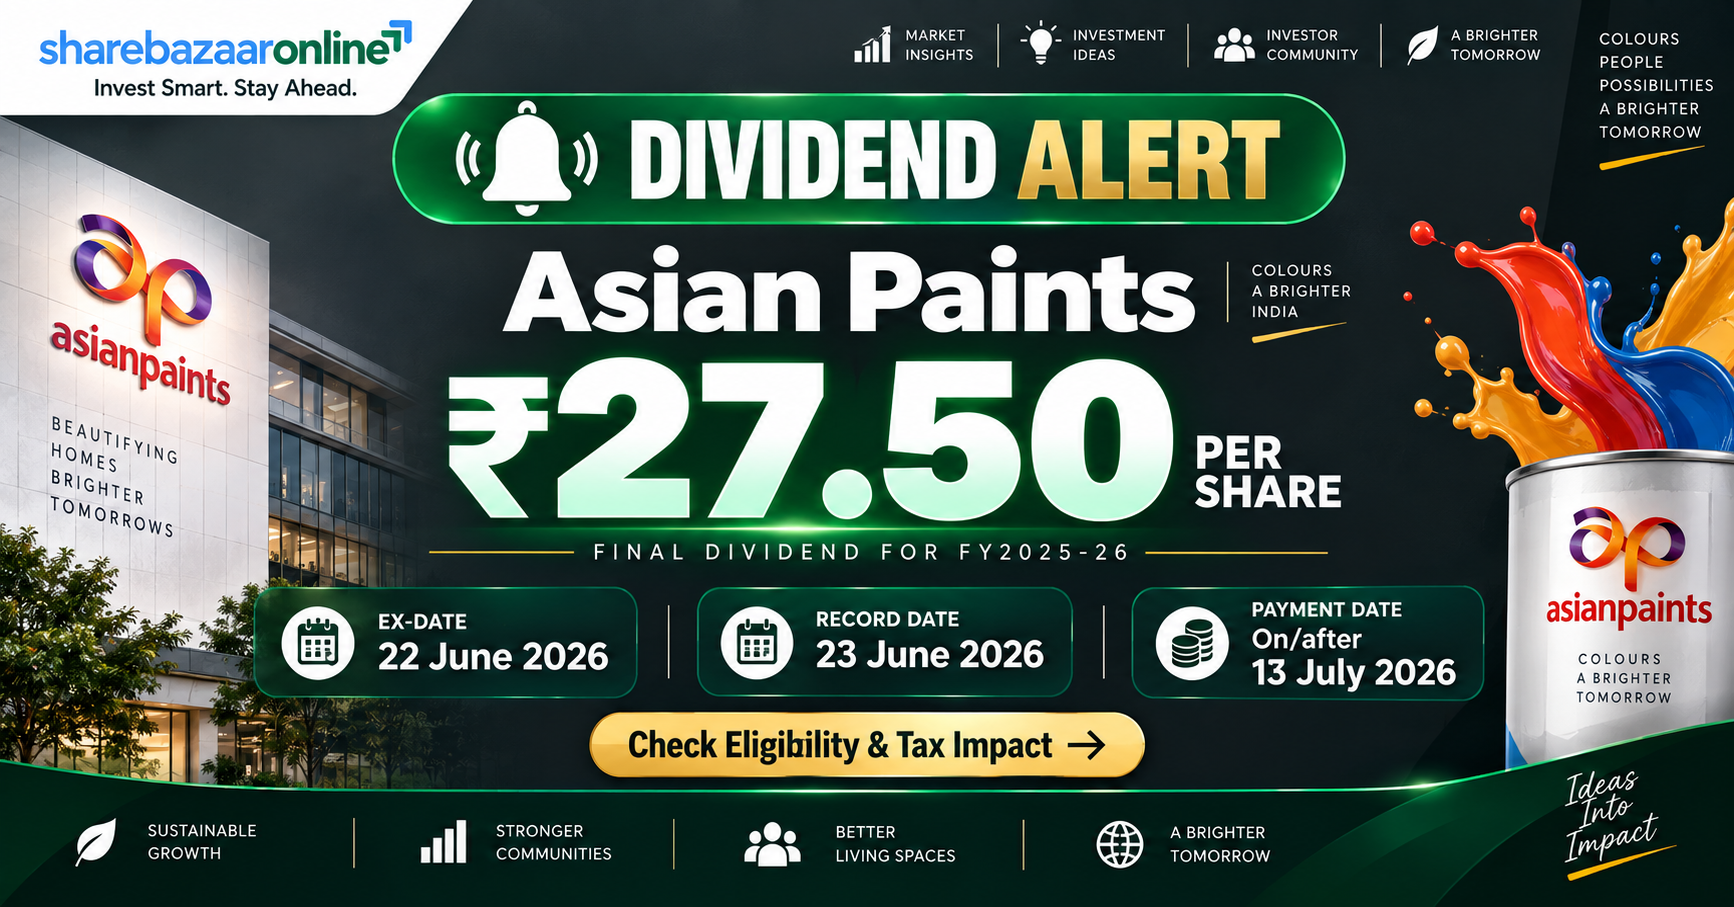
Asian Paints Limited — FY26 Final Dividend ₹23 Per Share
Final Dividend
Comprehensive dividend analysis: yield, sustainability, cash flow coverage, peer comparison, taxation and key dates
Published: ShareBazaar Online · Announcement: 29 May 2026 · Record Date: 23 June 2026
Asian Paints Limited — Company Overview
Asian Paints Limited (NSE: ASIANPAINT | BSE: 500820 | ISIN: INE021A01026) is India's largest and Asia's third-largest paints company, headquartered in Mumbai. Operating across 15+ countries with 27 manufacturing facilities, the company dominates India's decorative paints segment with a market share exceeding 50%. Its product portfolio spans decorative paints, waterproofing, adhesives, and home décor through brands like Asian Paints, Apcolite, and Royale. For FY26, consolidated revenue stood at ₹35,583.54 Cr with a net profit of ₹4,394.69 Cr, reflecting robust demand recovery across both domestic and international operations. The company is led by Managing Director & CEO Amit Syngle.
Asian Paints Limited Financial Analysis – FY26
Consolidated P&L Highlights
| Metric | FY26 | FY25 | Growth |
|---|---|---|---|
| Revenue | ₹35,584 Cr | ₹33,906 Cr | +4.9% |
| EBITDA | ₹7,428 Cr | ₹6,356 Cr | +16.9% |
| Net Profit (PAT) | ₹4,395 Cr | ₹3,710 Cr | +18.5% |
| EPS (Basic) | ₹45.12 | ₹38.25 | +18.0% |
| EBITDA Margin | 20.9% | 18.7% | +212 bps |
Key Ratios (Consolidated)
| Return on Equity (ROE) | ~20.2% |
| Return on Capital Employed | ~24.4% |
| PAT Margin | 12.4% |
| Debt-to-Equity | 0.10x |
| Current Ratio | 2.21x |
| Interest Coverage | 31.7x |
Source: Asian Paints FY26 Audited Consolidated Results, BSE Filing dated 29 May 2026
Asian Paints Limited Dividend History – Last 10 Years
| Financial Year | Total DPS (₹) | Type | Dividend % |
|---|---|---|---|
| FY26 | ₹27.50 | Final ₹23 + Interim ₹4.50 | 2,750% |
| FY25 | ₹32.70 | Final ₹21.20 + Interim ₹5.50 + Special ₹6 | 3,270% |
| FY24 | ₹28.15 | Final ₹24.65 + Interim ₹3.50 | 2,815% |
| FY23 | ₹26.25 | Final ₹21.50 + Interim ₹4.75 | 2,625% |
| FY22 | ₹24.50 | Final ₹18.50 + Interim ₹6 | 2,450% |
| FY21 | ₹21.00 | Final ₹14.50 + Interim ₹6.50 | 2,100% |
| FY20 | ₹17.00 | Final ₹11 + Interim ₹4.50 + Special ₹1.50 | 1,700% |
| FY19 | ₹15.50 | Final ₹12 + Interim ₹3.50 | 1,550% |
| FY18 | ₹12.50 | Final ₹9.50 + Interim ₹3 | 1,250% |
| FY17 | ₹10.30 | Final ₹8.50 + Interim ₹1.80 | 1,030% |
Face Value: ₹1 per share. FY26 total includes ₹4.50 interim (paid Nov 2025) + ₹23 final (proposed). FY25 included a ₹6 special dividend. Source: BSE filings, company annual reports.
Asian Paints Limited — Expert Commentary
Asian Paints' FY26 final dividend of ₹23 per share reflects management's confidence in the earnings recovery, with consolidated PAT jumping 18.5% YoY to ₹4,395 Cr. The total FY26 payout of ₹27.50 is 15.9% lower than FY25's ₹32.70, but FY25 included a special dividend of ₹6. Excluding that special payout, the regular dividend has grown from ₹26.70 to ₹27.50 — a 3% increase. Operating cash flow surged 60.3% to ₹7,088 Cr, providing strong dividend coverage. The payout ratio has moderated to ~60% of consolidated PAT from over 88% in FY25, suggesting management is retaining more for growth while maintaining shareholder returns. EBITDA margins expanded 212 basis points to 20.9%, signalling raw material cost relief and improved pricing power.
Asian Paints Limited — Future Outlook
Asian Paints is investing heavily in capacity expansion with ₹1,848.67 Cr in capital work-in-progress, signalling near-term commissioning of new facilities. The home décor and waterproofing segments offer adjacency growth beyond core decorative paints. However, crude oil-linked raw material costs remain a structural risk — a 10% surge in titanium dioxide or VAM prices could compress margins by 150–200 bps. International operations contributed meaningful revenue but face currency volatility and geopolitical risks in key markets. The company's net cash position of ~₹5,186 Cr (consolidated) provides a comfortable buffer for both capex and dividend sustenance. Dividend growth is likely to track PAT growth at 12–15% CAGR if margins hold.
Dividend Snapshot – Asian Paints Limited
Dividend Details
| Company | Asian Paints Limited |
| NSE Symbol | ASIANPAINT |
| BSE Code | 500820 |
| ISIN | INE021A01026 |
| Face Value | ₹1 |
| Dividend Type | Final Dividend |
| Final Dividend Per Share | ₹23.00 |
| Dividend % | 2,300% |
| Interim Dividend (FY26) | ₹4.50 |
| Total FY26 Dividend | ₹27.50 |
Key Metrics
| Financial Year | FY2025-26 |
| Total Dividend Outflow | ~₹2,638 Cr |
| Shares Outstanding | ~95.92 Cr |
| CMP (Approx.) | ~₹2,451 |
| Dividend Yield (Total FY26) | ~1.12% |
| Payout Ratio (Consolidated) | ~60.0% |
| Dividend Coverage Ratio | 1.64x |
| AGM Approval Required | Yes (9 Jul 2026) |
Asian Paints Limited Dividend Announcement Summary
The Board of Directors of Asian Paints Limited, at its meeting held on 29 May 2026, recommended a final dividend of ₹23 per equity share (2,300% on face value of ₹1) for the financial year ended 31 March 2026. This is subject to shareholders' approval at the 80th Annual General Meeting scheduled for 9 July 2026. Combined with the interim dividend of ₹4.50 per share already paid, total FY26 dividend stands at ₹27.50 per share (2,750%). The CMP on the announcement date was approximately ₹2,672, translating to an announcement-date yield of ~1.03%. The auditor Deloitte Haskins & Sells LLP issued an unmodified opinion on both standalone and consolidated results.
Asian Paints Limited Dividend Key Dates Timeline
| Event | Date | Details |
|---|---|---|
| Announcement Date | 29 May 2026 | Board Meeting |
| Ex-Dividend Date | 22 Jun 2026 | Last buy: 19 Jun 2026 |
| Record Date | 23 Jun 2026 | Eligibility determined |
| Payment Date | On/After 13 Jul | Post-AGM (9 Jul 2026) |
Asian Paints Limited Dividend Yield Analysis
Yield Computation
| Final Dividend Yield (at CMP ~₹2,451) | 0.94% |
| Total FY26 Yield (at CMP ~₹2,451) | 1.12% |
| Yield at Announcement CMP (~₹2,672) | 1.03% |
| Sector Average Yield (Paints) | ~0.85–0.95% |
Yield Reality Check
Asian Paints' 1.12% yield is modest in absolute terms but is among the highest in the premium paints sector. The yield appears slightly elevated versus its 5-year average of ~0.8–0.9% partly because the share price has corrected from highs of ₹3,300+ (2024) to the current ~₹2,451 range. This is not a signal of business distress — rather, the correction reflects premium valuation re-rating after slower volume growth in FY24-25. The underlying dividend amount has grown consistently, confirming that yield improvement is driven by both rising payouts and price moderation.
Asian Paints Limited Dividend History Analysis
Asian Paints is classified as a Consistent Dividend Payer. The company has paid dividends without interruption for over 25 consecutive years, including during COVID-19 (FY21: ₹21/share). Total DPS has grown from ₹10.30 (FY17) to ₹27.50 (FY26) — a 10-year CAGR of approximately 11.5%. FY25 included a one-time special dividend of ₹6, which inflated total DPS to ₹32.70. Excluding specials, the regular dividend trajectory shows steady growth. No dividend cuts or suspensions have occurred in the last decade. The interim dividend component has remained stable at ₹3–6, with the bulk of distribution coming through final dividends.
Asian Paints Limited Financial Performance Analysis – FY26
Operating Leverage Assessment
FY26 demonstrates strong positive operating leverage. Consolidated revenue grew 4.9% YoY, while EBITDA expanded 16.9% and PAT surged 18.5%. This amplification indicates improving cost efficiency: raw material costs grew slower than revenue, expanding gross margins. Employee costs rose to ₹2,800 Cr (+7.8%) reflecting wage inflation and new hires, but were more than offset by raw material cost benefits. Other expenses at ₹6,086 Cr grew 5.2%, broadly in line with revenue. The EBITDA margin expansion of 212 bps (from 18.7% to 20.9%) is the most significant margin recovery since FY22, driven primarily by deflation in key inputs like titanium dioxide and crude-linked derivatives.
Asian Paints Limited Cash Flow Analysis – FY26
Cash Flow Summary (Consolidated)
| Net Operating Cash Flow | ₹7,088 Cr |
| OCF vs FY25 (₹4,424 Cr) | +60.3% |
| Capex (PP&E + Intangibles) | ₹1,467 Cr |
| Free Cash Flow | ₹5,621 Cr |
| Dividend Paid | ₹2,425 Cr |
| Cash at Year-End | ₹6,741 Cr |
Cash Quality Assessment
OCF/PAT ratio: 1.61x — Cash generation significantly exceeds reported profits, confirming high earnings quality. Working capital released ₹975 Cr from inventory reduction and ₹397 Cr from increased payables, partly offset by ₹274 Cr receivable build-up. Receivables grew 3.4% vs revenue growth of 4.9% — a healthy sign. The dividend is fully funded from current earnings and operations, not from asset sales or borrowings. FCF coverage of dividends stands at a comfortable 2.13x, leaving ₹3,196 Cr surplus after dividend payments.
Asian Paints Limited Balance Sheet Strength
Balance Sheet Highlights
| Total Assets | ₹34,534 Cr |
| Total Equity (Owners) | ₹21,372 Cr |
| Cash & Investments | ₹7,479 Cr |
| Total Borrowings | ₹2,293 Cr |
| Net Cash Position | ₹5,186 Cr |
Debt Assessment
Asian Paints maintains a net cash balance sheet with cash and investments of ₹7,479 Cr exceeding total borrowings of ₹2,293 Cr. Borrowings increased from ₹864 Cr (FY25) to ₹2,293 Cr — primarily for capacity expansion. Debt-to-equity at 0.10x remains exceptionally low. Cash coverage of total dividend outflow is 2.84x, and interest coverage at 31.7x leaves no concern about debt servicing.
Asian Paints Limited Dividend Sustainability Analysis
Sustainability Scorecard
| Payout Ratio | 60.0% | ✓ Comfortable |
| OCF Coverage | 2.69x | ✓ Strong |
| FCF Coverage | 2.13x | ✓ Strong |
| Cash Coverage | 2.84x | ✓ Strong |
| Net Debt Position | Net Cash | ✓ No Concern |
| Earnings Trend | Growing | ✓ Positive |
| 10-Year Consistency | Unbroken | ✓ Strong |
Classification: SUSTAINABLE
Asian Paints' dividend is classified as Sustainable. Every key metric supports continued dividend payments and growth. The payout ratio of 60% is well below the 75% caution threshold. Free cash flow of ₹5,621 Cr is more than double the total dividend outflow. The company operates in a defensive consumer sector with predictable cash flows. Key risk to sustainability: A sharp raw material cost spike (like 2022-23) could compress margins and OCF, but the company's pricing power and net cash position provide a significant cushion.
Asian Paints Limited Peer Comparison
| Company | Div. Yield | Payout | ROE | ROCE | Net Cash? |
|---|---|---|---|---|---|
| Asian Paints | 1.12% | ~60% | ~20.2% | ~24.4% | Yes |
| Berger Paints | ~0.90% | ~50% | ~22% | ~27% | Yes |
| Kansai Nerolac | ~0.94% | ~45% | ~13% | ~16% | Yes |
| Indigo Paints | ~0.30% | ~15% | ~12% | ~16% | Yes |
| Akzo Nobel India | ~1.50% | ~65% | ~18% | ~25% | Yes |
Peer data approximate based on latest available filings. Asian Paints offers the highest absolute DPS in the sector and ranks second by yield after Akzo Nobel. All major paints companies are net-cash. Source: NSE/BSE filings, Screener.in.
Asian Paints Limited Promoter Impact Analysis
Shareholding Pattern (Latest)
| Promoter Holding | 52.63% |
| FII Holding | 13.32% |
| DII Holding | 20.77% |
| Public & Others | 13.28% |
Promoter Dividend Income
| Promoter Share of Outflow | ~₹1,388 Cr |
| FII Dividend Income | ~₹351 Cr |
| DII Dividend Income | ~₹548 Cr |
The promoter group (Choksi and Dani families) receives approximately ₹1,388 Cr — over half the total dividend outflow. With a 52.63% stake, promoter interests are strongly aligned with minority shareholders. Promoter holding has remained stable with no pledging.
Asian Paints Limited Dividend Taxation Analysis
Indian Dividend Tax Rules
Since April 2020, dividends are taxable in the hands of shareholders at their applicable income tax slab rate. Companies deduct TDS at 10% if total dividend to a resident individual exceeds ₹5,000 in a financial year. For NRIs, TDS is 20% (plus applicable surcharge and cess). Shareholders can claim TDS credit while filing returns. No additional DDT applies at the company level.
Worked Example: 1,000 Shares
| Shares Held | 1,000 |
| Final Dividend Per Share | ₹23.00 |
| Gross Dividend | ₹23,000 |
| TDS (10%) | − ₹2,300 |
| Net Dividend Received | ₹20,700 |
| Tax at 30% Slab | ₹6,900 |
| Net After-Tax Dividend | ₹16,100 |
| Effective Post-Tax Yield | 0.66% |
Assumes 30% + 4% cess = 31.2% effective rate. Higher slab holders pay more. Surcharge applies to income above ₹50 lakh.
Asian Paints Limited Capital Allocation Analysis
With free cash flow of ₹5,621 Cr and dividend outflow of ~₹2,638 Cr, management retained approximately ₹2,983 Cr in surplus. Debt reduction is not pressing — net cash of ₹5,186 Cr and interest coverage of 31.7x show no leverage concern. Capex of ₹1,467 Cr is being deployed into new capacity (₹1,849 Cr CWIP), appropriate for sustaining market leadership. A buyback could have been considered — at current valuations (~50x P/E), buybacks are expensive but would signal confidence. The 60% payout ratio strikes a reasonable balance between shareholder returns and growth reinvestment. However, the growing cash pile (₹6,741 Cr) may face investor scrutiny if not deployed productively.
Asian Paints Limited — Key Risks
- 1. Raw Material Cost Volatility: Crude oil derivatives (TiO2, VAM, pentaerythritol) account for ~35% of costs. A 15–20% spike could erode EBITDA margins by 200–300 bps and compress FCF.
- 2. Competitive Intensity: Grasim Industries (Birla Opus) entered the decorative paints market aggressively. Market share pressure may impact Asian Paints' pricing power and margins.
- 3. Real Estate Demand Slowdown: New home painting (30–35% of demand) is linked to housing construction. A prolonged real estate downturn could dampen volume growth.
- 4. International Operations Risk: Subsidiaries in Sri Lanka, Bangladesh, Nepal, Egypt and the Middle East face currency depreciation and political instability risks.
- 5. Premium Valuation Risk: Trading at ~50x P/E, any earnings miss could trigger sharp corrections. The stock has already corrected ~25% from 2024 highs.
- 6. Technology Disruption: Quick-commerce paint delivery and digital colour matching by new entrants could disrupt traditional distribution advantages in urban markets.
- 7. Regulatory/Tax Changes: GST rate revisions on paints (currently 18%) or changes in dividend taxation could affect net returns to shareholders.
Asian Paints Limited — What To Monitor
- 1. Quarterly Volume Growth: Decorative paint volumes are the lead indicator of business health. Track whether volume growth returns to double digits after the muted FY24-25 period.
- 2. Raw Material Cost Trajectory: Monitor crude oil, TiO2, and VAM price trends quarterly. Sustained deflation supports margins; a reversal compresses them rapidly.
- 3. Grasim/Birla Opus Market Share: Track Birla Opus revenue ramp-up and dealer network expansion. Any significant market share loss would pressure pricing power.
- 4. EBITDA Margin Sustainability: FY26's 20.9% margin is above the 5-year average (~19%). Monitor whether this is sustained or reverts.
- 5. Cash Deployment Strategy: Watch whether the ₹6,741 Cr cash pile is deployed into acquisitions, capacity, buybacks, or continues to accumulate.
- 6. International Subsidiary Performance: Profitability of Middle East and South Asian operations can swing consolidated results by ₹100–200 Cr.
- 7. Housing Sector Indicators: Monitor cement dispatch volumes, real estate launches, and housing loan growth as proxy indicators for repainting demand.
Asian Paints Limited Dividend — Conclusion
Asian Paints' FY26 final dividend of ₹23 per share (total FY26: ₹27.50) is backed by strong fundamentals — consolidated PAT of ₹4,395 Cr growing 18.5%, operating cash flow of ₹7,088 Cr, and a net cash balance sheet of ₹5,186 Cr. The dividend is classified as Sustainable with a comfortable 60% payout ratio and FCF coverage of 2.13x. While the 1.12% yield is modest for income-focused investors, Asian Paints is a quality compounder where dividend growth (~11.5% CAGR over 10 years) and capital appreciation together drive total returns. The record date is 23 June 2026 and shares must be purchased by 19 June 2026 to be eligible.
Frequently Asked Questions About Asian Paints Limited Dividend
What dividend has Asian Paints announced for FY26?
What is Asian Paints' dividend yield for FY26?
What is the record date for Asian Paints' FY26 final dividend?
What is the ex-dividend date for Asian Paints?
When will Asian Paints pay the FY26 final dividend?
Who is eligible for Asian Paints' final dividend?
How is Asian Paints' dividend taxed in India?
Is Asian Paints' dividend sustainable?
What is Asian Paints' dividend history over the last 10 years?
What should investors monitor after this dividend?
How does Asian Paints' dividend compare to peers?
What is Asian Paints' dividend payout ratio for FY26?
Disclaimer
This article is published by ShareBazaar Online for educational and informational purposes only. It does not constitute investment advice, a buy/sell/hold recommendation, or an offer to transact in any security. All financial data has been sourced from Asian Paints Limited's BSE filing dated 29 May 2026, NSE/BSE market data, and publicly available information. While every effort has been made to ensure accuracy, ShareBazaar Online does not guarantee the completeness or timeliness of the information presented. Investors should consult a SEBI-registered financial advisor before making any investment decisions. Past dividend performance does not guarantee future payments. Dividends are subject to shareholder approval and company performance. ShareBazaar Online, its team members, or affiliates may hold positions in the securities mentioned. Markets are subject to risks; please read all scheme-related documents carefully.