
Sangam (India) Limited – Company Overview
Sangam (India) Limited (NSE: SANGAMIND | BSE: 514234 | ISIN: INE495C01010) is one of India’s largest vertically integrated textile manufacturers, headquartered in Bhilwara, Rajasthan. Established in 1984, the company operates across the entire textile value chain — from PV dyed yarn and grey fabric to finished denim and seamless garments. The company’s subsidiary, Sangam Ventures Limited, along with joint venture Goldenseams Sangam Private Limited, extends its manufacturing footprint. With a consolidated revenue of ₹3,234.53 Cr in FY2025-26 and a workforce spanning multiple facilities, Sangam India remains a significant player in India’s textile sector. The company trades at a market price of approximately ₹580 per share (as of September 2026), giving it a market capitalisation of roughly ₹2,915 Cr.
Sangam (India) Limited Financial Analysis – FY2025-26
Consolidated P&L Highlights
Sangam India reported consolidated revenue of ₹3,234.53 Cr in FY26, up 13.22% from ₹2,856.95 Cr in FY25. EBITDA surged 26.45% to ₹328.79 Cr, with EBITDA margin expanding to 10.17%. Consolidated PAT jumped 159.75% to ₹82.60 Cr from ₹31.80 Cr in FY25, driven by positive operating leverage — revenue grew 13% but profits grew 160% as fixed costs were absorbed across higher volumes. Basic EPS (before exceptional items) rose to ₹17.76 from ₹7.65.
Key Financial Ratios
| ROE | 7.67% |
| ROCE | 12.42% |
| P/E Ratio | 32.66x |
| P/B Ratio | 2.71x |
| Debt-to-Equity | 1.19x |
| Book Value/Share | ₹214.18 |
Sangam (India) Limited Dividend History (Last 10 Years)
| Financial Year | DPS (₹) | Type | % of Face Value |
|---|---|---|---|
| FY2025-26 | ₹2.00 | Final | 20% |
| FY2024-25 | ₹2.00 | Final | 20% |
| FY2023-24 | ₹2.00 | Final | 20% |
| FY2022-23 | ₹2.00 | Final | 20% |
| FY2021-22 | ₹2.00 | Final | 20% |
| FY2020-21 | ₹1.00 | Final | 10% |
| FY2019-20 | ₹1.00 | Final | 10% |
| FY2018-19 | ₹1.00 | Final | 10% |
| FY2017-18 | ₹1.00 | Final | 10% |
| FY2016-17 | ₹2.00 | Final | 20% |
| FY2015-16 | ₹2.00 | Final | 20% |
Classification: Consistent Payer. Sangam India has maintained an unbroken dividend streak over the past decade. The company stepped up its payout from ₹1 to ₹2 per share in FY2021-22 and has maintained that level for five consecutive years.
Expert Commentary – Sangam (India) Limited Dividend
Sangam India’s 20% dividend looks impressive on paper — but this is a classic face-value illusion. The ₹2 per share dividend on a ₹10 face value translates to just 0.34% yield at the current market price of ₹580. Management has chosen to prioritise growth over distributions: of the ₹268.72 Cr operating cash flow, only ₹10.05 Cr (3.7%) goes to dividends while ₹225.65 Cr (84%) is reinvested as capex. The 159.75% PAT growth confirms the strategy is producing results, but investors seeking meaningful dividend income should look elsewhere. Sangam India is a growth-first, token-dividend company. The recent issuance of 18 lakh preferential warrants to promoters at ₹555.56 per share further signals a capex and expansion focus.
Sangam (India) Limited – Future Outlook
Sangam India’s capex-heavy strategy — with ₹225.65 Cr invested in FY26 — suggests that management expects higher revenue throughput from expanded capacity. The ₹100 Cr warrant issuance to promoters signals confidence in future growth. However, elevated debt (₹1,275.94 Cr total borrowings, D/E 1.19x) and rising trade receivables (₹637.12 Cr, up 23.11% vs 13.22% revenue growth) are areas of concern. If the textile cycle turns or receivables deteriorate, the thin 2.55% PAT margin offers limited buffer. Dividend investors should not expect a payout increase until the capex cycle concludes and debt is meaningfully reduced.
Dividend Snapshot – Sangam (India) Limited
| Company | Sangam (India) Limited |
| NSE Symbol | SANGAMIND |
| BSE Code | 514234 |
| ISIN | INE495C01010 |
| Face Value | ₹10 |
| Dividend Type | Final Dividend |
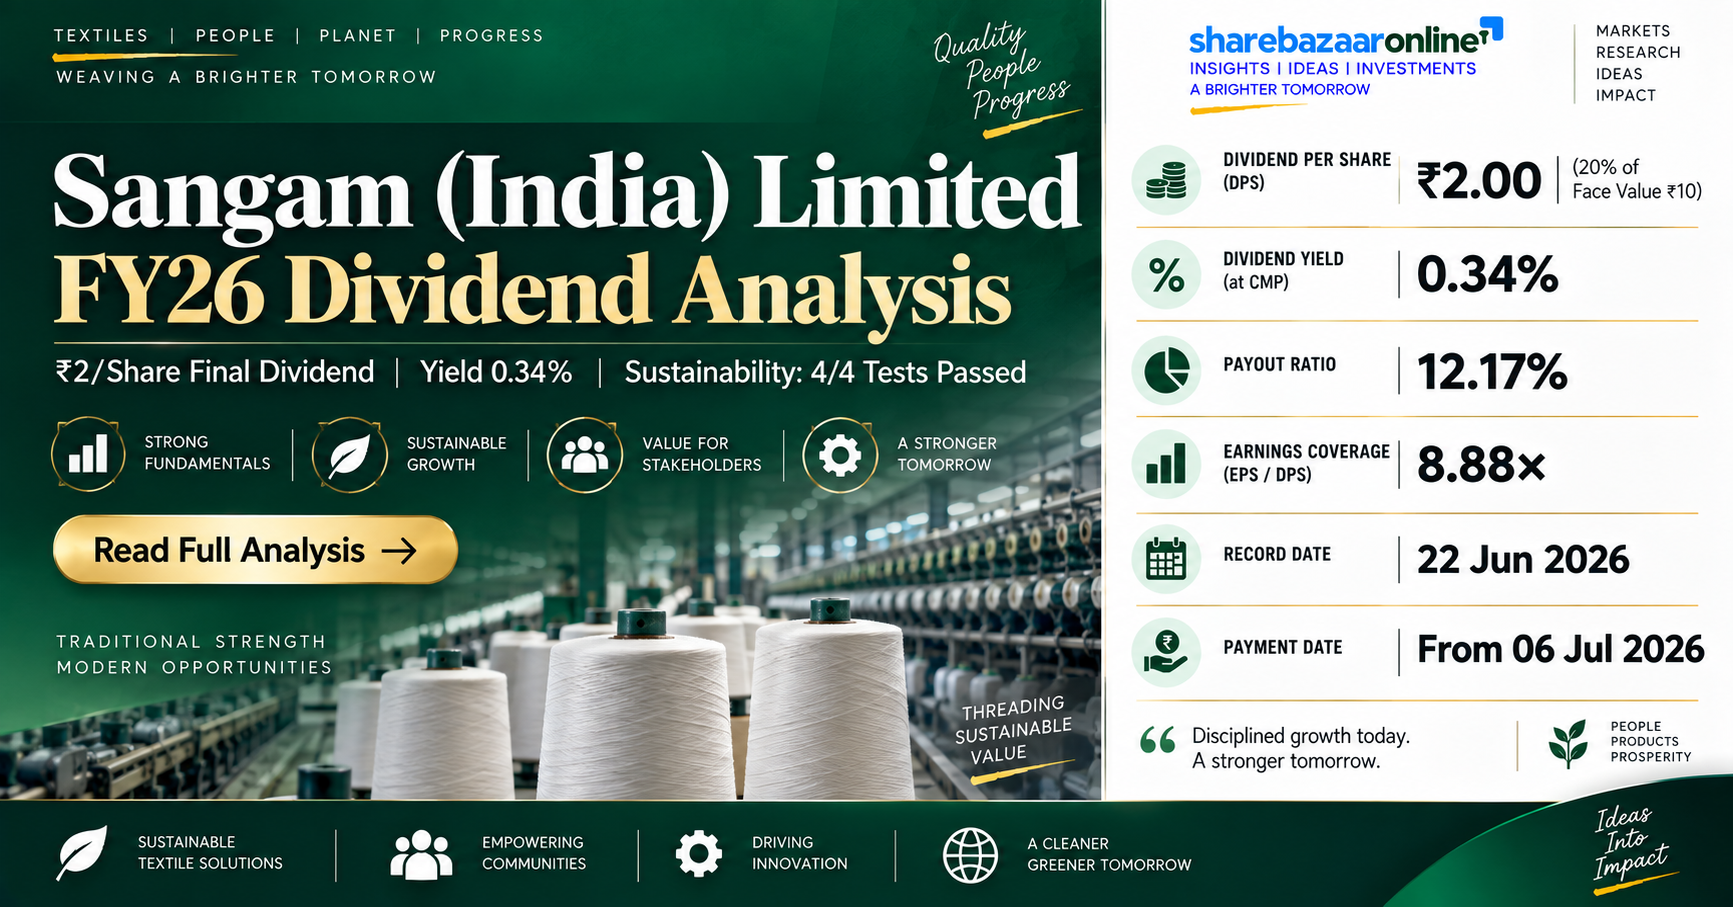
| Dividend Per Share | ₹2.00 |
| Dividend % | 20% |
| Financial Year | FY2025-26 |
| Yield (Announcement CMP) | 0.37% |
| Yield (Current CMP) | 0.34% |
| Payout Ratio | 12.17% |
| Earnings Coverage | 8.88x |
| Total Outflow | ₹10.05 Cr |
| Shares Outstanding | 5.025 Cr |
| Sustainability | Sustainable (4/4) |
Sangam (India) Limited Dividend Announcement Summary
On 22nd April, 2026, the Board of Directors of Sangam (India) Limited, in their meeting held at the company’s registered office in Bhilwara (Rajasthan), recommended a Final Dividend of ₹2 per equity share (20% on face value of ₹10) for the financial year ended 31st March, 2026. This dividend was subject to approval at the ensuing Annual General Meeting. The board meeting commenced at 11:30 AM and concluded at 2:15 PM. The company also approved audited standalone and consolidated financial results for Q4 and full year FY2025-26, along with the re-appointment of internal auditors M/s. Protiviti India and cost auditors M/s K.G. Goyal & Co. The statutory auditors (R Kabra & Co. LLP and O.P. Dad & Co.) issued an unmodified opinion on both standalone and consolidated results.
Sangam (India) Limited Dividend – Key Dates Timeline
22nd April, 2026
19th June, 2026
22nd June, 2026
From 6th July, 2026
Note: The ex-date is inferred as one trading day before the record date under T+1 settlement. The record date (22nd June, 2026) has already passed. Shareholders who held the stock on the record date were eligible for this dividend.
Sangam (India) Limited Dividend Yield Analysis
Yield Breakdown
| Dividend Per Share | ₹2.00 |
| CMP on Announcement Date | ₹538.40 |
| Yield at Announcement CMP | 0.37% |
| Latest CMP (~Sep 2026) | ₹580.00 |
| Yield at Current CMP | 0.34% |
The Face-Value Illusion
The headline “20% dividend” sounds generous, but this percentage is calculated on the ₹10 face value, not the market price of ₹580. At the current market price, the actual dividend yield is just 0.34% — below the savings account interest rate. For context, a 1-year bank fixed deposit currently offers approximately 6.5–7.0%. This is not a dividend stock; the yield is essentially a token distribution while the company reinvests most of its cash flow into capacity expansion.
Sangam (India) Limited Dividend History Analysis
Sangam India’s dividend track record shows an unbroken streak of over 10 years. The company paid ₹2 per share in FY2015-16 and FY2016-17, then reduced to ₹1 during the FY2017-18 to FY2020-21 period (likely reflecting a textile industry downturn and COVID impact). From FY2021-22 onwards, the payout was restored to ₹2 per share and has been maintained for five consecutive years. This ₹2 payout has remained flat despite a 159.75% jump in PAT in FY26, confirming that dividend growth is not a management priority. The company is a Consistent Payer but not a dividend grower — investors receive a stable token while the business channels cash into capex and debt servicing.
Sangam (India) Limited Financial Performance Analysis
Growth Metrics (Consolidated YoY)
| Revenue Growth | +13.22% |
| EBITDA Growth | +26.45% |
| PAT Growth | +159.75% |
| EBITDA Margin | 10.17% |
| PAT Margin | 2.55% |
Operating Leverage
Sangam India exhibited positive operating leverage in FY26. Revenue grew 13.22%, EBITDA grew 26.45%, and PAT grew 159.75%. The outsized PAT growth reflects a low base effect (FY25 PAT was depressed at ₹31.80 Cr) and the high proportion of fixed costs in textile manufacturing. However, investors should note that the 2.55% PAT margin remains thin, meaning even a modest revenue decline could disproportionately impact profitability. Finance costs at ₹113.95 Cr consumed nearly 35% of EBITDA.
Sangam (India) Limited Cash Flow Analysis
Cash Flow Quality Check (Consolidated FY26)
| Net Profit Before Tax | ₹112.85 Cr |
| Operating Cash Flow (OCF) | ₹268.72 Cr |
| Capex (PPE Purchases) | ₹225.65 Cr |
| Free Cash Flow (OCF – Capex) | ₹43.07 Cr |
| Dividend Outflow | ₹10.08 Cr |
| OCF-to-PAT Ratio | 3.25x |
Cash flow quality is strong. OCF of ₹268.72 Cr is 3.25x the reported PAT, confirming that profits are backed by real cash generation. The dividend is funded entirely through current earnings, not asset sales or borrowings. However, ₹225.65 Cr in capex consumed 84% of OCF, leaving a modest FCF of ₹43.07 Cr. The dividend at ₹10.05 Cr is comfortably covered by FCF (4.29x coverage). Receivables surged from ₹517.53 Cr to ₹637.12 Cr (up 23.11% vs 13.22% revenue growth), stretching days receivable from 66 to 72 days — a trend to monitor.
Sangam (India) Limited Balance Sheet Strength
Debt Position (Consolidated)
| Non-Current Borrowings | ₹719.40 Cr |
| Current Borrowings | ₹556.54 Cr |
| Total Borrowings | ₹1,275.94 Cr |
| Cash & Investments | ₹194.96 Cr |
| Net Debt | ₹1,210.14 Cr |
Balance Sheet Ratios
Sangam India carries substantial debt at ₹1,275.94 Cr against total equity of ₹1,076.27 Cr, resulting in a debt-to-equity ratio of 1.19x. Net debt stands at ₹1,210.14 Cr. Finance costs of ₹113.95 Cr consumed 34.7% of EBITDA. While this is typical for capital-intensive textile manufacturers with heavy working capital needs, it limits the company’s flexibility to increase dividends. Total assets grew from ₹2,955.25 Cr to ₹3,314.82 Cr, reflecting ongoing capacity expansion.
Sangam (India) Limited Dividend Sustainability Analysis
4-Test Sustainability Scorecard
| Test | Value | Threshold | Result |
|---|---|---|---|
| Earnings Coverage (EPS/DPS) | 8.88x | ≥ 1.5x | PASS |
| OCF Coverage | 26.74x | ≥ 1.0x | PASS |
| FCF Coverage | 4.29x | ≥ 1.0x | PASS |
| Cash Coverage | 19.40x | ≥ 1.0x | PASS |
Verdict: Sustainable (4/4 tests passed). The ₹2 dividend is well within the company’s ability to pay. With a payout ratio of just 12.17%, the dividend barely dents Sangam India’s earnings. However, sustainability at such a small payout is trivial — the real question is whether the company will ever increase its dividend meaningfully. Given the ongoing capex cycle and high debt, a significant payout increase appears unlikely in the near term.
Sangam (India) Limited Peer Comparison
| Company | Div. Yield | Payout Ratio | ROE | ROCE | P/E |
|---|---|---|---|---|---|
| Sangam (India) | 0.34% | 12.17% | 7.67% | 12.42% | 32.66x |
| Vardhman Textiles | ~2.50% | ~25% | ~12% | ~14% | ~12x |
| Trident Ltd | ~1.80% | ~30% | ~10% | ~12% | ~18x |
| Arvind Ltd | ~1.19% | ~15% | ~9% | ~11% | ~20x |
Source: Company filings, Screener.in. Peer data is approximate and may vary based on reporting period. Sangam India’s yield of 0.34% is the lowest among peers. Vardhman Textiles offers ~7x the yield at a lower P/E. The elevated P/E of 32.66x suggests the market is pricing Sangam India for growth rather than income.
Sangam (India) Limited Promoter Impact Analysis
Shareholding Pattern
| Promoters | 70.52% |
| FIIs | 2.50% |
| DIIs | 0.09% |
| Public & Others | 26.89% |
Dividend Distribution
With promoter holding at 70.52%, the Soni family-led promoter group received approximately ₹7.09 Cr of the ₹10.05 Cr total dividend. Minority shareholders received the remaining ₹2.96 Cr. The low DII participation (0.09%) is notable — institutional investors have minimal interest in this stock for income. The recent preferential allotment of 18 lakh warrants at ₹555.56/share to promoters will raise ~₹100 Cr for the company while marginally diluting minority shareholders by 3.58%.
Sangam (India) Limited Dividend Taxation Analysis
Tax Rules (Indian Residents)
Dividends are taxable in the hands of shareholders at their applicable income tax slab rate. TDS at 10% is deducted by the company if total dividend income from the company exceeds ₹5,000 in a financial year. Shareholders can claim credit for TDS while filing their income tax return. NRI shareholders are subject to TDS at 20% (plus applicable surcharge and cess), subject to DTAA benefits.
Worked Example: 1,000 Shares, 30% Tax Slab
| Shares Held | 1,000 |
| Gross Dividend (1000 x ₹2) | ₹2,000 |
| TDS Applicable? | No (below ₹5,000) |
| Tax @ 31.20% (30% + 4% cess) | ₹624 |
| Net Dividend After Tax | ₹1,376 |
| Effective Post-Tax Yield | 0.24% |
Key Risks – Sangam (India) Limited
- 1. High Debt Burden: Total borrowings of ₹1,275.94 Cr with a D/E of 1.19x. Finance costs consume 34.7% of EBITDA. Rising interest rates could compress margins further.
- 2. Receivables Quality Deterioration: Trade receivables grew 23.11% against 13.22% revenue growth, stretching collection days from 66 to 72. This could indicate channel stress or delayed payments from customers.
- 3. Thin Profit Margins: PAT margin of just 2.55% offers minimal buffer against commodity price shocks (cotton, polyester), currency fluctuations, or demand slowdowns.
- 4. Textile Sector Cyclicality: Sangam India operates in a cyclical industry exposed to global demand fluctuations, Chinese competition, cotton price volatility, and trade policy changes.
- 5. Concentrated Promoter Ownership: With 70.52% promoter holding and minimal institutional interest (FII 2.50%, DII 0.09%), the stock has limited liquidity and price discovery depth.
- 6. Capex Execution Risk: Heavy ongoing capex (₹225.65 Cr in FY26) carries execution risk. Any delays or cost overruns could further strain the balance sheet and delay returns on invested capital.
- 7. Low Base Effect in Growth: The 159.75% PAT growth largely reflects a depressed FY25 base (₹31.80 Cr PAT). This growth rate is unlikely to sustain.
Sangam (India) Limited – What To Monitor
- 1. Debt Reduction Trajectory: Monitor whether the company begins deleveraging after the current capex cycle. Any meaningful dividend increase depends on debt reduction first.
- 2. Trade Receivables Trend: Watch the receivables-to-revenue ratio in Q1 FY27 results. If days receivable continue to increase beyond 72 days, it signals potential bad-debt risk.
- 3. Capex Completion & Ramp-up: Track whether new capacity additions translate into revenue growth and margin expansion, or remain under-utilised.
- 4. EBITDA Margin Stability: The 10.17% EBITDA margin needs to hold above 10% for the growth thesis to work. Cotton price spikes or energy cost increases could erode this.
- 5. Warrant Conversion Timeline: The 18 lakh promoter warrants will add ~3.58% dilution. Monitor the conversion pace and how the ₹100 Cr raised is deployed.
- 6. Free Cash Flow Trajectory: FCF of ₹43.07 Cr is thin relative to the ₹3,314.82 Cr asset base. A sustained improvement in FCF would be the earliest indicator of eventual payout increases.
- 7. AGM Approval: Confirm that the final dividend receives AGM approval and that the payment commences from the stated date of 6th July, 2026.
Conclusion – Sangam (India) Limited Dividend
Sangam (India) Limited’s ₹2 per share final dividend for FY2025-26 is sustainable but insignificant for income investors. The 0.34% yield is among the lowest in the textile sector, and the company has deliberately prioritised capex (₹225.65 Cr) and debt servicing (₹113.95 Cr) over shareholder distributions (₹10.05 Cr). The 159.75% PAT growth is encouraging but built on a low base, and the elevated debt of ₹1,275.94 Cr constrains payout flexibility. The rising trade receivables (23.11% growth vs 13.22% revenue growth) and thin 2.55% PAT margin warrant caution. This is a growth-phase textile stock, not a dividend stock. Investors should evaluate Sangam India on its capacity expansion thesis and capital appreciation potential, not on dividend income.
Frequently Asked Questions About Sangam (India) Limited Dividend
What dividend has Sangam (India) Limited announced for FY2025-26?
What is the dividend yield of Sangam (India) Limited?
What is the record date for Sangam (India) Limited dividend?
What is the ex-dividend date for Sangam India shares?
When will Sangam (India) Limited pay the dividend?
Who was eligible for Sangam India’s FY26 dividend?
How is Sangam India’s dividend taxed?
Is Sangam (India) Limited’s dividend sustainable?
What is Sangam India’s dividend history?
What should investors monitor after this dividend announcement?
Why is Sangam India’s dividend yield so low compared to peers?
What is Sangam (India) Limited’s payout ratio?
Disclaimer
This article is published by ShareBazaarOnline for educational and informational purposes only. ShareBazaarOnline is not a SEBI-registered investment advisor. The content does not constitute a buy, sell, or hold recommendation for any security. All financial data has been sourced from the company’s official BSE/NSE filing dated 22nd April, 2026, and publicly available sources including Screener.in and NSE India. Keyword metrics, where referenced, are flagged as “Not Independently Verified (NIV)” due to tool-access limitations during research. Peer comparison data is approximate. Investors should conduct their own due diligence and consult a qualified financial advisor before making any investment decisions. Past dividends do not guarantee future payouts. Market prices and yields are subject to change.