
Company Overview – Agarwal Industrial Corporation Limited
Agarwal Industrial Corporation Limited (NSE: AGARIND | BSE: 532462 | ISIN: INE204E01012) is a Raipur-headquartered diversified conglomerate operating across steel, power, mining, and ferro alloys. The company manufactures sponge iron, steel billets, TMT bars, wire rods, and ferro alloys while also operating captive power plants and iron ore mines in Chhattisgarh. With consolidated revenue of ₹1,652 Cr in FY2025-26 and a market capitalisation of approximately ₹620 Cr, the company caters primarily to the domestic infrastructure and construction steel value chain. Founded by the Agarwal family, the promoter group holds 57.20% equity. The company trades at a P/E of approximately 14.2x trailing consolidated earnings.
Agarwal Industrial Corporation Limited – Financial Analysis
Profitability Snapshot (FY26 Consolidated)
Revenue grew 8.6% YoY to ₹1,652 Cr. Operating profit nearly doubled from ₹77 Cr to ₹120 Cr, expanding OPM from 5.1% to 7.3%. PAT surged 91.3% to ₹44 Cr (EPS ₹29.13 vs ₹15.46). The margin recovery was driven by lower raw material costs and improved steel realisations. However, NPM at 2.7% remains thin for a steel manufacturer, signalling limited pricing power.
Key Return Ratios
ROE improved to 6.4% (FY25: 3.4%) while ROCE rose to 8.8% (FY25: 5.1%). Both remain below the 12-15% threshold expected from efficient capital allocators. Revenue CAGR over four years stands at a modest 1.5%, indicating the company is a cyclical operator rather than a structural growth story. Earnings growth is lumpy and heavily tied to steel cycle dynamics.
Agarwal Industrial Corporation Limited Dividend History
| Financial Year | DPS (₹) | Type | Dividend % | Status |
|---|---|---|---|---|
| FY2025-26 | 3.30 | Final | 33% | Pending AGM |
| FY2024-25 | 2.00 | Final | 20% | Paid |
| FY2023-24 | 2.80 | Final | 28% | Paid |
| FY2022-23 | 2.80 | Final | 28% | Paid |
| FY2021-22 | 2.50 | Final | 25% | Paid |
| FY2020-21 | 1.50 | Final | 15% | Paid |
| FY2019-20 | 0.00 | Nil | 0% | Skipped |
| FY2018-19 | 1.50 | Final | 15% | Paid |
| FY2017-18 | 1.50 | Final | 15% | Paid |
| FY2016-17 | 1.50 | Final | 15% | Paid |
| FY2015-16 | 1.00 | Final | 10% | Paid |
Source: BSE filings, TipRanks, Screener.in. Dividend CAGR (FY17→FY26): 9.2%.
Expert Commentary – Agarwal Industrial Corporation Limited
The 33% dividend on face value sounds generous, but translates to just ₹3.30 per share against a market price of ₹413 — an actual yield of merely 0.80%. This is the classic face-value illusion: a headline percentage that flatters a modest cash payout. What matters more is the underlying profit recovery. PAT nearly doubled to ₹44 Cr, and operating cash flow at ₹235 Cr dwarfs both reported earnings and the ₹4.95 Cr dividend outflow. The company is clearly choosing to retain capital — the 11.25% payout ratio is among the lowest in the listed steel space. Management appears to prioritise debt reduction and capacity maintenance over shareholder distributions.
Agarwal Industrial Corporation Limited – Future Outlook
India’s infrastructure push under the National Infrastructure Pipeline continues to support domestic steel demand. Agarwal Industrial benefits from captive iron ore mines and power plants, providing cost advantages during periods of raw material inflation. However, the company’s small scale relative to major producers (JSW, Tata Steel, SAIL) limits pricing power and export competitiveness. With borrowings of ₹341 Cr and net debt of ₹329 Cr, the D/E ratio at 0.49x is manageable but not comfortable for a cyclical business. Dividend growth will depend on sustained margin improvement. The AGM on September 24, 2026 will formalise the FY26 dividend. Investors should track steel realisations, input costs, and capex deployment.
Dividend Snapshot – Agarwal Industrial Corporation Limited
Dividend Details
| Company | Agarwal Industrial Corporation Ltd |
| NSE Symbol | AGARIND |
| BSE Code | 532462 |
| ISIN | INE204E01012 |
| Face Value | ₹10 |
| Dividend Type | Final Dividend |
| DPS | ₹3.30 |
| Dividend % | 33% |
Financial Year & Yield
| Financial Year | 2025-26 |
| CMP (Sep 18, 2026) | ₹413.00 |
| Dividend Yield | 0.80% |
| Announcement CMP | ₹419.65 |
| Announcement Yield | 0.79% |
| Payout Ratio | 11.25% |
| Dividend Coverage | 8.83x |
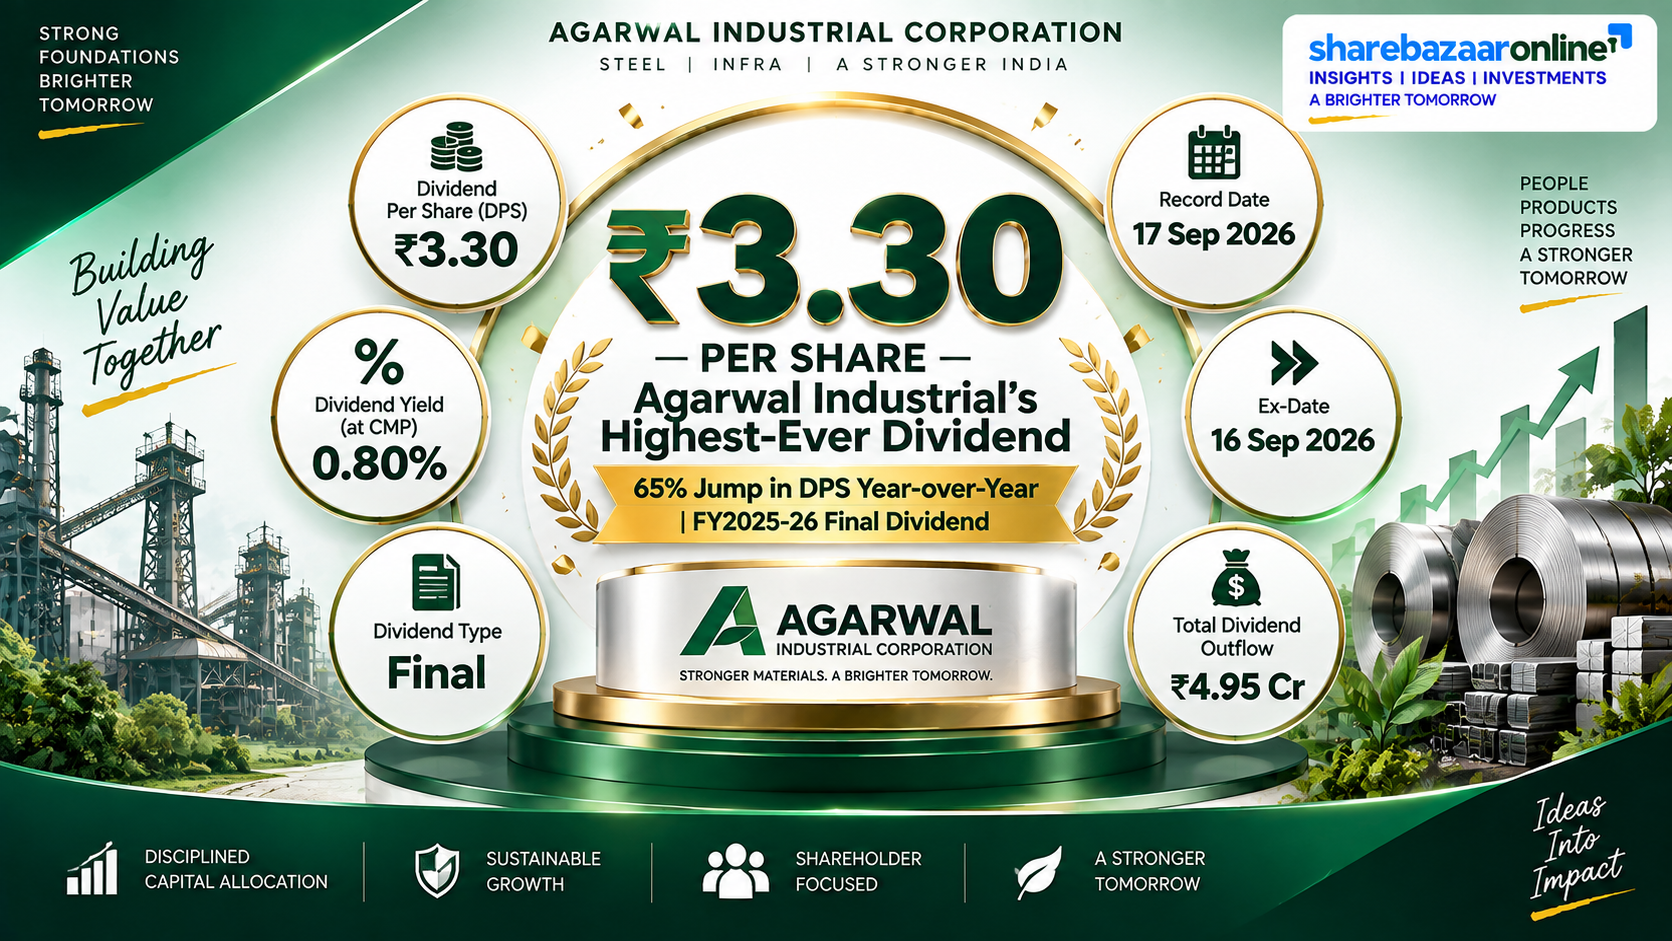
| Total Outflow | ₹4.95 Cr |
Agarwal Industrial Corporation Limited Dividend Announcement Summary
On May 29, 2026, the Board of Directors of Agarwal Industrial Corporation Limited approved a final dividend of ₹3.30 per equity share (33% on face value of ₹10) for the financial year ended March 31, 2026. This is the highest dividend per share the company has ever declared, surpassing the ₹2.80 paid in FY23 and FY24. The dividend is subject to shareholder approval at the Annual General Meeting scheduled for September 24, 2026. The 65% year-over-year increase in DPS (from ₹2.00 in FY25) reflects the near-doubling of consolidated profit to ₹44 Cr. Auditors M/s Singhal Sanklecha & Co LLP issued an unmodified opinion on the financial statements.
Agarwal Industrial Corporation Limited – Key Dates Timeline
Announcement Date
May 29, 2026
Ex-Dividend Date
September 16, 2026 (Inferred via T+1; confirm with BSE/NSE circular)
Record Date
September 17, 2026
AGM Date
September 24, 2026
Payment Date
Not Disclosed by Company
The record date of September 17, 2026 has already passed. Only shareholders who held AGARIND shares in their demat account on the record date were eligible for this dividend. The dividend remains subject to AGM approval on September 24, 2026.
Agarwal Industrial Corporation Limited Dividend Yield Analysis
The Face-Value Illusion
A 33% dividend sounds attractive — until you realise it is 33% of the ₹10 face value, not the ₹413 market price. The actual dividend yield at current market price is just 0.80%. This is lower than a savings bank account (3.0-3.5%) and significantly below the 10-year G-Sec yield (~7.1%). On the announcement date (CMP ₹419.65), the yield was even lower at 0.79%. Investors buying AGARIND purely for income would receive minimal cash return relative to capital deployed.
Yield Reality Check
The low 0.80% yield is not caused by a falling share price inflating dividend percentages — the stock trades near its 52-week range. Rather, the company simply retains most of its earnings. With a payout ratio of only 11.25%, Agarwal Industrial distributes ₹1 out of every ₹9 earned. The dividend coverage ratio of 8.83x confirms this is a deliberate capital-retention strategy, not a sign of financial stress. For yield-seeking investors, this stock is unlikely to meet income objectives.
Agarwal Industrial Corporation Limited Dividend History Analysis
Over the last 10 years, Agarwal Industrial has paid dividends in 9 out of 10 years, with one skip in FY2019-20 during the pandemic. The DPS trajectory shows clear cyclicality: flat at ₹1.50 from FY17 to FY19, a pandemic skip, recovery at ₹1.50 in FY21, followed by a consistent ramp to ₹2.50, ₹2.80, ₹2.80, ₹2.00, and now the record ₹3.30. The dividend CAGR of 9.2% (FY17→FY26) is respectable but masks the single-year skip and the FY25 dip to ₹2.00 when profits fell. Classification: Cyclical Payer — dividends broadly track the steel cycle with a one-year lag. The FY25 cut despite continued profitability shows management adjusts distributions to match earnings quality, not merely earnings existence.
Agarwal Industrial Corporation Limited – Financial Performance Analysis
Revenue & Margins
| Revenue FY26 | ₹1,652 Cr |
| Revenue FY25 | ₹1,521 Cr |
| YoY Growth | 8.6% |
| OPM FY26 | 7.3% |
| OPM FY25 | 5.1% |
| NPM FY26 | 2.7% |
Earnings & EPS
| PAT FY26 | ₹44 Cr |
| PAT FY25 | ₹23 Cr |
| PAT Growth | 91.3% |
| EPS FY26 | ₹29.13 |
| EPS FY25 | ₹15.46 |
| 4Y Rev CAGR | 1.5% |
Operating Leverage Assessment
Revenue rose 8.6% while operating profit jumped 55.8% and PAT surged 91.3%. This classic positive operating leverage indicates that fixed costs remained relatively stable while volumes and realisations improved. However, the thin 2.7% NPM means even small cost increases can swing profitability sharply. A 2-3% rise in input costs without corresponding price hikes could erase most of the PAT gain.
Agarwal Industrial Corporation Limited – Cash Flow Analysis
Cash Flow Metrics (FY26)
| Operating Cash Flow | ₹235 Cr |
| Capital Expenditure | ₹71 Cr |
| Free Cash Flow | ₹164 Cr |
| Dividend Outflow | ₹4.95 Cr |
| OCF Coverage | 47.5x |
| FCF Coverage | 33.1x |
Cash Quality Assessment
This is a standout data point. Operating cash flow of ₹235 Cr is 5.3x the reported PAT of ₹44 Cr. This massive gap typically indicates aggressive depreciation charges and working capital release, meaning the company generates far more cash than its income statement suggests. The dividend at ₹4.95 Cr is less than 3% of free cash flow. The company could comfortably pay a dividend 10x higher and still retain substantial cash. Management is choosing not to, prioritising debt reduction and capacity maintenance.
Agarwal Industrial Corporation Limited – Balance Sheet Strength
| Equity Capital | ₹15 Cr |
| Reserves | ₹674 Cr |
| Total Borrowings | ₹341 Cr |
| Cash & Bank | ₹12 Cr |
| Net Debt | ₹329 Cr |
| Debt-to-Equity | 0.49x |
| Cash + Investments Coverage | 3.43x dividend |
The balance sheet carries moderate leverage. While D/E at 0.49x is within acceptable range for steel companies, net debt of ₹329 Cr against PAT of ₹44 Cr implies a net debt/PAT ratio of ~7.5x, which is elevated. Cash on hand at ₹12 Cr is thin relative to the ₹341 Cr borrowing. However, the strong ₹235 Cr operating cash flow provides comfortable servicing ability.
Agarwal Industrial Corporation Limited – Dividend Sustainability Analysis
Four-Test Sustainability Scorecard
| Test | Metric | Value | Result |
|---|---|---|---|
| Earnings Coverage | EPS / DPS ≥ 1.5x | 8.83x | PASS |
| OCF Coverage | OCF / Outflow ≥ 1.5x | 47.5x | PASS |
| FCF Coverage | FCF / Outflow ≥ 1.0x | 33.1x | PASS |
| Cash Coverage | (Cash + Inv) / Outflow ≥ 1.0x | 3.43x | PASS |
Verdict: SUSTAINABLE (4/4)
All four tests passed with very wide margins. The dividend of ₹4.95 Cr represents a negligible fraction of the company’s cash generation capacity. Even in a downturn scenario where profits halve, the dividend remains easily affordable. The primary risk to dividend continuity is not financial capacity but management discretion — the company skipped in FY20 despite having the means to pay.
Agarwal Industrial Corporation Limited – Peer Comparison
| Company | Yield % | Payout % | ROE % | ROCE % | D/E |
|---|---|---|---|---|---|
| Agarwal Industrial | 0.80% | 11.25% | 6.4% | 8.8% | 0.49x |
| Tata Steel | ~2.5% | ~30% | ~10% | ~12% | ~0.8x |
| JSW Steel | ~0.9% | ~15% | ~14% | ~13% | ~1.0x |
| SAIL | ~3.0% | ~25% | ~5% | ~8% | ~0.6x |
| Sarda Energy | ~1.0% | ~12% | ~12% | ~14% | ~0.3x |
Peer data approximate, sourced from Screener.in and public filings. Exact figures may vary by reporting period.
Agarwal Industrial’s yield and payout ratio are among the lowest in the peer set. Its ROE (6.4%) and ROCE (8.8%) trail larger peers like JSW Steel and Tata Steel, reflecting the scale disadvantage of a mid-cap sponge iron producer. However, its D/E at 0.49x is more conservative than Tata Steel and JSW Steel.
Agarwal Industrial Corporation Limited – Promoter Impact Analysis
Shareholding Pattern
| Promoter & Promoter Group | 57.20% |
| Foreign Institutional Investors | 0.02% |
| Domestic Institutional Investors | 0.25% |
| Public & Others | 42.53% |
Promoter Dividend Income
With 57.20% holding, the promoter group receives ₹2.83 Cr of the ₹4.95 Cr total outflow. Minority shareholders (42.80%) receive the remaining ₹2.12 Cr. The near-zero institutional holding (FII 0.02%, DII 0.25%) is noteworthy — professional investors have largely avoided this stock, suggesting limited visibility and liquidity constraints. The promoter’s majority stake means dividends serve primarily as a mechanism to extract cash from the company to the family holding structure. At ₹2.83 Cr, this is a modest extraction relative to the ₹674 Cr reserves.
Agarwal Industrial Corporation Limited – Taxation Analysis
Indian Dividend Tax Rules
Since FY2020-21, dividends are taxable in the hands of shareholders at their applicable income tax slab rate. The company no longer pays Dividend Distribution Tax (DDT). TDS at 10% is deducted at source if total dividend income from a company exceeds ₹5,000 in a financial year. Shareholders can claim credit for TDS deducted while filing their income tax return.
Worked Example: 1,000 Shares, 30% Tax Slab
| Shares Held | 1,000 |
| Dividend Per Share | ₹3.30 |
| Gross Dividend | ₹3,300 |
| TDS (10%) | Nil (below ₹5,000 threshold) |
| Tax at 30% Slab | ₹990 |
| Net Dividend After Tax | ₹2,310 |
| Effective Post-Tax Yield | 0.56% |
For an investor holding 1,000 shares at CMP of ₹413, the capital deployed is ₹4,13,000. The after-tax dividend income of ₹2,310 translates to an effective yield of just 0.56%. Surcharge and cess not included in this illustration.
Agarwal Industrial Corporation Limited – Capital Allocation Analysis
With ₹164 Cr in free cash flow and only ₹4.95 Cr paid as dividends, the company retained ₹159 Cr in FY26. This retained capital could have been deployed more productively:
Debt Reduction: ₹159 Cr could reduce borrowings from ₹341 Cr to ₹182 Cr, nearly halving the D/E ratio to ~0.26x and saving approximately ₹15-16 Cr in annual interest costs.
Higher Dividend: Paying ₹15 per share (instead of ₹3.30) would still consume only ₹22.5 Cr — well within FCF — and raise yield to ~3.6%.
Buyback: At ₹413 CMP and ~14x P/E, a buyback could be value-accretive for remaining shareholders.
The current allocation prioritises balance sheet strengthening over shareholder returns — defensible for a cyclical business, but not rewarding for income-oriented investors.
Agarwal Industrial Corporation Limited – Key Risks
Steel Price Cyclicality: Domestic steel prices are volatile and directly impact revenue realisations. A 10% drop in TMT bar prices could erase most of the PAT, turning the payout ratio from comfortable to strained.
Raw Material Cost Inflation: Iron ore and coal prices remain subject to global supply disruptions. Captive mines provide partial insulation, but power costs and coking coal remain market-linked.
Thin Net Margins: NPM at 2.7% leaves negligible room for cost absorption. Even minor operational disruptions (plant shutdowns, logistics delays) can push quarterly results into losses.
Concentrated Geography: Operations are largely in Chhattisgarh, creating regulatory and logistical concentration risk. Any state-level policy change on mining or power tariffs could disproportionately impact the company.
Near-Zero Institutional Interest: FII (0.02%) and DII (0.25%) holding suggests professional investors see governance, liquidity, or growth concerns. This limits share price discovery and could impact liquidity during market stress.
Promoter Dominance: With 57.20% holding and negligible institutional check, minority shareholders have limited influence on capital allocation, related-party transactions, or dividend policy.
Agarwal Industrial Corporation Limited – What To Monitor
Quarterly Steel Realisations: Track TMT bar and billet prices versus input costs to gauge margin sustainability in upcoming quarters.
Debt Trajectory: Monitor whether the company uses its strong FCF to reduce the ₹341 Cr borrowing or adds further capacity-linked debt.
Capex Announcements: Any expansion into new product lines or geographies would signal growth intent but could compress near-term dividends.
Promoter Holding Changes: Any pledge, sale, or dilution of the 57.20% promoter stake would be a significant governance signal.
AGM Outcome (Sep 24, 2026): Confirmation of the ₹3.30 dividend and any announcements on future capex or dividend policy.
Iron Ore Mining Lease Renewals: Captive mine leases are critical to cost competitiveness. Any renewal challenges or royalty changes would impact fundamentals.
Conclusion – Agarwal Industrial Corporation Limited Dividend
Agarwal Industrial Corporation Limited’s ₹3.30 final dividend for FY2025-26 is its highest-ever payout, reflecting a strong earnings recovery year where PAT nearly doubled. However, the headline 33% dividend on face value translates to a market yield of just 0.80% — well below savings account rates. The dividend is unquestionably sustainable (4/4 on our scorecard), backed by ₹235 Cr operating cash flow against a ₹4.95 Cr outflow. The real story is what the company does not distribute: with an 11.25% payout ratio, nearly 89% of earnings are retained. For capital appreciation investors in the steel cycle, this retention may compound value. For income investors, the yield after 30% tax drops to 0.56% — making AGARIND unsuitable as a dividend income stock. The key question remains whether management will gradually increase the payout ratio as the balance sheet strengthens, or continue prioritising debt reduction and capacity maintenance.
Frequently Asked Questions – Agarwal Industrial Corporation Limited Dividend
What dividend has Agarwal Industrial Corporation Limited announced for FY2025-26?
What is the dividend yield of AGARIND at current market price?
What is the record date for Agarwal Industrial Corporation dividend?
What is the ex-dividend date for AGARIND?
When will Agarwal Industrial Corporation Limited pay the dividend?
Who is eligible for the Agarwal Industrial FY26 dividend?
How is the AGARIND dividend taxed in India?
Is the Agarwal Industrial Corporation dividend sustainable?
What is the dividend history of Agarwal Industrial Corporation?
What should investors monitor after this dividend announcement?
Why is the dividend yield of AGARIND so low despite a 33% dividend?
What is the dividend payout ratio of Agarwal Industrial Corporation?
Disclaimer
Disclaimer: This article is published by ShareBazaar Online for educational and informational purposes only. It does not constitute investment advice, a buy/sell/hold recommendation, or a solicitation to trade in any security. All data has been sourced from publicly available company filings, BSE/NSE disclosures, and third-party financial databases. While every effort has been made to ensure accuracy, ShareBazaar Online does not guarantee the completeness or correctness of the information. Investors should consult a SEBI-registered financial advisor before making investment decisions. Past dividend payments do not guarantee future payouts. Market investments are subject to risks. Read all scheme-related documents carefully. ShareBazaar Online and its contributors may or may not hold positions in the securities discussed.