
Dividend Snapshot – Ircon International Limited
Ircon International Limited (NSE: IRCON, BSE: 541956), a Navratna railway and infrastructure EPC company owned by the Government of India, has recommended a final dividend of Rs 0.70 per equity share (35% of the face value of Rs 2) for the financial year 2025-26. The recommendation was made by the Board of Directors at its meeting on 22 May 2026 and is subject to shareholder approval at the Annual General Meeting. With an interim dividend of Rs 1.20 already paid, the total FY26 dividend works out to Rs 1.90 per share.
Final Dividend
Rs 0.70 / share (35%)
Face value Rs 2 per share
Total FY26 Dividend
Rs 1.90 / share
Interim Rs 1.20 + Final Rs 0.70
Dividend Yield (Final, on CMP)
~0.59%
~1.60% on full-year Rs 1.90
Record Date & Ex-Date
17 Sep 2026
Payment on or before 24 Oct 2026
The headline you should not misread: a "35%" dividend sounds large, but that 35% is calculated on the Rs 2 face value, not on the market price. At a market price of about Rs 119, the final dividend of Rs 0.70 is a real cash yield of only about 0.59%. This gap between the percentage-of-face-value headline and the actual market yield is the single most important thing for a retail investor to understand about the Ircon International Limited dividend.
Ircon International Limited Dividend Announcement Summary
In its filing to BSE and NSE under Regulation 30 of SEBI (LODR) Regulations, Ircon International Limited disclosed the outcome of its Board meeting held on Friday, 22 May 2026. Alongside the audited standalone and consolidated results for the quarter and year ended 31 March 2026, the Board recommended a final dividend of Rs 0.70 per equity share of face value Rs 2 each (35% of paid-up equity share capital) for FY 2025-26.
The filing explicitly notes this final dividend is in addition to the interim dividend of Rs 1.20 per share that was approved at the Board meeting on 11 February 2026 and subsequently paid. The final dividend is subject to shareholder approval at the ensuing AGM, and the company has stated it "would be paid within 30 days from the date of its declaration at the AGM."
Company & Security Identifiers
- Company: Ircon International Limited
- NSE Symbol: IRCON
- BSE Code: 541956
- ISIN: INE962Y01021
- Status: Navratna, Govt. of India undertaking
- CIN: L45203DL1976GOI008171
Dividend Particulars
- Type: Final Dividend (FY 2025-26)
- Amount: Rs 0.70 per share
- Percentage: 35% of face value
- Face Value: Rs 2 per share
- Shares Outstanding: 94.05 crore
- Est. Final Outflow: Rs 65.83 crore
Ircon International Limited Dividend Record Date and Ex-Dividend Date
Announcement Date
22 May 2026
Board recommends final dividend
Record Date
17 September 2026
Shareholders on register are eligible
Ex-Dividend Date
17 September 2026
Buy before this date to qualify
Payment Date
On or before 24 October 2026
Within 30 days of AGM approval
To be eligible for the Ircon International Limited final dividend, an investor needed to hold shares as on the record date of 17 September 2026. Under India's T+1 settlement cycle, the ex-dividend date and record date fall on the same day for this payout. From the ex-date, the share price typically adjusts downward by roughly the dividend amount, so a buyer on or after the ex-date does not receive this dividend. The AGM for FY 2025-26 was held on 24 September 2026, with payment scheduled by 24 October 2026.
Ircon International Limited Dividend Yield
Dividend yield is the real return a shareholder earns in cash, calculated as dividend per share divided by the market price. It is very different from the "35%" headline, which is only the dividend as a percentage of the Rs 2 face value. Here is how the Ircon International Limited dividend yield looks on both the current market price and the price around the announcement.
| Ircon International Limited – Yield Basis | Dividend | Reference Price | Yield |
|---|---|---|---|
| Final dividend on current price | Rs 0.70 | ~Rs 119 (CMP, Sep 2026) | ~0.59% |
| Full-year FY26 on current price | Rs 1.90 | ~Rs 119 (CMP, Sep 2026) | ~1.60% |
| Final dividend on announcement price | Rs 0.70 | ~Rs 150 (approx, 22 May 2026) | ~0.47% |
| Full-year FY26 on announcement price | Rs 1.90 | ~Rs 150 (approx, 22 May 2026) | ~1.27% |
Reading the yield honestly: the full-year FY26 yield of about 1.60% is higher than the roughly 1.27% it would have been at the May price. That improvement is not because Ircon International Limited raised its dividend — in fact the total FY26 dividend of Rs 1.90 is lower than FY25's Rs 2.65. The apparent yield rose mainly because the share price fell about 20-30% over the year. A yield that rises because the price is falling is a warning to investigate the business, not automatically a bargain. CMP and announcement-date price are market data (sourced from NSE/BSE feeds); the 22 May price is approximate and should be confirmed against the exchange close at publish.
Ircon International Limited Dividend History
Ircon International Limited has a long record of paying dividends, usually twice a year (an interim plus a final). The table below shows the per-share dividends on the current Rs 2 face value for recent years. Note that the company issued bonus shares and its face value history means pre-2019 percentages (quoted on an earlier face value) are not directly comparable, so the focus here is on the comparable recent period.
| Financial Year | Interim | Final | Total (Rs/share) | Trend |
|---|---|---|---|---|
| FY 2025-26 | Rs 1.20 | Rs 0.70 | Rs 1.90 | Down |
| FY 2024-25 | Rs 1.65 | Rs 1.00 | Rs 2.65 | Down |
| FY 2023-24 | Rs 1.80 | Rs 1.30 | Rs 3.10 | Up |
| FY 2022-23 | Rs 1.80 | Rs 1.20 | Rs 3.00 | Up |
| FY 2021-22 | Rs 1.15 (multiple) | Rs 0.65 | Rs 1.80 | Base |
Dividend history compiled from public exchange and dividend records; FY22 interim reflects multiple interim tranches on the Rs 2 face value. FY26 interim of Rs 1.20 (11 Feb 2026) and final of Rs 0.70 (22 May 2026) are per the company filing.
What the pattern shows
Ircon International Limited is a consistent payer — it has not skipped a dividend in recent years. However, the total payout has declined for two consecutive years: from Rs 3.10 in FY24 to Rs 2.65 in FY25 and now Rs 1.90 in FY26. That is a cumulative fall of about 39% over two years, tracking the decline in profits.
Classification
On consistency of frequency, Ircon International Limited is a reliable, twice-a-year dividend payer. On the trajectory of the amount, it is currently in a declining-payout phase that mirrors falling revenue and earnings. Investors seeking dividend growth should note the direction, not just the fact of payment.
Ircon International Limited Financial Performance Analysis
A dividend is only as strong as the earnings behind it. The FY26 audited results show a clear slowdown at Ircon International Limited, on both a consolidated and standalone basis. All figures below are from the company's own filing (Rs in crore).
| Consolidated (Rs cr) | FY 2025-26 | FY 2024-25 | Change |
|---|---|---|---|
| Revenue from operations | 9,071.05 | 10,759.58 | −15.7% |
| Profit before tax | 766.50 | 939.02 | −18.4% |
| Net profit (owners of parent) | 595.47 | 727.41 | −18.1% |
| Basic EPS (Rs) | 6.33 | 7.73 | −18.1% |
| Standalone (Rs cr) | FY 2025-26 | FY 2024-25 | Change |
|---|---|---|---|
| Revenue from operations | 8,478.86 | 10,193.14 | −16.8% |
| Net profit after tax | 618.45 | 737.59 | −16.2% |
| Basic EPS (Rs) | 6.58 | 7.84 | −16.1% |
Operating leverage: why profit fell faster than revenue
Consolidated revenue fell 15.7% but net profit fell a steeper 18.1%. The gap points to margin pressure: as railway and highway execution slowed, fixed and semi-fixed costs did not fall as quickly as revenue. Consolidated finance costs actually rose to Rs 97.34 crore (from Rs 219.13 crore in FY25 they eased, but remain a drag at the group level given higher group borrowings), and lower-margin work weighed on the mix. Standalone (the parent EPC business) held up marginally better than the consolidated group, which includes joint ventures and subsidiaries. The core takeaway for a dividend investor: the earnings base funding the dividend is shrinking, not growing.
Ircon International Limited Cash Flow Analysis
Reported profit is an accounting opinion; cash is a fact. This is where the Ircon International Limited dividend story gets genuinely important, and where most reports stop short. On a consolidated basis, the company reported a healthy profit but burned cash from operations.
Consolidated Operating Cash Flow (FY26)
Rs −617.58 cr
Against net profit of Rs 595.47 cr
Standalone Operating Cash Flow (FY26)
Rs +77.10 cr
Positive but thin vs Rs 618.45 cr profit
Profit is positive, but operating cash is negative — why?
At the consolidated level, working capital swung heavily against the company: a net working-capital drag of roughly Rs 975 crore, driven mainly by a large increase in loans and other financial assets (about Rs 1,163 crore) and higher receivables (about Rs 70 crore). This is characteristic of EPC and railway construction — money gets locked up in project execution, retention, and JV funding before it is billed and collected. The result is that despite a Rs 595 crore accounting profit, the group's operations consumed Rs 617.58 crore of cash in FY26.
So how was the dividend funded?
During FY26 the group actually paid Rs 206.91 crore in dividends (Rs 94.05 crore final for FY25 + Rs 112.86 crore FY26 interim). With operations consuming cash, the group's financing activities brought in a net Rs 801.22 crore, including Rs 2,114.37 crore of fresh borrowings (against Rs 784.07 crore repaid). In plain terms: the dividend and the cash gap were bridged largely by borrowing, not by internally generated free cash. Standalone free cash flow was only about Rs 17 crore, far short of the Rs 178.7 crore total FY26 dividend, and consolidated free cash flow was deeply negative at roughly Rs −1,151 crore. This is the most significant caution in the entire Ircon International Limited dividend picture.
Ircon International Limited Balance Sheet Strength
The negative operating cash flow is cushioned by a strong balance sheet at the parent level, but the consolidated group carries meaningful debt. Both pictures matter for judging whether the dividend can continue.
Liquidity (Consolidated, 31 Mar 2026)
- Cash & cash equivalents: Rs 2,190.35 cr
- Other bank balances: Rs 2,619.00 cr
- Current investments: Rs 366.87 cr
- Of which restricted (clients' fund): Rs 1,165.24 cr
Cash comfortably covers the Rs 178.7 cr FY26 dividend (about 12x on reported C&CE, about 5.7x after stripping restricted clients' funds).
Debt (Consolidated, 31 Mar 2026)
- Non-current borrowings: Rs 5,423.21 cr
- Current borrowings: Rs 240.42 cr
- Lease liabilities: Rs 62.00 cr
- Net debt (of C&CE): about Rs 3,535 cr
Group borrowings rose from Rs 4,134.64 cr (FY25) as the group funded working capital and investments.
The standalone vs consolidated distinction matters
The standalone parent — the entity that actually declares and pays the dividend — is effectively near debt-free, with only Rs 103 crore of current borrowings and a small lease liability, against standalone cash and equivalents of Rs 2,020.36 crore and non-current investments of Rs 2,800.56 crore. Most of the Rs 5,423 crore of borrowings sits in subsidiaries and project SPVs at the consolidated level. So the dividend itself is not immediately at risk from group debt — the parent has ample cash — but the group's rising leverage and negative consolidated cash generation are the reasons the payout has been trimmed rather than grown. Total equity attributable to owners stands at Rs 6,638.64 crore (consolidated), giving a return on equity of about 9.0% and an approximate ROCE of about 7.0%.
Ircon International Limited Dividend Sustainability
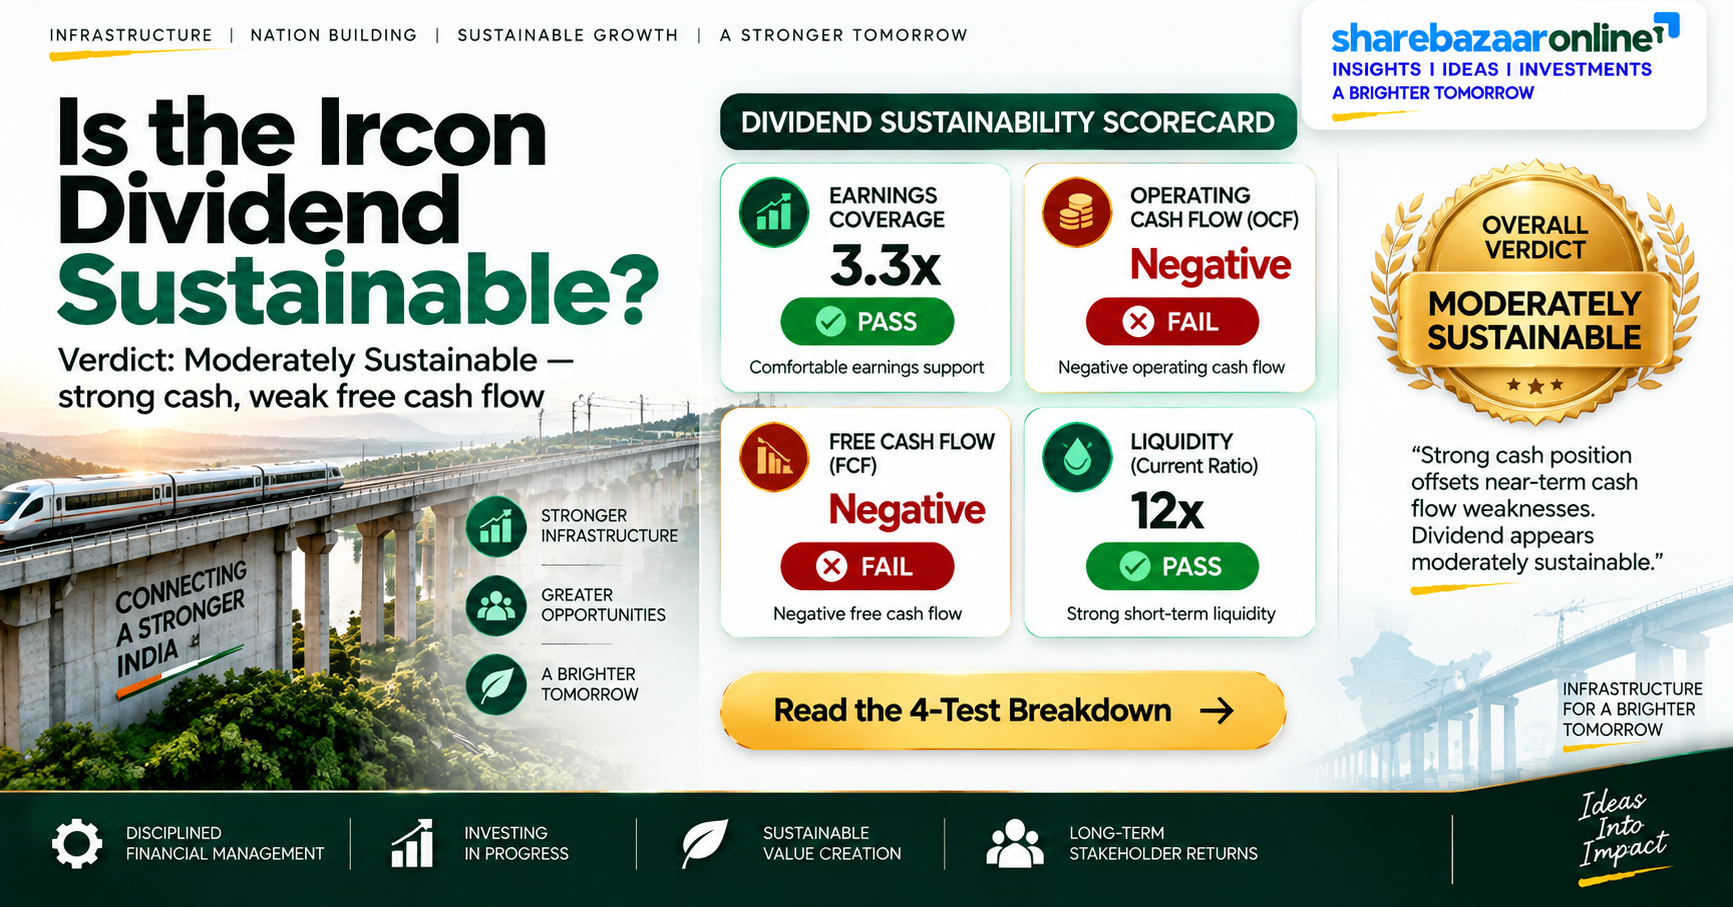
Bringing the four tests together — earnings coverage, operating cash flow, free cash flow, and liquidity — gives a balanced verdict on whether the Ircon International Limited dividend can be maintained.
Test 1 — Earnings coverage: PASS
FY26 total dividend of Rs 1.90 is covered 3.3x by consolidated EPS of Rs 6.33 (payout about 30%). This is conservative and leaves room for reinvestment.
Test 2 — Operating cash flow: FAIL (consolidated)
Consolidated operations consumed Rs 617.58 crore of cash. The dividend was not funded by group operating cash this year. Standalone OCF was only mildly positive at Rs 77.10 crore.
Test 3 — Free cash flow: FAIL
Consolidated FCF was about Rs −1,151 crore and standalone FCF only about Rs 17 crore — well below the Rs 178.7 crore paid out. The gap was bridged by borrowing.
Test 4 — Liquidity: PASS
Cash and equivalents of Rs 2,190 crore cover the dividend many times over, and the parent is near debt-free. Near-term ability to pay is not in doubt.
Verdict: Moderately Sustainable
The Ircon International Limited dividend is well-covered by earnings and comfortably backed by cash reserves, so there is no immediate threat to the payout. But it is not currently funded by free cash flow — the group is generating negative operating cash and leaning on borrowings, which is precisely why management has cut the payout for two straight years. The dividend is safe in the short term on the strength of the balance sheet; its growth depends on a recovery in order execution and a reversal of the working-capital drain. We classify it as Moderately Sustainable.
Ircon International Limited Peer Comparison
Against other railway and infrastructure PSUs, Ircon International Limited is a middle-of-the-pack dividend payer. The peer figures below are indicative market estimates and should be verified against the latest exchange data at publication; Ircon's own numbers are from its FY26 filing.
| Company | Approx. Dividend Yield | FY26 Payout (Ircon) | Profile |
|---|---|---|---|
| Ircon International Ltd | ~1.6% | ~30% | Rail/highway EPC, near debt-free parent |
| RITES Ltd | ~3.5% (indicative) | — | Consulting, higher payout, cash-rich |
| Engineers India Ltd | ~2.5% (indicative) | — | Hydrocarbon consultancy PSU |
| NBCC (India) Ltd | ~1.0% (indicative) | — | Real-estate/PMC PSU |
| RVNL Ltd | ~0.5% (indicative) | — | Rail infra, growth-focused, low payout |
Peer yields are approximate market estimates for context only, not from company filings — confirm at publish. "Not Disclosed by Company" applies to peer payout/ROE detail not in the Ircon filing.
Ircon International Limited sits below dedicated dividend PSUs like RITES and Engineers India on yield, but above growth-oriented names like RVNL that retain most earnings. Its roughly 30% payout is moderate, prioritising a strong balance sheet over a high headline yield — a reasonable stance given its negative consolidated operating cash flow this year.
Ircon International Limited Promoter Impact Analysis
Ircon International Limited is majority-owned by the Government of India. The shareholding pattern (as of the June 2026 quarter) is approximately 65.17% promoter (Government of India), about 4.32% FIIs, about 1.79% DIIs, and the balance with public shareholders. This concentration means most of the dividend flows straight to the government exchequer.
Govt (Promoter) FY26 Dividend Income
~Rs 116.5 cr
65.17% of Rs 178.7 cr total FY26 outflow
Public Shareholders FY26 Share
~Rs 62.2 cr
34.83% of total FY26 outflow
Of the FY26 final dividend alone (Rs 65.83 crore total), roughly Rs 42.9 crore goes to the Government of India. For minority investors, the alignment is generally favourable — the government, as majority owner, has a standing interest in regular dividends from its PSUs to support fiscal receipts, which supports dividend continuity. The flip side is that dividend policy can be influenced by government cash needs rather than purely by the company's reinvestment opportunities. The high promoter holding also caps free float, which can affect share liquidity and price behaviour around the ex-date.
Ircon International Limited Dividend Taxation
Since April 2020, dividends in India are taxed in the hands of the investor at their applicable income-tax slab rate — the old Dividend Distribution Tax is gone. Understanding this is essential to know your real, post-tax return from the Ircon International Limited dividend.
The rules in brief
- Dividend is added to your total income and taxed at your slab rate.
- TDS at 10% applies if total dividend from a company in a year exceeds Rs 5,000 (20% if PAN is not provided).
- For most retail holdings of Ircon International Limited, the Rs 5,000 threshold is not crossed, so no TDS is deducted — but the dividend is still taxable.
- You can claim credit for any TDS when filing your return.
Worked example — 1,000 shares, 30% slab
- Shares held: 1,000
- FY26 dividend: Rs 1.90/share → Gross = Rs 1,900
- TDS (below Rs 5,000): Rs 0
- Tax at 31.2% (30% + 4% cess): Rs 592.80
- Net dividend in hand: Rs 1,307.20
- Effective post-tax yield (on ~Rs 119): ~1.10%
For a larger holder crossing the Rs 5,000 mark — say a dividend of Rs 10,000 — TDS of Rs 1,000 would be deducted upfront, tax at a 30% slab (with cess) would be Rs 3,120, leaving Rs 6,880 net. The practical lesson: a headline "35% dividend" translates, for a top-slab investor, into a real post-tax cash yield of roughly 1.1% at the current price. Tax outcomes vary by individual slab; this is illustrative, not tax advice.
Key Risks for Ircon International Limited Dividend Investors
1. Declining revenue and profit. Consolidated revenue fell 15.7% and net profit 18.1% in FY26. A shrinking earnings base has already forced two consecutive years of dividend cuts, from Rs 3.10 (FY24) to Rs 1.90 (FY26).
2. Negative operating cash flow. Consolidated operations consumed Rs 617.58 crore of cash in FY26. If the working-capital drain persists, dividends will keep depending on reserves and borrowings rather than genuine cash generation.
3. Rising group debt. Consolidated borrowings climbed to Rs 5,423 crore. Servicing higher debt competes with dividends for cash and can constrain future payouts.
4. Order-book and execution concentration. As a rail-centric PSU, Ircon International Limited depends heavily on Ministry of Railways and government capex cycles. Slippage in order inflow or execution directly hits revenue and, in turn, dividends.
5. Low real yield with price risk. The current cash yield of about 1.6% is modest, and the stock has fallen 20-30% over the past year. Investors buying purely for dividend income get limited yield while carrying meaningful price volatility.
6. Government-driven policy. As a majority government holding, dividend and capital-allocation decisions can be shaped by the promoter's fiscal needs rather than the company's own reinvestment case.
What to Monitor in Ircon International Limited
1. Order book and new order inflow. Track quarterly order-book value and fresh wins, especially from Railways, highways, and international projects. A recovering order book is the clearest leading indicator for a dividend rebound.
2. Operating cash flow trend. Watch whether consolidated OCF turns positive in FY27. Sustained cash generation is what would move the dividend from "Moderately Sustainable" to comfortably funded.
3. Working capital and receivables. Monitor receivable days and the loans/other-financial-assets line that drove the FY26 cash drain. Improvement here frees cash for dividends.
4. Consolidated debt levels. Keep an eye on group borrowings and net debt. Rising leverage alongside flat earnings would pressure future payouts.
5. Margins and execution pace. Follow EBITDA margin and revenue recognition quarter on quarter to see whether the FY26 slowdown is stabilising or deepening.
6. Dividend payout policy. Note any change in the company's stated payout approach or DIPAM guidance, which would signal the direction of future dividends.
Should You Consider Ircon International Limited for Dividend Income?
The Ircon International Limited FY26 final dividend of Rs 0.70 per share takes the full-year payout to Rs 1.90, a real cash yield of about 1.6% at the current price. Here is the balanced picture, so you can decide for yourself.
Positives
- Consistent twice-a-year payer with a long dividend record
- Conservative ~30% payout, covered 3.3x by earnings
- Near debt-free parent with Rs 2,020 cr standalone cash
- Navratna PSU with government backing and steady order pipeline
- Cash reserves cover the dividend many times over
Negatives
- Dividend cut for two straight years (Rs 3.10 → Rs 1.90)
- Consolidated operating cash flow negative (Rs −617.58 cr)
- Dividend effectively bridged by borrowings this year
- Revenue and profit both down 15-18%
- Modest ~1.6% yield with a stock down 20-30% in a year
Bottom line: Ircon International Limited remains a dependable dividend payer with a fortress-like parent balance sheet, but it is in a declining-payout, declining-earnings phase, and this year's dividend was not funded by free cash flow. It suits investors who value payout consistency and government backing, but pure income-seekers will find the ~1.6% yield modest, and growth in the dividend hinges on an earnings and cash-flow recovery. Weigh the positives, negatives, risks, and monitoring factors above against your own goals.
Frequently Asked Questions About Ircon International Limited Dividend
What dividend has Ircon International Limited announced for FY26?
What is the dividend yield of Ircon International Limited?
What is the record date for the Ircon International Limited dividend?
What is the ex-dividend date for Ircon International Limited?
When will Ircon International Limited pay the dividend?
Who is eligible for the Ircon International Limited dividend?
How is the Ircon International Limited dividend taxed?
Is the Ircon International Limited dividend sustainable?
What is the dividend history of Ircon International Limited?
How much dividend outflow does the FY26 payout represent?
What should investors monitor in Ircon International Limited?
Why did the Ircon International Limited dividend fall compared to last year?
Disclaimer – Ircon International Limited Dividend Analysis
This article is for informational and educational purposes only and does not constitute investment, financial, or tax advice, nor a recommendation to buy, sell, or hold any security. Figures for the dividend, financial results, and balance sheet are taken from Ircon International Limited's regulatory filing dated 22 May 2026; market price, dividend history, shareholding, and peer data are drawn from public sources and market feeds and may change — the announcement-date price and peer yields in particular are approximate and should be verified against exchange data. Yields, payout, coverage, and outflow figures are computed by ShareBazaar Online. Dividends are subject to shareholder and AGM approval and may vary. Investors should conduct their own due diligence and consult a SEBI-registered financial adviser before making any investment decision. ShareBazaar Online does not accept liability for actions taken based on this content.