
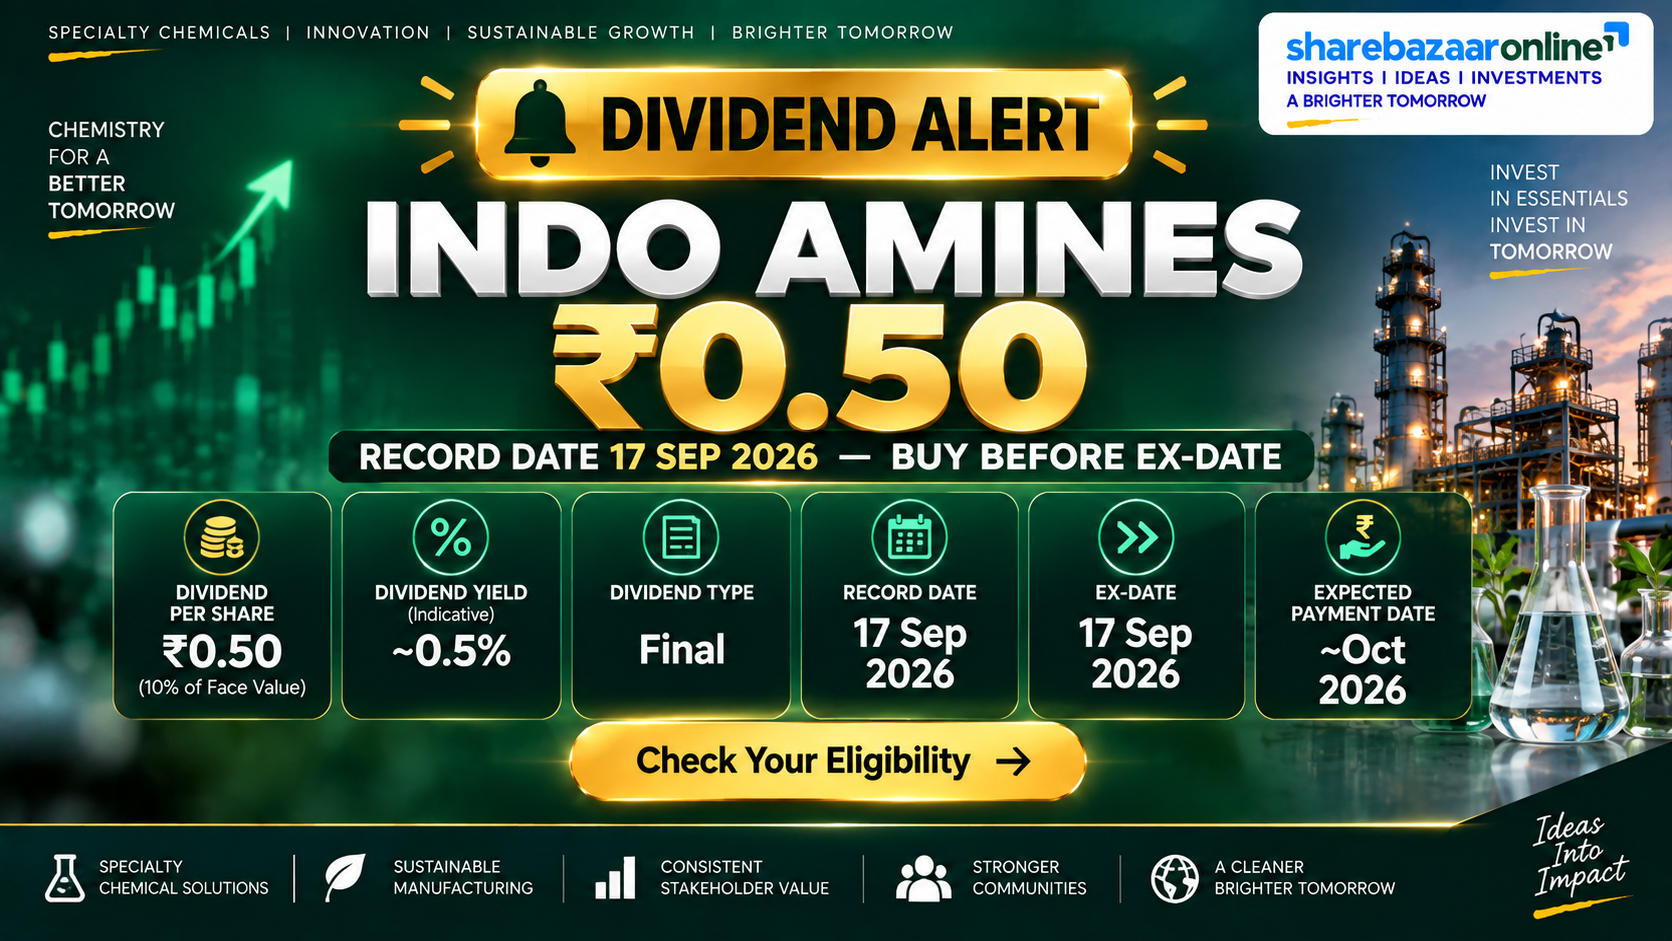
Dividend Snapshot – Indo Amines Limited
Dividend Per Share
₹0.50
Final Dividend · 10% of ₹5 face value
Dividend Yield (approx.)
~0.38%
At CMP ~₹130 (recent sessions)
Record Date
17 Sep 2026
Book closure: 17–24 Sep 2026
Payment Date
Not Disclosed by Company
Statutorily within 30 days of AGM approval
Total Outflow
₹3.63 Cr
Payout Ratio
~4.6%
Dividend Cover
19.3x
Financial Year
FY2025–26
Sources: Company BSE/NSE filing (2 Sep 2026); Screener, Tickertape, ValueResearch (Aug 2026). CMP and yield vary with market price.
Indo Amines Limited Dividend Announcement Summary
The Board of Directors of Indo Amines Limited, at its meeting on 26 May 2026, recommended a final dividend of ₹0.50 per equity share (10%) on shares of face value ₹5 each, for the year ended 31 March 2026. Because this is a final dividend, it must be approved by shareholders at the 33rd AGM before it can be paid.
Company & Security Details
- Company: Indo Amines Limited
- NSE Symbol: INDOAMIN
- BSE Code: 524648
- ISIN: INE760F01028
- Face Value: ₹5 per share
- Sector: Specialty Chemicals (Small/Micro-cap)
Dividend Details
- Type: Final Dividend
- Amount: ₹0.50 per share (10%)
- Interim Dividend: Not Disclosed (none for FY26)
- Special Dividend: Not Disclosed (none)
- Board Recommendation Date: 26 May 2026
- AGM Approval Required: Yes (33rd AGM)
Source: Indo Amines Limited intimation to NSE & BSE dated 2 September 2026; board outcome dated 26 May 2026.
Indo Amines Limited Dividend Record Date and Ex-Dividend Date
Board Recommendation — Directors recommend ₹0.50/share final dividend alongside FY26 audited results.
Record Date / Ex-Date — Shareholders on the register on this date are eligible. Under India's T+1 settlement, the ex-dividend date effectively aligns with the record date, so you must own shares before this day.
Book Closure — Register of Members and Share Transfer Books remain closed (both days inclusive) for the AGM and dividend.
33rd AGM — Shareholders vote to approve the final dividend.
Payment Date — Not Disclosed by Company. Legally, a final dividend must be paid within 30 days of AGM approval. For reference, last year's dividend (record date 17 Sep 2025) was paid on 23 Oct 2025.
Source: Company filing (record date & book closure); historical payment date from TipRanks dividend history.
Indo Amines Limited Dividend Yield
Yield at Current Price
₹0.50 ÷ ~₹130 (recent CMP) × 100 = ~0.38%
A ₹1,00,000 holding would generate roughly ₹380 a year in dividend income before tax.
Yield at Announcement Price
₹0.50 ÷ ~₹141 (26 May 2026 price) × 100 = ~0.35%
The yield has stayed low because the payout is small relative to the share price, not because of price weakness.
Yield Reality Check
Indo Amines is not a high-yield stock. Its yield of ~0.38% sits far below the Basic Materials sector average of roughly 1.65%. This is a deliberate low-payout, growth-and-debt-reduction posture rather than a yield play — the company retains almost all of its earnings. Investors buying primarily for dividend income will find the payout token; the investment case rests on earnings growth, not distribution.
Source: Screener/Tickertape (yield), TipRanks (sector average yield ~1.65%). CMP-dependent; verify at purchase.
Indo Amines Limited Dividend History
Indo Amines Limited — Dividend Payment History
| Financial Year | Dividend / Share | % of Face Value | Record / Ex-Date |
|---|---|---|---|
| FY2025–26 | ₹0.50 | 10% | 17 Sep 2026 |
| FY2024–25 | ₹0.50 | 10% | 17 Sep 2025 |
| FY2023–24 | ₹0.50 | 10% | 17 Sep 2024 |
| FY2022–23 | ₹0.50 | 10% | 20 Sep 2023 |
| FY2021–22 | ₹0.50 | 10% | 02 Sep 2022 |
| FY2014–15 (ref.) | ₹0.25 | 5% | — |
Source: TipRanks dividend history; Simply Wall St (long-run growth). Older years illustrative.
Consistency
Indo Amines has paid ₹0.50 per share every year since at least FY2022 with no cuts or suspensions — a stable, predictable record.
Growth Trend
The dividend rose from ₹0.25 (2015) to ₹0.50, a compound growth of roughly 7.2% a year over that period — but it has been flat at ₹0.50 for several years even as profits multiplied.
Classification: Consistent Payer. The company reliably pays a small, fixed dividend. However, the payout has not grown with earnings — profit jumped ~42% in FY26 while the dividend stayed unchanged, so this is a token-dividend, high-retention profile.
Indo Amines Limited Dividend vs Profit Growth
Indo Amines Limited — Financial Performance (Consolidated)
| Metric | FY2024–25 | FY2025–26 | Growth |
|---|---|---|---|
| Net Profit (PAT) | ₹55.90 Cr | ₹79.33 Cr | +41.9% |
| Revenue (approx.) | ~₹1,010 Cr | ~₹1,160 Cr | ~+15% |
| Q4 PAT | ₹11.85 Cr | ₹20.51 Cr | +73.1% |
| EPS (TTM) | — | ₹9.66 | — |
| Dividend / Share | ₹0.50 | ₹0.50 | 0% |
Source: Tickertape, Screener, HDFC Securities (Aug 2026). Revenue figures approximate/consolidated.
Operating Leverage Read
FY26 was a strong year: revenue grew ~15% but net profit grew ~42%, showing positive operating leverage — margins expanded as chemical realisations and utilisation improved. The Q4 surge (PAT +73%) drove the beat. Yet the dividend was held flat at ₹0.50, so none of this profit growth reached shareholders as higher cash income; it was retained for the balance sheet and growth.
Indo Amines Limited Cash Flow Analysis
⚠ Key Finding: Profits Are Strong, Free Cash Flow Is Not
This is the most important nuance for dividend investors. Reported profit is healthy (₹79.3 Cr), but multiple third-party analyses flag that Indo Amines is paying its dividend despite weak-to-negative free cash flow (FCF). Its Price-to-FCF reads negative, indicating that after capex, the business has not been generating surplus cash.
Why the Gap?
A growing specialty-chemical business ties up cash in working capital (inventory + receivables) and capex. Profit can rise while operating cash lags because sales are booked before cash is collected and plants absorb investment.
How Is the Dividend Funded?
Because the payout is tiny (₹3.63 Cr) versus profit (₹79.3 Cr), it is comfortably covered by current earnings and internal accruals, not by surplus FCF. The concern is directional, not immediate: the company is distributing while carrying meaningful debt.
Free Cash Flow / Operating Cash Flow (exact figures): Not Disclosed by Company in this intimation; latest annual cash-flow statement should be reviewed directly. Third-party trackers report FCF as weak/negative for the trailing period.
Source: Simply Wall St, TipRanks (FCF/Price-to-FCF). Verify against the FY26 annual report cash-flow statement.
Indo Amines Limited Balance Sheet Strength
Total Debt
~₹307 Cr
Debt / Equity
~85%
Cash & Invest.
~₹22 Cr
Interest Cover
~4.8x
What the Balance Sheet Says
Indo Amines carries total debt of ~₹307 Cr against equity of ~₹361 Cr, a debt-to-equity of roughly 85% — high for a small-cap. Interest is covered about 4.8 times by operating earnings, which is adequate but leaves less cushion than a debt-light peer. Cash on hand (~₹22 Cr) still covers the ₹3.63 Cr dividend more than 6 times over, so the payout itself is not a balance-sheet risk. The bigger question is whether cash is better used to cut debt than to distribute — though at this payout size the trade-off is minor.
Source: Simply Wall St financial health (debt ₹3.07b, equity ₹3.61b, cash ₹223.97m, interest cover 4.8x), Aug 2026.
Indo Amines Limited Dividend Sustainability
Coverage Metrics
- Earnings cover: 19.3x (EPS ₹9.66 ÷ ₹0.50)
- Payout ratio: ~4.6% of profit
- Cash cover: ~6.2x (cash ÷ outflow)
- FCF cover: Not covered by surplus FCF
The Verdict
Because the dividend consumes under 5% of profit and is dwarfed by cash reserves, it is very affordable and easy to maintain — even in a weaker year. The weak-FCF flag matters more for a company trying to grow its dividend than for one paying a token amount.
Sustainability Classification: Sustainable (at current payout level). The ₹0.50 dividend is highly secure given 19x earnings cover and 6x cash cover. The caveat: it is sustainable precisely because it is small — investors should not expect meaningful growth in the payout while debt reduction and capex take priority.
Indo Amines Limited Peer & Sector Comparison
Indo Amines Limited vs Specialty Chemicals Benchmark
| Metric | Indo Amines | Sector / Peer Benchmark |
|---|---|---|
| Dividend Yield | ~0.38% | Basic Materials avg ~1.65% |
| Payout Ratio | ~4.6% | Varies (many peers 10–30%) |
| P/E | ~12–13x | Peer median ~35.8x |
| P/B | ~2.5x | Peer median ~2.75x |
| ROE | ~18% | Sector-dependent |
| ROCE | ~20–21% | Sector-dependent |
Source: ValueResearch (peer median P/E 35.84, P/B 2.75), TipRanks (sector yield, ROE/ROCE). Company-specific peer yields not individually verified here — shown as Not Disclosed to avoid inaccuracy.
Read together: Indo Amines is a cheaper, lower-yielding, higher-return name than the typical specialty-chemical peer. Its P/E of ~12–13x is a deep discount to the peer median (~36x), and its ROE/ROCE (~18–21%) are healthy. But on dividend income specifically it lags the sector — its yield is roughly a quarter of the Basic Materials average.
Indo Amines Limited Promoter Impact Analysis
Promoter
58.41%
Public
~41.5%
FII
0.07%
DII
~0%
Who Benefits
Of the ₹3.63 Cr total outflow, promoters (58.41%) receive about ₹2.12 Cr, while public shareholders share the remaining ~₹1.51 Cr. Institutional ownership is negligible.
Distribution Read
Promoter holding has fallen ~8.95% over three years. With a token payout, the dividend is not a promoter cash-extraction mechanism — most value creation for all holders is being retained inside the business.
Source: Bajaj Finserv / Screener shareholding (Jun 2026): Promoter 58.41%, FII 0.07%, DII 0%, Public 41.5%.
Indo Amines Limited Dividend Taxation
How Dividends Are Taxed in India
- Dividends are taxable in the shareholder's hands at their income-tax slab rate (added to "Income from Other Sources").
- TDS at 10% is deducted by the company if total dividend from that company exceeds ₹5,000 in a financial year (Section 194); 20% if PAN is not provided.
- The company itself no longer pays Dividend Distribution Tax — the burden shifted to investors from FY21.
Worked Example (Generic ₹10/share)
Investor: 1,000 shares, dividend ₹10/share, slab 30%.
- Gross dividend: ₹10,000
- TDS @10% (over ₹5,000): ₹1,000
- Total tax @30%: ₹3,000
- Net in hand: ₹7,000
Indo Amines Example (₹0.50/share)
Investor: 1,000 shares, dividend ₹0.50/share, slab 30%.
- Gross dividend: ₹500
- TDS: Nil (below ₹5,000)
- Tax @30%: ₹150
- Net in hand: ₹350 → effective yield ~0.27% post-tax
General information only, not tax advice. TDS thresholds and rules per the Income-tax Act; consult a professional for your situation.
Key Risks for Indo Amines Limited Shareholders
1. High leverage. Debt-to-equity of ~85% (~₹307 Cr debt) makes earnings sensitive to interest rates and any demand slowdown.
2. Weak free cash flow. The business has been paying dividends despite negative/weak FCF; sustained cash burn would pressure both debt and future payouts.
3. Plant safety / ESG risk. The Mahad facility saw a fatal gas-leak incident in August 2026, halting operations and inviting regulatory scrutiny — a real operational and reputational risk for a chemicals maker.
4. Cyclical, input-cost exposure. Specialty-chemical margins swing with raw-material (crude-linked) prices and global demand; the FY26 margin gain may not repeat.
5. Small/micro-cap liquidity & volatility. The stock is thinly followed (near-zero FII/DII), has fallen ~15–28% over the past year, and can move sharply. A subsidiary was also recently reclassified as an associate, changing the consolidation base.
What To Monitor in Indo Amines Limited
1. Free cash flow trend. Watch whether operating cash flow turns consistently positive and covers capex — the single biggest signal for future dividend growth.
2. Debt reduction. Track total debt and D/E each quarter; a falling ratio would improve both safety and dividend headroom.
3. Mahad plant restart & compliance. Monitor resumption of operations, any penalties, and safety remediation following the gas-leak incident.
4. Margin durability. See whether the FY26 EBITDA-margin expansion holds through raw-material cycles in coming quarters.
5. Dividend policy signals. Any move to raise the ₹0.50 payout — flat for years despite ~42% profit growth — would mark a shift toward shareholder returns.
Should You Consider Indo Amines Limited for Dividend Income?
Positives
- Consistent ₹0.50 dividend, no cuts
- Very high earnings cover (19x) and cash cover (6x)
- Strong FY26: PAT +42%, positive operating leverage
- Healthy ROE/ROCE (~18–21%) at a low P/E (~12–13x)
Negatives
- Token yield ~0.38% — far below sector ~1.65%
- Weak/negative free cash flow
- High debt (D/E ~85%)
- Plant-safety incident & small-cap volatility
Indo Amines Limited is best understood as a growth-and-deleveraging story with a token dividend, not a dividend-income stock. The ₹0.50 payout is rock-solid but immaterial to total return. Anyone buying for yield will be disappointed; anyone attracted to the earnings growth should treat the dividend as a small bonus and weigh the debt and cash-flow risks carefully. This is analysis, not advice — the decision is yours.
Frequently Asked Questions About Indo Amines Limited Dividend
What dividend has Indo Amines Limited announced for FY2026?
What is the Indo Amines dividend yield?
What is the record date for the Indo Amines dividend?
What is the ex-dividend date for Indo Amines?
When will Indo Amines pay the dividend?
Who is eligible for the Indo Amines dividend?
How is the Indo Amines dividend taxed?
Is the Indo Amines dividend sustainable?
What is the Indo Amines dividend history?
What should investors monitor in Indo Amines?
Why is Indo Amines' dividend yield so low despite strong profits?
How much dividend income will 1,000 Indo Amines shares generate?
Does Indo Amines have enough cash to pay the dividend?
How much of the dividend goes to promoters?
Disclaimer – Indo Amines Limited Dividend Analysis
This article is for informational and educational purposes only and does not constitute investment, financial, or tax advice, nor a recommendation to buy, sell, or hold any security. Dividend amounts, dates, and financial figures are based on company filings (BSE/NSE) and third-party data sources as of publication and are subject to shareholder/AGM approval and market changes. Share prices, yields, and ratios fluctuate; figures marked "approximate" or "Not Disclosed by Company" should be independently verified against the company's official annual report and exchange disclosures before acting. ShareBazaar Online and its authors are not liable for any losses arising from the use of this information. Please consult a SEBI-registered investment adviser and a qualified tax professional before making any investment decision.