
Dividend Snapshot
Triveni Engineering & Industries Ltd (NSE: TRIVENI, BSE: 532356) has recommended a final dividend of ₹1.25 per equity share — a headline 125% on the face value of ₹1 — for the financial year ended 31 March 2026. This is in addition to the ₹1.50 interim dividend already paid during the year, taking the total FY2025-26 payout to ₹2.75 per share.
Final Dividend
₹1.25 / share (125%)
Face value ₹1 · Final · FY2025-26
Real Yield on Final Dividend
0.51%
On CMP of ₹247 (15 Sep 2026)
Total FY26 Dividend
₹2.75 / share
₹1.50 interim + ₹1.25 final
Total FY26 Yield
1.11%
Payout ratio ~22% of consolidated PAT
The one-line takeaway: The "125%" number is the dividend measured against a ₹1 face value, not against what the share actually costs. On the live market price of about ₹247, the final dividend is worth roughly half of one percent. This is a low-yield, cyclical dividend from a sugar-and-ethanol business that is simultaneously spinning off its highest-margin division — the details below matter more than the percentage.
Dividend Announcement Summary
At its Board meeting on 29 May 2026, the Board of Directors of Triveni Engineering & Industries recommended a final dividend of ₹1.25 per fully paid-up equity share of face value ₹1 for FY2025-26. The recommendation was subject to shareholder approval, which was obtained at the company's 90th Annual General Meeting held on 7 September 2026. The company had earlier declared and paid an interim dividend of ₹1.50 per share (150%) on 30 January 2026.
What the Board approved
- Final dividend of ₹1.25/share for FY2025-26
- Audited standalone & consolidated results for Q4 and FY26
- Convening of the 90th AGM (held 7 Sep 2026)
- Record date fixed as 31 August 2026
Payout mechanics
Per the company's filing, the dividend, once declared at the AGM, is payable to eligible shareholders within thirty days from the date of the AGM, subject to deduction of tax at source. With the AGM held on 7 September 2026, the payment window runs into early October 2026.
Context that changes the picture: This dividend was announced alongside a major corporate restructuring. Under a NCLT-approved Composite Scheme, the company's Power Transmission Business was demerged into Triveni Power Transmission Limited (TPTL), with a demerger record date of 22 July 2026 (shareholders received 1 TPTL share for every 3 Triveni Engineering shares held). The FY26 financial statements still include the power transmission segment, but the market price of ₹247 already reflects its exit — a nuance central to reading the yield correctly.
Key Dates Timeline
Interim Dividend Declared
30 January 2026
₹1.50 per share (paid during FY26)
Final Dividend Announcement
29 May 2026
Board recommendation ₹1.25/share
Ex-Date
31 August 2026
Under T+1 settlement, ex-date aligns with the record date (per exchange corporate-action circular)
Record Date
31 August 2026
Set by the Board for entitlement
AGM (Approval)
7 September 2026
Dividend confirmed by shareholders
Payment Date
Within 30 days of AGM
By early October 2026 (per company filing)
Shareholders whose names appeared in the register of members / beneficial owners as on the record date of 31 August 2026 were entitled to the final dividend. Because the record date has already passed, the eligibility window for this particular dividend is closed.
Dividend Yield Analysis
Dividend yield is the only figure that tells you what the dividend is actually worth as a return. It is the dividend per share divided by the market price you pay — not the percentage against face value. Here is the gap laid bare:
The face-value illusion
The company declares "125%". That is ₹1.25 measured against the ₹1 face value. Add the ₹1.50 interim and the full-year headline is "275%". Impressive-sounding, but face value is an accounting artefact — no investor buys the share at ₹1.
The real yield
On the market price of about ₹247, the final ₹1.25 is a yield of 0.51%. The full-year ₹2.75 is 1.11%. That is the number that belongs in an income calculation.
Headline vs reality
| Measure | Final only | Full year FY26 |
|---|---|---|
| Headline (% of face value) | 125% | 275% |
| Dividend per share | ₹1.25 | ₹2.75 |
| Real yield (on ₹247) | 0.51% | 1.11% |
A word on the announcement-date price. On 29 May 2026, before the power-transmission demerger took effect, the share traded well above current levels (in the ₹350–390 band). Because the demerger later stripped a business out of the company and out of the share price, an "announcement-date yield" would not be comparable to the ₹1.25 that today's ₹247 holder receives. The cleanest read is the current-price yield of 0.51% (final) and 1.11% (full year), which also matches the ~1.08% trailing yield shown on public data services.
Dividend History Analysis
Triveni's dividend has never been a smooth, growing stream. It rises and falls with the sugar cycle and with one-off events — the classic signature of a cyclical payer, not a steady compounder. The table below shows total dividend per share by financial year (face value has stayed at ₹1 throughout, so the figures are directly comparable).
| Financial Year | Total DPS | Payout of PAT |
|---|---|---|
| FY2018-19 | ₹0.70 | ~8% |
| FY2019-20 | ₹1.10 | ~8% |
| FY2020-21 | ~₹1.75 | ~14% |
| FY2021-22 | ~₹3.25 | ~19% |
| FY2022-23 | ~₹3.25 | ~4%* |
| FY2023-24 | ₹5.80 (peak) | ~32% |
| FY2024-25 | ₹2.50 | ~22% |
| FY2025-26 | ₹2.75 | ~22% |
*FY23 payout looks tiny only because reported profit was inflated by a large one-time gain (see Financial Performance). Historical DPS values are reconstructed from disclosed EPS and payout ratios and cross-checked against public dividend records; exact per-year splits between interim and final may vary by source.
The dividend cut hiding in the headline
The final dividend was halved — from ₹2.50 for FY25 to ₹1.25 for FY26. Several data services flagged this as a dividend reduction. The full-year total (₹2.75) still edged above FY25's ₹2.50 only because the company front-loaded a larger ₹1.50 interim mid-year. The peak of ₹5.80 in FY24 has not been revisited.
Classification
Triveni is a cyclical payer. It has paid every year for a decade, but the amount swings with sugar realisations, ethanol economics and one-off monetisations. Investors should not extrapolate any single year's payout forward.
Financial Performance Analysis
On a consolidated basis for FY2025-26, Triveni reported revenue from operations of ₹7,620.85 crore (gross of excise duty) and net profit of ₹268.71 crore, giving an EPS of ₹12.19. Revenue and profit both grew modestly year-on-year, though the numbers are not strictly comparable because prior periods were restated for the amalgamation of Sir Shadi Lal Enterprises (SSEL).
Consolidated Revenue (FY26)
₹7,620.85 cr
vs ₹6,807.94 cr in FY25
Consolidated PAT (FY26)
₹268.71 cr
vs ₹238.26 cr in FY25
Net Profit Margin
~4%
Thin, typical of sugar-led revenue
Return Ratios
ROE ~8.7% · ROCE ~9%
Down from 17-21% at the peak
Operating leverage: the Q4 warning
The full-year growth masks a weaker fourth quarter. In Q4 FY26, consolidated revenue from operations of ₹1,833.65 crore was down about 4.8% versus Q4 FY25, and quarterly PAT of ₹167.45 crore fell about 8.5% year-on-year. Profit falling faster than revenue is the fingerprint of margin pressure — in a sugar business, that usually means cane-cost inflation and softer realisations biting into the spread. Segment margins confirm the squeeze: sugar earned only ~6.1% and distillery ~4.1% at the operating level in FY26.
The FY23 profit that was not what it looked like
Anyone scanning a long-run profit chart will see FY23 net profit of roughly ₹1,792 crore and assume a blockbuster operating year. It was not. That figure was lifted by around ₹1,496 crore of "other income" — a one-time gain, chiefly from monetising the Triveni Turbine stake. Strip it out and core profitability was ordinary. Reported profit is an opinion; the one-off flatters the multi-year growth optics and explains why the FY23 payout ratio looks abnormally low.
The bigger structural shift
The FY26 accounts include the Power Transmission business, which earned a segment margin of ~35.4% — by far the most profitable division and a quality-of-earnings anchor. From FY27, this business sits in a separate listed company (TPTL). What remains inside Triveni Engineering is a more cyclical sugar, distillery and water portfolio. This is the single most important lens for judging future dividend capacity.
Cash Flow Analysis
Reported profit is an opinion; cash is a fact. And on cash, this dividend rests on a much thinner cushion than the earnings coverage suggests.
Operating Cash Flow (FY26)
₹187.92 cr
Recovered from ₹-106 cr in FY25
Capex (PP&E + intangibles)
₹182.89 cr
Absorbs almost all operating cash
Free Cash Flow (FY26)
₹5.03 cr
Razor-thin after capex
Total Dividend Outflow (FY26)
₹60.20 cr
₹2.75 × 21.89 cr shares
The finding that matters: FCF barely exists
Operating cash flow of ₹187.92 crore covers the ₹60.20 crore dividend outflow a comfortable 3.1 times. But once you subtract the ₹182.89 crore of capex the business needed, free cash flow collapses to just ₹5.03 crore — which covers the FY26 dividend only 0.08 times. In plain terms: after keeping the plants running and growing, there was almost no surplus cash left, and the dividend was effectively funded from the balance sheet and working-capital swings rather than from durable free cash flow.
And FY26 was the good year
The volatility is severe. Free cash flow was roughly ₹-255 crore in FY24 and ₹-404 crore in FY25, with operating cash flow itself turning negative (₹-106 crore) in FY25. FY26's modestly positive OCF is a recovery, not a trend. For a sugar company, negative or thin free cash flow is structurally normal — cane must be paid for up front and inventory piles up during the crushing season — but it means the dividend is a call on reserves and borrowings in weak years, not a distribution of surplus cash.
Balance Sheet Strength
The company remains solvent and adequately capitalised, but leverage has been rising and cash on hand is modest relative to debt — a combination worth watching when the business is paying dividends into a capex-hungry cycle.
Total Borrowings (FY26)
₹2,147 cr
Up from ~₹929 cr in FY23
Cash & Bank Balances
₹70.34 cr
Cash & equivalents + other bank balances
Net Debt
~₹2,077 cr
Debt-to-equity ~0.64
Interest Cover / Current Ratio
8.3x / 1.49
Comfortable interest cover; adequate liquidity
The bulk of borrowings (₹1,826 crore) is short-term working-capital debt used to fund sugar inventory — normal for the sector. Interest is covered a healthy 8.3 times by operating earnings, and the current ratio of 1.49 is adequate. The caution flag is direction: gross debt has more than doubled since FY23 while cash of just ₹70 crore covers the FY26 dividend only 1.17 times. Screener's automated checklist also notes the company "might be capitalising the interest cost", which is worth verifying in the annual report. Book value per share is around ₹153, so the share trades at roughly 1.6 times book.
Dividend Sustainability Analysis
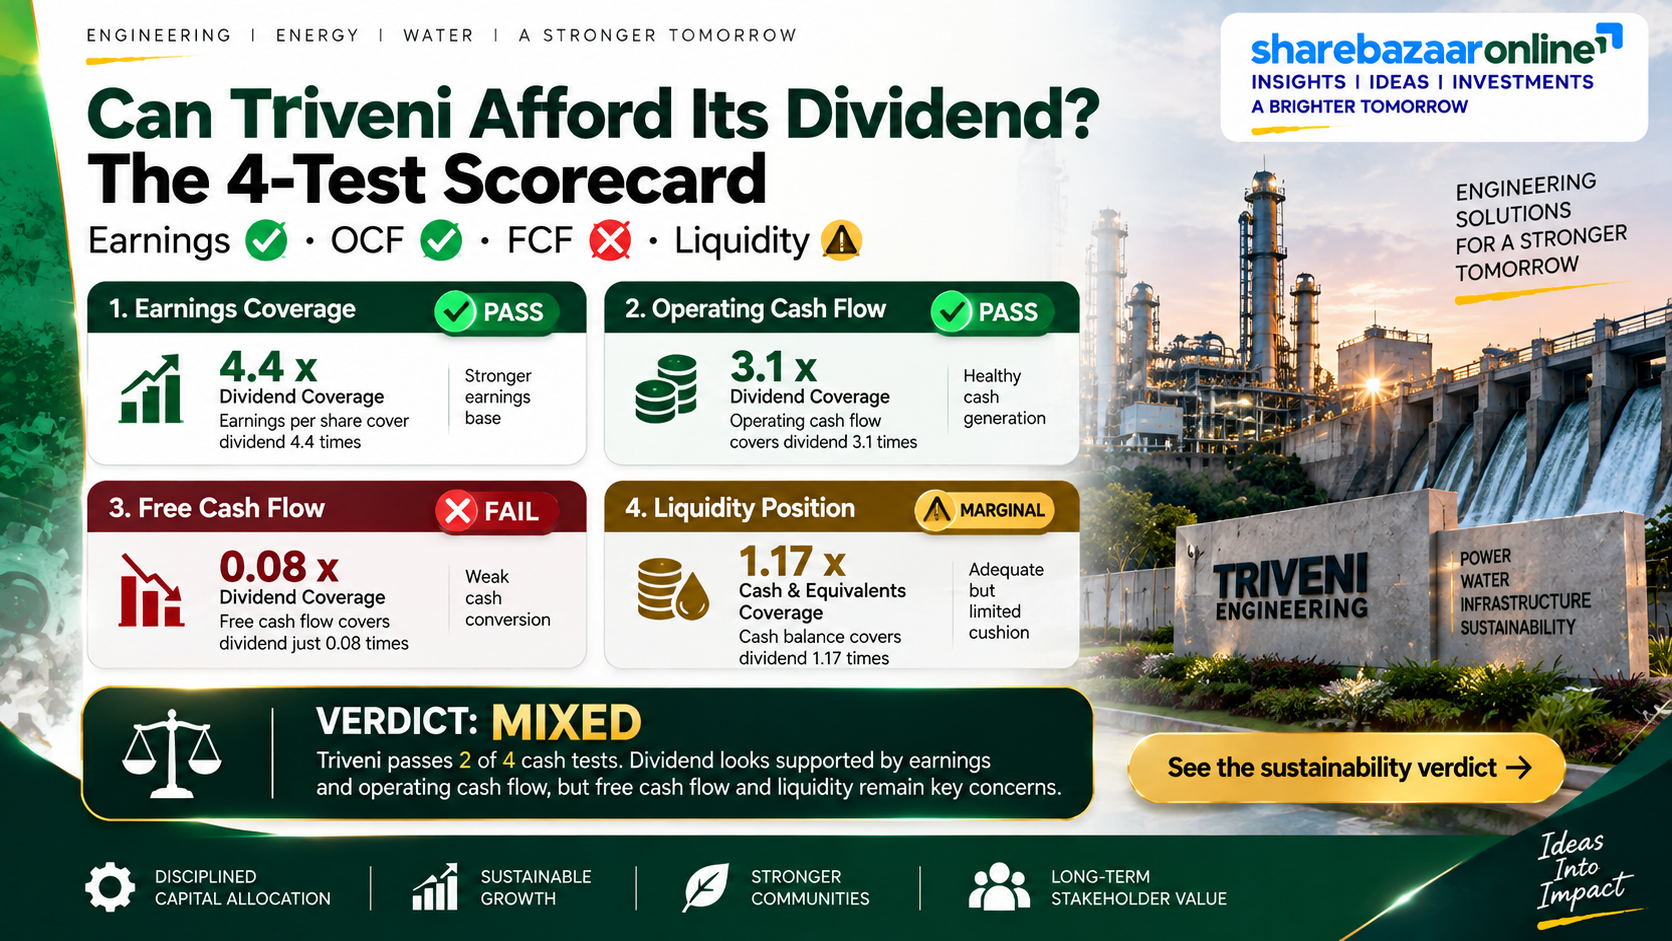
We run the dividend through four tests — earnings, operating cash flow, free cash flow and liquidity. The result is a split verdict: comfortably covered by profit and operating cash, but not by free cash flow.
| Test | Coverage | Verdict |
|---|---|---|
| Earnings (EPS ₹12.19 / DPS ₹2.75) | 4.43x | Pass |
| Operating cash flow (₹187.92 cr / ₹60.20 cr) | 3.12x | Pass |
| Free cash flow (₹5.03 cr / ₹60.20 cr) | 0.08x | Fail |
| Liquidity (cash ₹70.34 cr / ₹60.20 cr) | 1.17x | Marginal |
Verdict: Moderately Sustainable
The dividend is small relative to profit (22% payout) and to operating cash flow, so there is no imminent risk of a cash crunch forcing a cut. But it is not funded by free cash flow — after capex there is almost nothing left — and the company has already shown it will trim the payout in a weaker year (the final dividend was halved versus FY25). Layer on the demerger of the high-margin power-transmission arm from FY27, and the honest classification is Moderately Sustainable and cyclical: expect the dividend to track sugar-and-ethanol profitability up and down rather than grow steadily.
Peer Comparison
Sugar-and-ethanol is a low-yield sector — cyclical, capital-hungry and prone to modest payouts. Against that backdrop, Triveni's ~1.1% trailing yield actually sits at the higher end of the sugar pack, though the differences are small.
| Company | Approx. Div Yield | Notes |
|---|---|---|
| Triveni Engineering | ~1.1% | Payout ~22%; most diversified |
| Balrampur Chini Mills | ~0.7% | Payout ~14%; quality benchmark in UP |
| Dalmia Bharat Sugar | Low (~0.5-1%) | Capex-focused, expanding distillery |
| EID Parry | Low single digit | Murugappa group, South India |
| DCM Shriram / Dhampur | ~0.5-1% | Cyclical payers |
Peer yields are approximate and move with price; sourced from public market-data services and rounded. Sugar-sector dividend yields broadly cluster in the ~0.5%-1.1% range.
The takeaway is not that Triveni is a superior income stock — it is that none of these companies is an income stock. Sugar mills reinvest heavily and pay modest, cyclical dividends. Triveni's edge historically was its engineering (power transmission and water) diversification, which lifted margins above pure sugar peers; the power-transmission demerger narrows that edge from FY27.
Promoter Impact Analysis
Promoters (the Sawhney family) hold about 60.58% of Triveni Engineering (latest shareholding), down marginally from 60.98%. Because the promoter stake is so large, most of every dividend rupee flows to the promoter group.
Promoter Share of FY26 Dividend
~₹36.5 cr
60.58% of the ₹60.20 cr total outflow
Public / Minority Share
~₹23.7 cr
Split across FIIs (~7.7%), DIIs (~7.6%), public
Of the roughly ₹60.2 crore in total FY26 dividends, about ₹36.5 crore accrues to the promoter group and the remaining ~₹23.7 crore to public and institutional holders. This alignment cuts both ways: promoters have a clear incentive to keep dividends flowing, but with free cash flow near zero, sizeable promoter payouts drawn from a leveraged balance sheet are a legitimate governance question. Note that institutional interest has been rising — FII holding climbed from ~5.6% to ~7.7% over the past year, while promoter holding slipped slightly.
Taxation Analysis
Since FY2020-21, dividends are taxable in the hands of the shareholder at their applicable income-tax slab rate (the old Dividend Distribution Tax was abolished). There is no separate concessional rate — a dividend is added to "Income from Other Sources" and taxed like salary or interest.
TDS rules (FY2025-26)
- TDS under Section 194 at 10% (with PAN) if total dividend from the company exceeds ₹10,000 in the financial year
- The threshold was raised from ₹5,000 to ₹10,000 effective 1 April 2025 (Budget 2025)
- No PAN → TDS at 20%
- Non-residents: 20% (plus surcharge/cess), subject to DTAA relief
- Form 15G/15H can be filed by eligible residents to avoid TDS
Worked example
Investor holds 1,000 shares; full-year dividend ₹2.75/share.
- Gross dividend: 1,000 × ₹2.75 = ₹2,750
- TDS: Nil (below the ₹10,000 threshold)
- Tax at 30% slab: ₹825
- Net in hand after tax: ₹1,925
- Effective post-tax yield (on ₹247): ~0.78%
The practical point for retail holders: for most small portfolios the whole dividend lands in your account with no TDS (below ₹10,000), but you still owe tax on it at your slab rate when you file your return. For a 30%-bracket investor, a ~1.11% pre-tax yield becomes roughly 0.78% after tax. Tax rules are general and individual circumstances differ — confirm with a tax adviser.
Key Risks
1. Loss of the high-margin segment
From FY27, the power-transmission business (~35% segment margin) sits in TPTL, not Triveni. The residual business is more cyclical and lower-margin, which could pressure future dividend capacity.
2. Free cash flow near zero
FY26 FCF of just ₹5.03 crore covers the dividend only 0.08x, and FCF was deeply negative in FY24 and FY25. The dividend depends on reserves and borrowings in weak years.
3. Sugar-cycle and regulatory risk
Earnings hinge on government-set cane prices (FRP/SAP), sugar MSP, export quotas and ethanol procurement prices. Any adverse policy shift compresses margins and, in turn, dividends.
4. Rising leverage
Gross borrowings have more than doubled since FY23 to ~₹2,147 crore. Paying dividends while debt climbs raises the cost of the payout and reduces balance-sheet flexibility.
5. Falling return ratios
ROE (~8.7%) and ROCE (~9%) have slid from 17-21% at the peak, and 3-year profit growth is negative (~-19%). Deteriorating returns can eventually cap dividend growth.
6. Low, cut-prone yield
At ~1.1% the yield is thin, and the company has just halved its final dividend versus FY25. This is not a reliable income instrument.
What To Monitor
Post-demerger earnings base
Watch the first full-year FY27 results of the slimmed-down Triveni Engineering to see how much profit and cash the sugar-distillery-water business generates without power transmission.
Free cash flow trajectory
Track whether FCF turns durably positive as the current capex cycle matures. Sustained positive FCF would be the signal that the dividend is genuinely self-funded.
Ethanol economics & blending policy
Distillery contribution and government ethanol procurement prices are the main swing factor for margins. Monitor blending-programme targets and OMC price revisions.
Debt and working capital
Follow gross borrowings, the inventory build during crushing season, and whether interest is being capitalised. Rising debt alongside dividends is a red flag.
Payout-ratio discipline
See whether management holds the ~22% payout, raises it, or trims again. The FY26 final-dividend cut shows they will flex it with the cycle.
Sugar prices & cane costs
The core spread. Rising sugar realisations (recent sector strength has helped) against FRP-driven cane inflation determines the sugar segment's profitability.
Conclusion
Triveni Engineering's FY2025-26 final dividend of ₹1.25 per share carries a big-sounding "125%" label, but on the live market price of about ₹247 it is a real yield of roughly half a percent; the full-year ₹2.75 works out to about 1.11%. It is comfortably covered by profit (4.4x) and operating cash flow (3.1x), so there is no near-term solvency worry.
The forensic reality beneath the headline is more sober. Free cash flow is essentially nil (₹5 crore, 0.08x the dividend), leverage has doubled since FY23, return ratios have halved, the final dividend was just cut in half versus FY25, and — most importantly — the company is demerging its most profitable division into a separate listed entity from FY27. This is a low-yield, cyclical payout from a business in structural transition. The positives (diversified franchise, healthy interest cover, rising institutional interest, a comfortable earnings payout) and the negatives (thin FCF, rising debt, falling returns, cyclical and cut-prone dividend, loss of the high-margin arm) are laid out above so you can weigh them yourself.
Frequently Asked Questions
What dividend has Triveni Engineering announced for FY2025-26?
What is the actual dividend yield of Triveni Engineering?
What was the record date for the Triveni dividend?
What is the ex-date for this dividend?
When will the dividend be paid?
Who was eligible for the dividend?
How is the Triveni dividend taxed?
Is the Triveni dividend sustainable?
What is Triveni Engineering's dividend history?
Why did the share price fall so much before this dividend?
What should investors monitor going forward?
How does Triveni's yield compare with sugar peers?
Disclaimer
This article is for informational and educational purposes only and does not constitute investment, financial, legal or tax advice, nor a recommendation to buy, sell or hold any security. ShareBazaar Online is not a SEBI-registered investment adviser. Figures are drawn from the company's regulatory filings and publicly available market-data services; market prices, yields and peer data change continuously and may differ from the values shown here. Historical dividend figures are reconstructed from disclosed EPS and payout ratios and cross-checked against public records; readers should verify all data against primary sources (company filings and exchange circulars) before acting. Dividends are subject to shareholder approval and applicable taxes. Investing in equities carries risk, including the possible loss of principal. Please consult a qualified financial adviser and conduct your own due diligence before making any investment decision.