
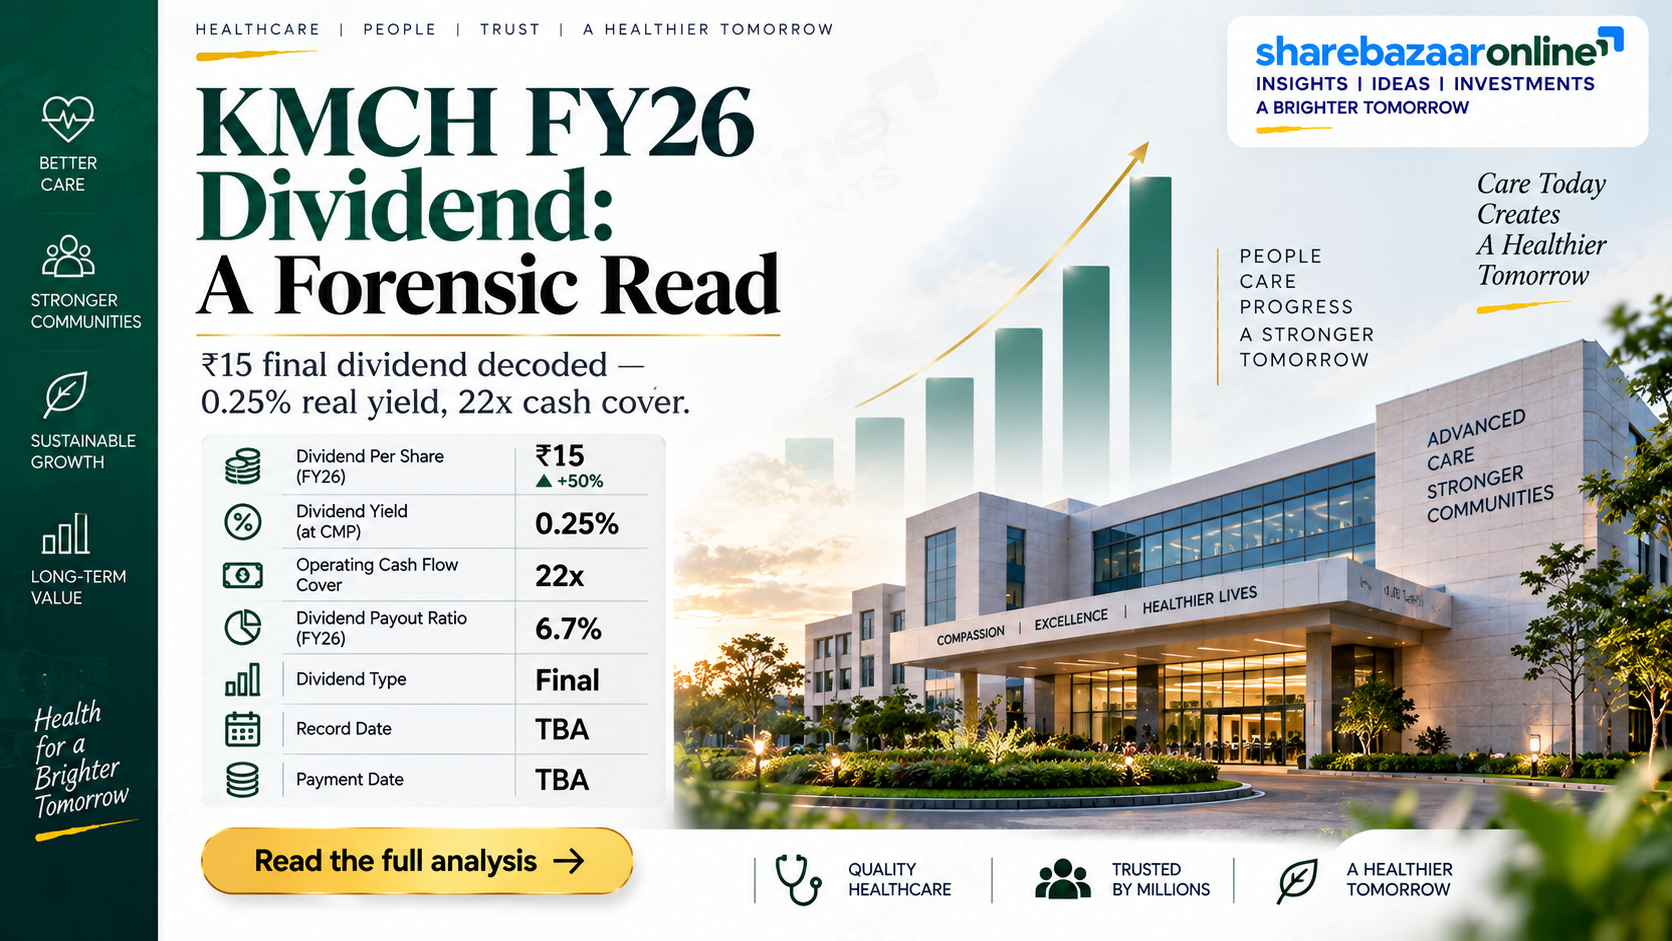
Dividend Snapshot
Kovai Medical Center & Hospital Ltd (KMCH) has declared a Final Dividend of ₹15 per equity share for FY2025-26 — a headline rate of 150% on the ₹10 face value. That percentage looks large, but it is calculated on face value, not on the market price. At the current market price of about ₹6,019, the real cash return works out to a dividend yield of just 0.25%. This is the core number a retail investor should anchor on.
Dividend Per Share
₹15.00
Dividend Type
Final Dividend (FY2025-26)
Headline Rate (on Face Value)
150%
Real Dividend Yield (on CMP)
0.25%
Record Date
19 August 2026
Payment Date
25 September 2026
Estimated Total Payout
₹16.41 Crore
Dividend Payout Ratio (FY26)
6.7% of Profit
The one-line takeaway: KMCH raised its dividend from ₹10 to ₹15 — a 50% jump and its highest-ever absolute payout — yet the company still keeps roughly 93 paise of every rupee of profit inside the business to fund hospital expansion. This is a growth compounder that pays a token dividend, not a high-yield income stock.
Dividend Announcement Summary
On 22 May 2026, the Board of Directors of Kovai Medical Center & Hospital Ltd, at its meeting to consider audited FY2025-26 results, recommended a final dividend of ₹15 per equity share (150% of the ₹10 face value), subject to shareholder approval at the Annual General Meeting.
The dividend was approved by shareholders at the company’s 40th Annual General Meeting held on 26 August 2026. The record date to determine eligible shareholders was fixed at 19 August 2026, with payment scheduled for 25 September 2026.
Company Identifiers
- Company: Kovai Medical Center & Hospital Ltd
- NSE Symbol: KOVAI
- BSE Code: 523323
- ISIN: INE177F01017
- Face Value: ₹10
- Sector: Healthcare — Multi-specialty Hospital
KMCH is a Coimbatore-based super-specialty hospital chain that also runs a medical college (education services segment). It carries a promoter holding of 56.53% and roughly 1.094 crore shares outstanding.
Key Dates Timeline
Board Meeting / Announcement
22 May 2026
FY26 results approved; ₹15 dividend recommended
Ex-Dividend Date
19 August 2026
Under India’s T+1 settlement, the ex-date and record date fall on the same day
Record Date
19 August 2026
Shareholders on the register on this date qualified for the dividend
AGM & Payment
AGM 26 Aug 2026 → Paid 25 Sep 2026
Dividend approved at the 40th AGM; credited to eligible holders thereafter
All the dates above have already passed as of this writing. Eligibility was determined by holdings as on the 19 August 2026 record date; buyers after the ex-date did not qualify for this particular dividend.
Dividend Yield Analysis
The dividend yield tells you the actual cash return on the money you would pay today to buy the share. It is the single most misunderstood number in dividend headlines, because promoters and news wires quote the percentage on face value.
Headline “150%” explained
₹15 dividend ÷ ₹10 face value × 100 = 150%. This is real but almost meaningless for return, because no one buys the share at face value.
Yield at current price
₹15 ÷ ₹6,019 (CMP, 15 Sep 2026) × 100 = 0.25%.
Yield around announcement
With the stock trading in roughly the ₹5,800–5,950 band in the announcement window, the yield was about 0.26% — effectively identical (announcement-period price is an approximation, not an exact single-day close).
Yield reality check
The 0.25% yield is the product of a genuinely small payout, not a collapsing share price. KMCH deliberately retains earnings to fund growth — the low yield is a design choice, not a distress signal.
A ₹1,00,000 investment in KMCH at the current price would fetch roughly ₹249 in gross annual dividend before tax. That is the honest scale of the cash return.
Dividend History Analysis
KMCH has been a consistent but modest dividend payer. The important story is the trajectory: the absolute dividend has tripled over five years, and this year’s ₹15 is the largest in the company’s history.
| Financial Year | Dividend Per Share | Rate on Face Value | EPS (₹) | Payout |
|---|---|---|---|---|
| FY2025-26 | ₹15 | 150% | 223.4 | 6.7% |
| FY2024-25 | ₹10 | 100% | 191.0 | 5.2% |
| FY2023-24 | ₹10 | 100% | 164.3 | 6.1% |
| FY2022-23 | ₹5 | 50% | 105.8 | 4.7% |
| FY2021-22 | ₹5 | 50% | 95.3 | 5.2% |
Growth trend
Dividend rose from ₹5 (FY22) to ₹15 (FY26) — a ~32% compound annual growth in the payout over four years, broadly in line with independent estimates of KMCH’s 5-year dividend growth of around 27%.
Consistency
No dividend cuts or suspensions in recent years, including through the COVID period. The payout has only stepped up or held flat.
The ₹10 → ₹15 signal
After holding at ₹10 for two years (FY24 and FY25), the 50% hike to ₹15 signals management confidence as the heavy capex cycle begins to convert into cash flow.
Classification
Consistent Payer with a rising, low-payout policy — typical of a capex-heavy hospital compounder.
Per-share dividend and EPS figures sourced from Screener.in and broker disclosures; earlier-year DPS for FY22–FY23 reconciled against reported ex-dates and payout ratios.
Financial Performance Analysis
The dividend is only as safe as the earnings behind it. KMCH’s FY2025-26 results show revenue and profit growing together, with stable margins — the healthiest possible backdrop for a dividend. (KMCH’s consolidated and standalone numbers are near-identical because both the hospital and the medical college sit within the listed entity; figures below are standalone.)
| Metric (₹ Cr) | FY2024-25 | FY2025-26 | Change |
|---|---|---|---|
| Revenue | 1,369.74 | 1,584.15 | +15.7% |
| Operating Profit | 390 | 445 | +14.1% |
| Operating Margin (OPM) | 28% | 28% | Stable |
| Net Profit (PAT) | 208.95 | 244.46 | +17.0% |
| EPS (₹) | 191.0 | 223.4 | +17.0% |
Operating leverage check
Revenue up 15.7%, operating profit up 14.1%, and PAT up 17.0% — profit is growing at least as fast as sales, with no margin compression. This is a clean, high-quality earnings profile.
Multi-year momentum
Over five years, profit compounded at roughly 26% a year and revenue at about 18% — consistently ahead of the broader hospital sector.
Return ratios (FY26)
ROE 20.5% and ROCE 22.6% — among the best in the listed hospital space, showing capital is being deployed efficiently.
Latest quarter (Q1 FY27)
Momentum has continued: revenue of about ₹430.91 Cr and net profit of about ₹69.09 Cr in the June 2026 quarter.
Cash Flow Analysis
Reported profit is an accounting opinion; cash is fact. This is where KMCH’s story gets more interesting. The company generates strong operating cash, but almost all of it — and more — is being ploughed straight back into building and equipping hospitals.
| Cash Flow (₹ Cr) | FY2024-25 | FY2025-26 |
|---|---|---|
| Operating Cash Flow (OCF) | 335 | 362 |
| Investing Cash Flow (capex-led) | -593 | -514 |
| Financing Cash Flow | +62 | -58 |
| Free Cash Flow (FCF) | -18 | 111 |
| Net Change in Cash | -197 | -210 |
OCF vs profit — the good news
Operating cash flow of ₹362 Cr comfortably exceeds net profit of ₹244 Cr (cash conversion above 100%). The profits are real, backed by cash, with very short receivable cycles — typical of a hospital that collects near point-of-service.
FCF swing back to positive
FCF was negative ₹18 Cr in FY25 at the peak of capex, then recovered to positive ₹111 Cr in FY26. The ₹16.41 Cr dividend is covered ~6.8x by FY26 free cash flow.
How the dividend is funded
The dividend is funded out of current earnings and operating cash, not from borrowings or asset sales. At just ₹16.41 Cr, it is a rounding error against the ₹362 Cr of operating cash the business throws off.
The honest caveat
Net cash has fallen for several years running (roughly -₹210 Cr in FY26) because investing outflows far exceed operating cash. This is a deliberate expansion choice, but it is why the company keeps its dividend deliberately small.
Balance Sheet Strength
Net Worth (FY26)
₹1,319 Crore
Book value about ₹1,206 per share
Total Borrowings (FY26)
₹403 Crore
Down from ₹415 Cr a year earlier
Debt-to-Equity
0.31
Conservative for a capex-heavy hospital
Interest coverage
On roughly ₹36 Cr of annual interest against operating profit of ₹445 Cr, interest is covered many times over. Debt servicing is not a constraint on the dividend.
Deleveraging trend
Debt-to-equity has fallen sharply over five years as reserves have grown from expanding profits. Reserves reached about ₹1,308 Cr in FY26.
Cash position
KMCH runs a lean cash balance because surplus cash is continuously redeployed into capex; the exact year-end cash figure is best confirmed from the FY26 annual report. Even so, the tiny dividend is trivially affordable from annual operating cash.
Verdict on balance sheet: Solid. Modest leverage, strong and rising net worth, and comfortable interest cover. The balance sheet is built for expansion, not for large cash distributions.
Dividend Sustainability Analysis
We apply four independent coverage tests. A dividend is only truly safe when it passes all of them.
1. Earnings coverage
EPS ₹223.4 ÷ DPS ₹15 = 14.9x cover. Payout is only 6.7% of profit. Overwhelmingly safe.
2. Operating cash coverage
OCF ₹362 Cr ÷ outflow ₹16.41 Cr = ~22x cover. The business generates 22 rupees of operating cash for every rupee paid out.
3. Free cash flow coverage
FCF ₹111 Cr ÷ outflow ₹16.41 Cr = ~6.8x cover in FY26. Note this is the thinnest test, since FCF swings with the capex cycle (it was negative in FY25).
4. Liquidity / debt test
Debt-to-equity of 0.31 and strong interest cover mean the dividend is not being sustained by borrowing. It is genuinely earned.
Overall verdict
Sustainable
The dividend passes all four tests with wide margins. The only nuance is that KMCH deliberately keeps the payout tiny so it can keep funding expansion — the constraint on future dividend growth is management’s reinvestment appetite, not the company’s ability to pay.
Peer Comparison
The most useful thing peer data reveals is that the entire listed hospital sector pays a token yield. Investors buy hospitals for growth, not income. KMCH is no outlier on yield — and it stands out on efficiency and low debt.
| Company | Dividend Yield | ROE | Debt/Equity | P/E |
|---|---|---|---|---|
| KMCH (Kovai) | ~0.25% | 20.5% | 0.31 | ~26 |
| Apollo Hospitals | ~0.23% | ~20.5% | ~0.61 | ~59 |
| Narayana Hrudayalaya | ~0.24% | ~17.8% | ~1.29 | ~47 |
| Fortis Healthcare | Low / nil | ~10.5% | Low | High |
Efficiency leader
KMCH’s ROE of 20.5% matches the best large-cap (Apollo), and its ROCE of ~22.6% is superior to most peers — achieved with far lower debt than Narayana or Apollo.
Valuation gap
Despite comparable returns, KMCH trades at a P/E near 26 versus a sector often quoted at 55–65 — largely reflecting its smaller size, single-region (Coimbatore) concentration, and lower trading liquidity.
Peer yields, ROE, D/E and P/E are approximate, drawn from public market-data aggregators and move with share prices; treat them as directional, not point-in-time exact.
Promoter Impact Analysis
Shareholding (June 2026)
- Promoters: 56.53%
- DIIs: 4.24%
- FIIs: 1.25%
- Public & others: 37.98%
Promoter holding has been slowly rising over the years and carries no pledge, which is a governance positive.
Promoter dividend income
~₹9.28 Crore
56.53% of the ₹16.41 Cr total payout
Public / minority income
~₹7.13 Crore
Shared across all non-promoter holders
Because the dividend is so small relative to profit, it is not a mechanism for outsized promoter cash extraction. Promoters benefit far more from the compounding of retained earnings and the resulting share-price appreciation than from the ₹9.28 Cr dividend cheque — and, importantly, minority shareholders benefit from that reinvestment on exactly the same per-share basis.
Taxation Analysis
Since April 2020, dividends are taxed in the hands of the investor, not the company. Here is how the ₹15 KMCH dividend is treated.
Slab-rate taxation
The full dividend is added to your total income and taxed at your applicable income-tax slab rate — 5%, 20%, 30% and so on.
TDS rule
If total dividend from a company in a financial year exceeds ₹10,000 (the threshold raised from the earlier ₹5,000 under recent rules), the company deducts 10% TDS (20% if PAN is not provided). This TDS is adjusted against your final tax liability.
Worked example — 1,000 shares
- Dividend: 1,000 × ₹15 = ₹15,000 gross
- TDS at 10% (above threshold): ₹1,500
- Amount credited after TDS: ₹13,500
- Final tax at 30% slab: ₹4,500
- Net dividend after full tax: ₹10,500
Effective post-tax yield on today’s price for a 30%-slab investor: ~0.17%.
Tax rules are general and current at the time of writing; consult a qualified tax advisor for your specific situation.
Key Risks
1. Geographic concentration
KMCH’s operations are heavily concentrated in and around Coimbatore, Tamil Nadu. A regional slowdown, local competition, or a demand shock in that market hits the whole business.
2. Capex intensity and negative net cash
Investing outflows have exceeded operating cash for several years, keeping net cash flow negative. If expansion returns disappoint, capital allocation could come under scrutiny — at least one analyst house has already flagged that capital-allocation trends are not ideal.
3. Regulatory and pricing risk
Hospitals face price caps on procedures, consumables and implants, plus scheme-based reimbursement pressures that can squeeze margins.
4. Very low dividend yield
At ~0.25%, this stock delivers negligible income. Investors who bought it expecting meaningful dividend cash will be disappointed — the return case rests almost entirely on capital appreciation.
5. Liquidity and key-person risk
The share is thinly traded (high absolute price, low daily volume), which can amplify price swings. As a promoter-led, doctor-founded institution, continuity of clinical and management leadership also matters.
6. Talent and cost inflation
Retaining specialist doctors and nursing staff is competitive; rising employee and consumable costs can erode the 28% operating margin.
What To Monitor
1. Free cash flow trajectory
Watch whether FCF stays positive (as in FY26) or dips again with the next capex wave. Sustained positive FCF is what would eventually allow a bigger payout.
2. Occupancy and ARPOB
Bed occupancy rate and average revenue per occupied bed drive hospital operating leverage. Rising utilisation of new capacity is the key value driver.
3. Return on new capex
Track whether ROCE holds above 20% as new blocks (Sulur super-specialty, cath labs, transplant and robotics programmes) ramp up. Falling ROCE would be an early warning.
4. Debt levels
Keep an eye on whether borrowings rise materially to fund the next phase of growth, and whether debt-to-equity stays near or below current levels.
5. Payout policy shift
The step-up to ₹15 may signal the start of a rising-dividend phase. Watch whether the payout ratio drifts above 7–10% in coming years — that would mark a genuine change in capital-return intent.
6. Geographic diversification
Any move to expand meaningfully beyond the Coimbatore region would reduce concentration risk and could re-rate the business.
Conclusion
KMCH’s ₹15 dividend is a small cash event wrapped in a big-sounding “150%” headline. Decoded, it is a 0.25% yield — a token distribution from a company that would rather reinvest almost all of its profit into building hospitals.
Positives
- Dividend raised 50% (₹10 → ₹15), the highest ever
- Payout covered ~15x by earnings and ~22x by operating cash
- Best-in-class ROE (20.5%) and ROCE (22.6%) with low debt (D/E 0.31)
- Strong, cash-backed profit growth (~26% profit CAGR over 5 years)
- No dividend cuts or suspensions; no promoter pledge
Negatives / Watch-outs
- Negligible income — 0.25% yield is not for income investors
- Net cash flow negative for years due to heavy capex
- Concentrated in one region (Coimbatore)
- Thinly traded, high-priced share
- Capital-allocation trends flagged by at least one analyst
The bottom line: this is a well-run, efficient healthcare compounder whose dividend is a signal of confidence, not a source of returns. We present the positives, negatives, risks and monitoring factors so you can decide for yourself — we do not offer buy, sell or hold advice.
Frequently Asked Questions
What dividend has Kovai Medical Center & Hospital announced?
What is the Kovai Medical dividend yield?
What was the record date for the KMCH dividend?
What was the ex-dividend date?
When was the dividend paid?
Who was eligible to receive the dividend?
How is the KMCH dividend taxed?
Is the KMCH dividend sustainable?
What is KMCH’s dividend history?
How much dividend will I get on 100 shares?
Why is the dividend so small if the company is profitable?
What should investors monitor going forward?
How does KMCH’s dividend compare with other hospital stocks?
Disclaimer
This article is for informational and educational purposes only and does not constitute investment advice, a recommendation, or an offer to buy or sell any security. ShareBazaar Online is not a SEBI-registered investment adviser. Figures are drawn from company disclosures and public data sources (including Screener.in, stock exchanges and broker platforms) and may contain errors or become outdated; market prices, yields and ratios change continuously. Dividend approval, record date and payment details are subject to the company’s official filings. Please verify all data with primary sources on the NSE and BSE websites and consult a qualified, SEBI-registered financial adviser and tax professional before making any investment decision. Investments in securities are subject to market risks.