
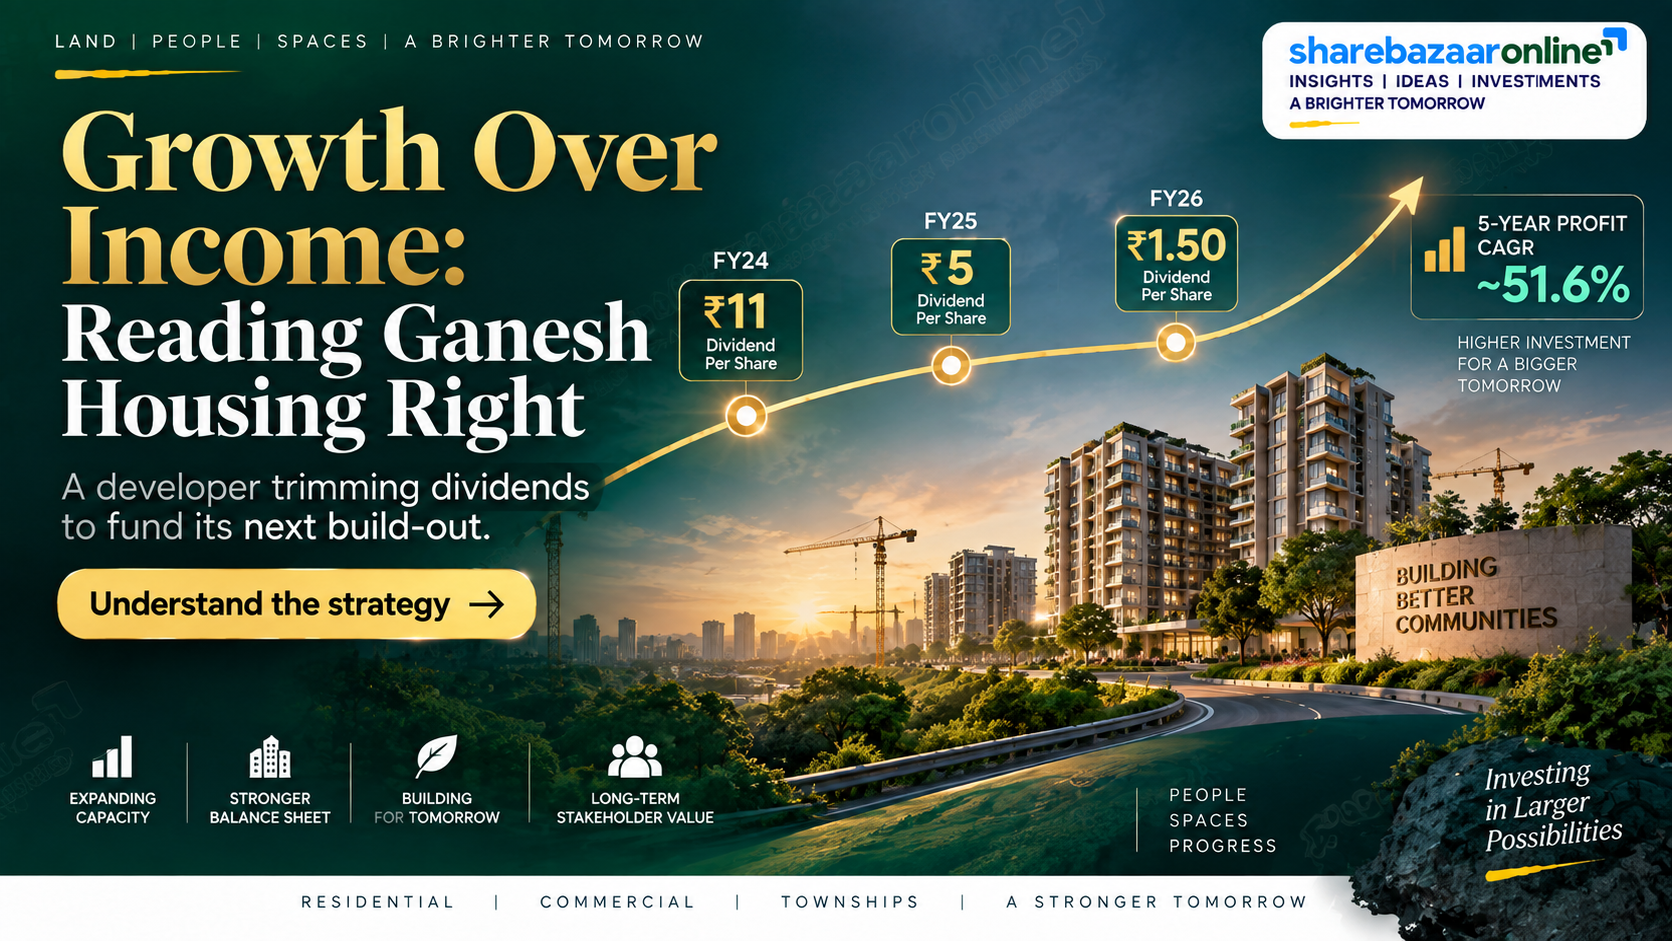
Dividend Snapshot
Ganesh Housing Limited (NSE: GANESHHOU, BSE: 526367) has recommended a final dividend of ₹1.50 per equity share for the financial year 2025-26. The board describes this as a 15% dividend — but that 15% is calculated on the ₹10 face value, not on the market price. Measured against the actual share price of roughly ₹763, the real cash yield an investor earns is only about 0.20%. The headline percentage is about 76 times larger than the yield your money actually receives.
Dividend Per Share: ₹1.50
Dividend Type: Final Dividend (FY 2025-26)
Face Value: ₹10 per share
Headline Rate: 15% (on face value)
Real Market Yield: ~0.20% (on ₹763)
Record Date: 31 August 2026
AGM Date: 11 September 2026
Total Outflow: ~₹12.51 Crore
Consolidated Payout: ~4.0% of profit
Sector: Real Estate (Realty)
The single most important thing to notice: this ₹1.50 dividend is the third annual cut in a row. The company paid ₹11.00 for FY24, ₹5.00 for FY25, and now ₹1.50 for FY26 — a decline of roughly 86% from the peak. It arrives in the same year that revenue and profit nearly halved and borrowings jumped sharply. This report explains what is really happening beneath the numbers.
Dividend Announcement Summary
At its board meeting held on 29 May 2026, the Board of Directors of Ganesh Housing Limited (formerly Ganesh Housing Corporation Limited) approved the audited standalone and consolidated financial results for the quarter and year ended 31 March 2026, and recommended a final dividend.
Per the company's filing: “The Board has recommended a dividend of ₹1.50 per Equity Share of ₹10 each (15%) to the shareholders of the Company for the financial year 2025-2026.”
The dividend is a final dividend and required approval by shareholders at the Annual General Meeting. The statutory auditor, M/s J.M. Parikh & Associates, issued an unmodified (clean) opinion on both the standalone and consolidated results — there are no audit qualifications. The company operates in a single reportable segment: promotion and development of real estate.
A key nuance for readers: the “15%” in the announcement is simply ₹1.50 divided by the ₹10 face value. It is a legacy way of quoting dividends in India and tells you nothing about the return on your invested capital. We unpack the real yield in the sections below.
Key Dates Timeline
Announcement Date: 29 May 2026 (Board Meeting)
Record Date: 31 August 2026 (Monday)
AGM Date: 11 September 2026 (Friday, via video conferencing)
Ex-Date: Effectively around 29 August 2026 (aligned to the record date under India's T+1 settlement; investors should confirm against the official NSE/BSE corporate-action circular)
Payment Timeline: Within 30 days of declaration at the AGM, subject to tax deduction at source
The record date of 31 August 2026 was fixed to determine which shareholders were entitled to the dividend, subject to AGM approval. Shareholders on the register as of that date, who owned the shares before the ex-date, qualified for the payout. Because the dividend was a final dividend, it required the shareholders' nod at the 35th AGM before it could be paid.
Dividend Yield Analysis
This is where most retail investors are misled. Yield is the only number that tells you what your cash actually earns. Here are the three ways to look at it — only one of them is real.
Face-Value Yield (the headline): ₹1.50 ÷ ₹10 = 15%. This is what the company quotes. It is not a return on your investment.
Real Market Yield (at CMP ~₹763): ₹1.50 ÷ ₹763 = ~0.20%. This is what your money actually earns in cash.
Yield at Announcement (~₹765 on 29 May 2026): ₹1.50 ÷ ₹765 = ~0.20%. (Announcement-date price is approximate; verify against the NSE closing price.)
The illusion multiple: the 15% headline is roughly 76 times the ~0.20% you actually receive.
To put ~0.20% in perspective: a plain savings bank account or a liquid fund pays multiples of that. Ganesh Housing is not a dividend-income stock. Its ~0.20% yield sits below the roughly 0.5% average for the real-estate sector and far below the ~1.3% top quartile of Indian dividend payers. Anyone buying this share for dividend income is misreading the “15%” label.
Dividend History Analysis
Ganesh Housing's payout record is irregular and, most recently, sharply declining. The table below shows dividends as reported per share for each financial year. Note: the company issued a 1:2 bonus (one share for every two held) in July 2016, so the pre-2016 per-share amounts are not strictly comparable to later years without adjustment.
| Financial Year | Dividend Per Share | Trend |
|---|---|---|
| FY 2025-26 | ₹1.50 | Cut (−70%) |
| FY 2024-25 | ₹5.00 | Cut (−55%) |
| FY 2023-24 | ₹11.00 | Peak |
| FY 2022-23 | ₹2.40 | Resumed |
| FY 2019-20 to FY 2021-22 | Nil | Suspended |
| FY 2018-19 | ₹0.50 | — |
| FY 2017-18 | ₹1.80 | — |
| FY 2016-17 | ₹2.00 | — |
| FY 2015-16 | ₹2.00 | Pre-bonus |
| FY 2014-15 | ₹1.73 | Pre-bonus |
The verdict on consistency: Ganesh Housing is an irregular / cyclical payer, not a consistent one. Dividends were suspended entirely for three years (FY20–FY22), then spiked to ₹11 in FY24 on the back of an exceptional profit year, and have been cut twice since. A dividend that moves from ₹11 to ₹5 to ₹1.50 in three years is tracking the swings in project-completion profits, not delivering steady income. Investors should not annualise or extrapolate the ₹1.50.
Financial Performance Analysis
FY26 was a steep down year for Ganesh Housing on both consolidated and standalone bases. Real estate revenue is recognised largely on project completion, so annual figures are lumpy — but the scale of the decline is worth understanding.
Consolidated (FY26 vs FY25)
Revenue from operations: ₹511.37 Cr vs ₹959.76 Cr (−46.7%)
Net profit (PAT): ₹316.26 Cr vs ₹598.06 Cr (−47.1%)
EPS: ₹37.93 vs ₹71.72 (−47.1%)
Standalone (FY26 vs FY25)
Revenue from operations: ₹125.34 Cr vs ₹676.29 Cr (−81.5%)
Net profit (PAT): ₹35.71 Cr vs ₹380.45 Cr (−90.6%)
EPS: ₹4.28 vs ₹45.62 (−90.6%)
Consolidated vs standalone — a critical distinction. The parent (standalone) entity barely made money in FY26 (₹35.71 Cr), and its March 2026 quarter was actually a net loss of about ₹1.47 Cr. Almost all of the group's FY26 profit came from its subsidiaries — Madhukamal Infrastructure, Gatil Properties, and Million Minds Techspace. For a group like this, the consolidated numbers are the meaningful gauge of dividend capacity, because the standalone parent alone could not comfortably support the payout from its own current-year cash generation. The five-year profit trend remains strong (Screener notes ~51.6% CAGR over five years), which is why one weak year should be read as cyclicality, not collapse.
Cash Flow Analysis
Reported profit is an accounting opinion; cash is fact. This is the most revealing section of the report, and it contains the single largest divergence in the results.
Consolidated operating cash flow: +₹212.80 Cr (healthy, ~67% of PAT)
Standalone operating cash flow: −₹16.50 Cr (negative — the parent's operations consumed cash in FY26, versus generating +₹316.85 Cr the year before)
Consolidated capex (fixed assets + capital work-in-progress): ~₹183.29 Cr
Consolidated free cash flow (OCF − capex): ~₹29.51 Cr
Dividend outflow (₹1.50): ~₹12.51 Cr — covered ~2.4x by FCF
The key finding: the standalone parent's operating cash flow turned negative in FY26, while the consolidated group still generated healthy operating cash of ₹212.80 Cr. The dividend is therefore funded not by the listed parent's own operations but by the group's aggregate cash generation. On top of this, the group deployed a very large ₹387 Cr in movement of loans and advances and about ₹183 Cr of capex during the year — a business in heavy investment mode. The reduced ₹1.50 dividend is best read as management conserving cash for that investment cycle rather than a sign of distress: on a consolidated basis, the small payout is still comfortably covered by free cash flow.
Balance Sheet Strength
Ganesh Housing was long described as “almost debt free.” That description is now out of date, and it is one of the most important shifts in the FY26 accounts.
Consolidated borrowings: ₹304.88 Cr (FY26) vs ₹27.42 Cr (FY25) — a jump of over 10x (+₹277 Cr)
Standalone borrowings: ₹280.59 Cr vs ₹6.52 Cr a year earlier
Net debt (consolidated): ~₹246 Cr
Gross debt-to-equity: ~0.13x (still low relative to equity of ~₹2,331 Cr)
Consolidated cash & equivalents: fell from ~₹121.1 Cr to ~₹7.4 Cr
Cash + other bank balances (liquid): ~₹58.8 Cr
Capital work-in-progress: rose to ₹539.50 Cr (from ₹359.82 Cr)
Loans given (current asset): ~₹957 Cr
What this means: the company drew down cash and took on fresh debt to fund a large build-out — capital work-in-progress rose by roughly ₹180 Cr and hundreds of crore moved into loans and advances. Debt is up sharply in absolute terms, but against equity of ~₹2,331 Cr the leverage is still modest (D/E ~0.13x). The balance sheet has moved from “fortress” to “investing with borrowed money.” That is a normal choice for a developer entering a capex-heavy phase, but it is a genuine change of posture that dividend-focused readers should register, and it directly explains why the payout was trimmed.
Dividend Sustainability Analysis
We test the ₹1.50 dividend against four coverage measures on a consolidated basis. The dividend is small relative to profits, so the affordability tests pass easily — the real risk is not affordability but predictability.
Test 1 — Earnings coverage: EPS ₹37.93 ÷ DPS ₹1.50 = 25.3x. Pass.
Test 2 — Operating cash flow coverage: consolidated OCF ₹212.80 Cr ÷ ₹12.51 Cr = 17.0x. Pass.
Test 3 — Free cash flow coverage: FCF ₹29.51 Cr ÷ ₹12.51 Cr = 2.4x. Pass, but the thinnest of the four.
Test 4 — Liquidity coverage: liquid ₹58.8 Cr ÷ ₹12.51 Cr = 4.7x. Pass.
Verdict: Moderately Sustainable. At just ~4% of consolidated profit and covered several times over by cash flow, the ₹1.50 dividend is easily affordable and is unlikely to be cut to zero. However, the amount is highly variable — it has already been cut two years running — because it floats on lumpy project-completion earnings and is being managed down while the company invests. Retail investors should treat the dividend as affordable but unpredictable in size, not as a dependable, growing income stream.
Peer Comparison
Real estate is a low-yield sector overall, but Ganesh Housing sits at the bottom of even that low range on dividend yield. The nearest comparable is fellow Ahmedabad-based developer Arvind SmartSpaces. Figures below are approximate and drawn from public data around mid-2026.
| Company | Dividend Yield | Payout Ratio | Notes |
|---|---|---|---|
| Ganesh Housing | ~0.20% | ~4% (cons) | Cut 3 years running |
| Arvind SmartSpaces | ~0.4–1.0% | ~25% | Ahmedabad peer, higher ROE |
| Mahindra Lifespace | ~0.7% | ~66–71% | Higher payout discipline |
| Oberoi Realty | ~0.49% | ~14% | Pays quarterly |
| DLF | ~0.75% | — | Sector leader |
| Godrej Properties | 0.00% | Nil | Reinvests fully |
The takeaway: at ~0.20%, Ganesh Housing yields below the ~0.5% realty-sector average and materially less than peers such as Mahindra Lifespace, Oberoi Realty and DLF. Its payout ratio of ~4% (consolidated) is also among the lowest — the company keeps far more of its profit than most listed peers. This reinforces that Ganesh Housing is a growth / development play, not an income stock.
Promoter Impact Analysis
Promoter holding: ~73.06%
FII holding: ~0.64%
DII holding: ~0.34%
Public & others: ~25.96%
Total dividend outflow: ~₹12.51 Cr
Promoter share of dividend: ~₹9.14 Cr (73.06%)
Public + institutional share: ~₹3.37 Cr
With a promoter family holding of about 73% (the Patel family, led by MD & CEO Shekhar G. Patel, individually holds ~35%), roughly three of every four rupees of this dividend flows to the promoters — about ₹9.14 Cr. This is not unusual for a promoter-heavy company, and here it cuts both ways: the promoters bear most of the “cost” of the payout, but they also decided to reduce it. The fact that the dominant shareholders chose a smaller dividend, keeping cash inside the business for capex, suggests the reduction is a deliberate capital-allocation choice rather than an involuntary squeeze.
Taxation Analysis
Since the Dividend Distribution Tax was abolished in 2020, dividends are taxable in the hands of shareholders at their applicable income-tax slab rate. There is no separate concessional rate for dividends.
Slab-rate tax: the full dividend is added to your total income and taxed at your slab.
TDS (Section 194): 10% is deducted at source only if your total dividend from a single company exceeds ₹10,000 in the financial year (this threshold was raised from ₹5,000 with effect from FY 2025-26).
No PAN: TDS rises to 20%. Non-residents: ~20% under Section 195, subject to DTAA relief.
Worked example — Ganesh Housing (₹1.50/share)
1,000 shares: gross dividend = ₹1,500. Below the ₹10,000 threshold, so no TDS. You receive the full ₹1,500, then pay slab tax when you file.
At a 30% slab (+4% cess): tax = ₹468 on ₹1,500; net income = ~₹1,032. Post-tax cash yield falls to roughly 0.14%.
Illustration of the protocol's standard example (₹10/share, 1,000 shares, 30% slab):
Gross dividend = ₹10,000. Because this equals the threshold and does not exceed it, no TDS applies; had it been ₹10,001, TDS of ~₹1,000 (10%) would apply. At a 30% slab plus 4% cess, tax = ₹3,120, leaving net income of ₹6,880 — an effective retention of 68.8%. The lesson is the same: for a high-slab investor, roughly a third of any dividend is lost to tax, which makes a ~0.20% pre-tax yield even thinner after tax.
Key Risks
1. Lumpy, project-linked earnings. Revenue and profit nearly halved on a consolidated basis in FY26 (and fell 80–90% at the standalone parent) because real-estate income is recognised on project completion. Earnings — and therefore the dividend — can swing violently year to year.
2. Sharp rise in debt. Consolidated borrowings jumped from ~₹27 Cr to ~₹305 Cr in a single year, and cash fell from ~₹121 Cr to ~₹7 Cr. Rising interest costs would eat into future distributable profit if the debt is not repaid on schedule.
3. Declining dividend trajectory. The payout has been cut three years in a row (₹11 → ₹5 → ₹1.50). There is no guarantee the dividend stabilises or grows from here.
4. Weak standalone cash generation. The listed parent's operating cash flow was negative in FY26; the group leans on subsidiaries for cash, which adds a layer of structural complexity for minority shareholders.
5. Large intra-group loans and advances. Roughly ₹957 Cr sits as loans given, with ~₹387 Cr of movement during FY26. The quality, terms and recoverability of these advances directly affect group cash and future payout capacity.
6. Geographic and cyclical concentration. The business is concentrated in the Ahmedabad / Gujarat real-estate market and is fully exposed to the property cycle, interest rates and regulatory (RERA) conditions.
What To Monitor
1. New project launches & bookings. For a developer, pre-sales, booking value and collections are the leading indicators of future revenue — watch the One Thaltej and Million Minds Techspace ramp-ups and expected lease rentals.
2. Debt trajectory. Track whether consolidated borrowings stabilise or keep climbing, and whether cash is rebuilt as projects complete and monetise.
3. Standalone cash conversion. Watch for the parent's operating cash flow to return to positive as completed projects are recognised.
4. Capital work-in-progress conversion. The ~₹539 Cr in CWIP should convert into revenue-generating, saleable or leasable assets; delays would pressure both earnings and future dividends.
5. Dividend policy signals. Watch management commentary and future declarations to see whether ₹1.50 is a new floor or a further step down — and whether payout is rebuilt once the capex cycle eases.
6. Recoverability of loans & advances. Monitor the large inter-corporate loans on the balance sheet and any related-party transaction approvals (RPTs of up to ~₹1,600 Cr were tabled at the AGM).
Conclusion
Ganesh Housing's ₹1.50 “15%” final dividend for FY26 is a textbook case of the face-value illusion: the headline percentage is roughly 76 times the ~0.20% cash yield an investor actually earns. On the positive side, the dividend is tiny relative to profit (~4% consolidated payout), covered ~2.4x by free cash flow and ~4.7x by liquidity, so it is genuinely affordable and unlikely to disappear.
The negatives are equally clear. This is the third consecutive annual cut (₹11 → ₹5 → ₹1.50); FY26 revenue and profit nearly halved on a consolidated basis; the standalone parent's operating cash flow turned negative; and borrowings rose more than tenfold to ~₹305 Cr while cash collapsed to ~₹7 Cr as the company poured money into capital work-in-progress and loans. The story is a growth-stage developer trimming its dividend to fund an investment cycle, not an income stock.
For anyone weighing this share on its dividend, the message is simple: the ~0.20% real yield is negligible and the amount is unpredictable. The positives (affordability, low leverage relative to equity, a strong five-year profit CAGR) and the negatives (declining payout, sharply higher debt, weak standalone cash) are laid out above so you can decide for yourself.
Frequently Asked Questions
What dividend has Ganesh Housing announced for FY 2025-26?
What is the real dividend yield of Ganesh Housing?
What was the record date for the Ganesh Housing dividend?
What was the ex-date for this dividend?
When will the dividend be paid?
Who was eligible to receive the dividend?
How is this dividend taxed?
Is the Ganesh Housing dividend sustainable?
What is Ganesh Housing's dividend history?
Why was the dividend cut so sharply this year?
How does Ganesh Housing's yield compare with peers?
How much of the dividend goes to promoters?
Is the difference between standalone and consolidated results important?
What should investors monitor going forward?
Disclaimer
This article is for informational and educational purposes only and does not constitute investment, financial, legal or tax advice, nor a recommendation to buy, sell or hold any security. ShareBazaar Online is not a SEBI-registered investment adviser. Figures relating to the dividend are drawn from the company's exchange filing; market prices, yields, peer data and shareholding are sourced from publicly available third-party data and are approximate and subject to change — the announcement-date price and ex-date in particular should be verified against official NSE/BSE records. All computed ratios are estimates based on reported financials. Investing in equities involves risk, including possible loss of capital. Please conduct your own research and consult a qualified, SEBI-registered financial adviser before making any investment decision.