
Dividend Snapshot
Page Industries Limited (NSE: PAGEIND, BSE: 532827, ISIN: INE761H01022) — the exclusive Indian licensee of the Jockey and Speedo brands — has declared its 1st Interim Dividend for FY2026-27 of ₹200 per equity share. On the ₹10 face value, that headline reads as a 2,000% dividend. But measured against the real market price (around ₹35,365), the yield on this single interim payout is only about 0.57%. This gap between the face-value percentage and the actual cash-on-price return is the first thing every investor should understand.
Dividend Per Share (1st Interim FY27)
₹200
Dividend Type
Interim Dividend
Yield on Market Price (this interim)
~0.57%
Face Value
₹10
Record Date
19 Aug 2026
Payment Date
On/before 11 Sep 2026
Total Dividend Outflow
~₹223 Cr
Financial Year
FY2026-27
Dividend Announcement Summary
At its board meeting on 13 August 2026 (which ran from 12:45 PM to 2:25 PM), the Board of Directors of Page Industries approved the unaudited financial results for the quarter ended 30 June 2026 and declared a 1st Interim Dividend of ₹200 per equity share for the financial year 2026-27. Because this is an interim dividend, it is declared and paid on the board's own authority and does not require separate shareholder approval at the AGM — unlike a final dividend, which the board only recommends.
What was announced
A cash interim dividend of ₹200 per share on a face value of ₹10. Across roughly 1.12 crore shares outstanding, this translates to a cash outgo of about ₹223 crore.
Approval status
As an interim dividend, it is already declared and payable. No AGM ratification is needed for the interim itself. The record date of 19 August 2026 has already passed, so eligibility has been determined.
Key Dates Timeline
Announcement Date
13 August 2026
Board meeting and dividend declaration.
Ex-Date
19 August 2026 (inferred)
Under India's T+1 settlement, the ex-date typically aligns with the record date. Confirm against the official NSE/BSE corporate-action circular.
Record Date
19 August 2026
Shareholders on the register on this date qualified for the dividend.
Payment Date
On or before 11 September 2026
The company committed to crediting the dividend by this date.
Dividend Yield Analysis
The ₹200 = 2,000% headline is calculated on the ₹10 face value, not on what you actually pay for the share. Page Industries trades near ₹35,000+, so the true cash return is a tiny fraction of that percentage. Below is the reality check.
Yield on this single interim
₹200 ÷ latest price of ~₹35,365 = ~0.57%. On the announcement-day close of ₹36,520, it was ~0.55%.
Trailing 12-month yield
Page paid ₹600 per share across FY2025-26 (four dividends). On the current price that trailing yield is ~1.70% — a more meaningful figure than any single interim.
Why the yield looks modest
This is a classic high-price, high-payout, low-yield stock. The absolute rupee dividend is large, but the share price is so high that the percentage return stays low. The yield reflects a premium, growth-priced consumer stock, not the "2,000%" impression.
The face-value illusion
Never compare a "1,500%" or "2,000%" dividend across companies with different face values. Always convert to rupees per share ÷ market price. That single step strips away the illusion.
Dividend History Analysis
Page Industries is a long-standing, generous dividend payer that typically distributes three to four dividends every financial year. Its per-share payout has grown dramatically over a decade — but the path has not been a straight line up. Independent trackers note the company has trimmed its payout in at least one year over the past decade, so it is best described as a consistent but variable payer rather than a smoothly rising one.
| Financial Year | Total Dividend / Share | Note |
|---|---|---|
| FY2026-27 (in progress) | ₹200 (1st interim so far) | This announcement |
| FY2025-26 | ₹600 | Four dividends (incl. ₹125 interim, Feb 2026) |
| FY2024-25 | ~₹750–₹820 | Varies by data source / bucketing |
| Peak year (recent) | ~₹900 | Highest full-year payout in recent history |
| FY2014-15 (base) | ~₹60–₹72 | ~19–29% annualised growth since, per trackers |
Aggregators bucket the "final" dividend (declared in one year, paid in the next) differently, so full-year totals can differ by one payment. Figures marked "~" or "varies" should be verified against the official BSE/NSE dividend records before publication.
Consistency
A multi-year payer that has never missed distributing to shareholders in recent memory, and one of the few consumer names paying multiple times a year.
The caution
Payouts flex with earnings and management's cash-return stance. A record year is not guaranteed to repeat, and past reductions mean the dividend should not be treated as a fixed, bond-like income.
Financial Performance Analysis
Here is the forensic finding that standard coverage misses. In Q1 FY27 (quarter ended 30 June 2026), revenue rose but profit fell. Revenue from operations grew +7.9% year-on-year to ₹1,420 crore, yet net profit declined ~4% to ₹193 crore. That is negative operating leverage — the business sold more but kept less.
| Metric (Q1) | FY27 (Jun-26) | FY26 (Jun-25) | Change |
|---|---|---|---|
| Revenue from operations | ₹1,420.5 Cr | ₹1,316.6 Cr | +7.9% |
| Total expenses | ₹1,172.5 Cr | ₹1,061.2 Cr | +10.5% |
| Profit before tax | ₹258.6 Cr | ₹270.2 Cr | -4.3% |
| Net profit (PAT) | ₹192.8 Cr | ₹200.8 Cr | -4.0% |
| Basic EPS (not annualised) | ₹172.86 | ₹180.02 | -4.0% |
Where the margin went
Expenses grew faster than sales. Purchases of traded goods jumped +17.3%, other expenses +9.8%, and employee cost +6.7% — all outpacing the 7.9% revenue growth. Operating EBITDA margin compressed from about 22.4% to 20.4% (roughly 200 basis points).
Other income also fell
Other income dropped ~28% (from ₹14.8 Cr to ₹10.6 Cr), removing a small cushion. For full-year FY26, the company earned ₹763.8 Cr net profit on revenue of ₹5,246.8 Cr, with EPS of ₹684.81.
Cash Flow Analysis
Reported profit is an opinion; cash is a fact. On the cash side, Page Industries is fundamentally strong — but with a history of lumpy working-capital swings that investors should understand. The company does not disclose a quarterly cash flow statement in this results filing, so the figures below are drawn from its annual accounts (standalone).
Operating cash flow is generally robust
Reported operating cash flow was roughly ₹1,203 Cr in FY25 and ₹1,080 Cr in FY24 — comfortably above reported profit, a sign of high-quality earnings in those years.
But it has been volatile before
In FY23, operating cash flow collapsed to roughly zero (about –₹1 Cr) despite healthy reported profit, driven by an inventory build-up. Page's cash generation can lurch with the working-capital cycle, so a single strong year should not be read as a permanent trait.
How this dividend is funded
The ₹223 Cr interim is funded from current earnings and accumulated reserves, not from borrowings or asset sales. FY25 operating cash flow alone covered this single interim about 5.4 times over.
Latest FCF figure
A precise, source-verified free cash flow number for FY26 is Not Disclosed by Company in this filing. Given modest capex needs (a garments business), FCF has historically tracked close to operating cash flow.
Balance Sheet Strength
Page Industries carries an exceptionally strong, effectively debt-free balance sheet — the single biggest reason its large dividends are affordable. It holds more cash than total debt, and most of its reported "debt" is lease liabilities rather than borrowings.
Cash & investments
~₹507 Cr
Total debt (mostly leases)
~₹268 Cr
Net position
Net cash (~₹239 Cr)
Interest coverage
~200x
Return on Equity (ROE)
~52.5%
Return on Capital Employed (ROCE)
~62%
ROE/ROCE and cash/debt figures are from third-party financial databases (Screener.in, ValueResearch, Simply Wall St) and reflect the latest available annual accounts; ROCE estimates range roughly 62–74% across sources.
Dividend Sustainability Analysis
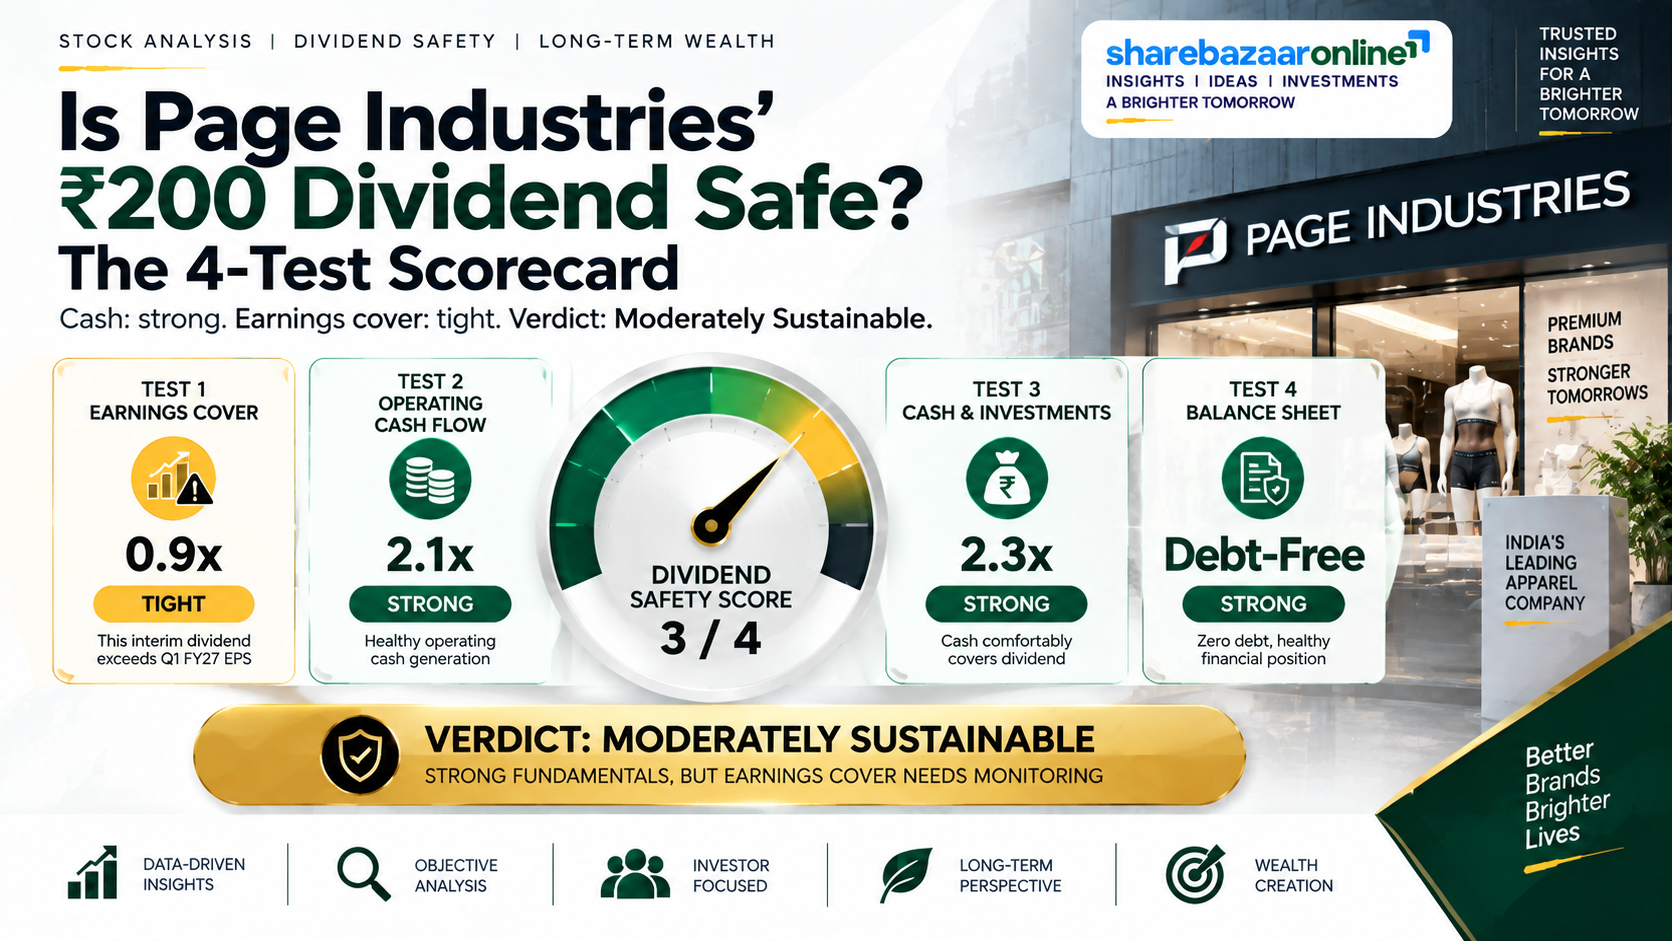
We score sustainability on four tests: earnings coverage, operating-cash-flow coverage, free-cash-flow coverage, and liquidity. Page passes the cash and liquidity tests comfortably, but the earnings-coverage test is tight because payouts run high relative to profit.
Earnings coverage — tight
This single ₹200 interim exceeds Q1 EPS of ₹172.86. Coverage is ~0.86x — below 1, meaning one quarter's earnings did not fully cover it. On a full-year FY26 basis, the ₹600 payout was 87.6% of EPS (coverage ~1.14x). Page routinely runs an 80–110% payout ratio.
Cash coverage — strong
Cash and investments of ~₹507 Cr cover this interim ~2.3x; FY25 operating cash flow covered it ~5.4x.
Balance-sheet test — strong
Net cash, ~200x interest cover, no debt being raised to fund distributions.
Verdict
Moderately Sustainable. The dividend is well supported by cash and a debt-free balance sheet, but the high payout ratio leaves limited earnings headroom — distributions will likely rise and fall with profit rather than climb every year.
Peer Comparison
Within the branded apparel and innerwear space, Page stands out for pairing very high return ratios with a genuinely high payout ratio. Most listed peers either yield less or return far less of their profit.
| Company | Approx. Dividend Yield | Approx. Payout | Profile |
|---|---|---|---|
| Page Industries | ~1.7% (TTM) | ~80–110% | Debt-free, ROE ~52%, premium Jockey/Speedo licensee |
| Vedant Fashions (Manyavar) | ~1.3% | ~50% | Ethnic wear, high margins, lower payout |
| Lux Industries | ~0.1% | ~5% | Mass innerwear, minimal dividend, reinvests profit |
Peer yields and payout ratios are from third-party databases (Simply Wall St, INDmoney) and move with share prices; treat as indicative. Other innerwear peers (Rupa, Dollar Industries) are typically low-yield reinvestors.
Promoter Impact Analysis
The promoter group (the Genomal family) holds roughly 42.89% of Page Industries. On a ₹223 crore interim outflow, promoters collectively receive an estimated ₹95.7 crore in cash. This is normal for a promoter-heavy company, but worth quantifying: the largest single beneficiary group is the founding family.
Promoter holding
~42.89%
Estimated promoter dividend income: ~₹95.7 Cr. Promoter stake has eased ~3.2 percentage points over three years.
Institutions & public
DII ~33.6%; FII + public ~23.5%
Domestic institutions receive ~₹75 Cr; FIIs and the public share the remaining ~₹52 Cr. The exact FII/public split should be confirmed from the latest BSE/NSE shareholding filing.
Minority shareholder view
Because the dividend is paid uniformly per share, minority investors receive the same ₹200 per share as promoters. High payouts do return cash to all shareholders proportionately.
Alignment point
With a large promoter stake, the family has a direct incentive for generous distributions. Investors comfortable with that alignment benefit; those preferring aggressive reinvestment may view the high payout differently.
Taxation Analysis
Since the Dividend Distribution Tax was abolished in FY2020-21, dividends are fully taxable in the shareholder's hands at their applicable income-tax slab rate, reported under "Income from Other Sources." For FY2026-27, the key rules are below.
Slab-rate tax
The dividend is added to your income and taxed at your slab — 0%, 5%, 20% or 30% (plus applicable cess/surcharge). There is no special flat rate for dividends.
TDS rule (Section 194)
The company deducts 10% TDS if your total dividend from Page in the financial year exceeds ₹10,000. No PAN means 20%. NRIs face 20% under Section 195 (or a lower DTAA rate). At ₹200/share, holding 50+ shares already crosses the ₹10,000 threshold.
Worked example — Page-specific (100 shares, 30% slab)
Gross dividend = 100 × ₹200 = ₹20,000. Since this exceeds ₹10,000, TDS at 10% = ₹2,000, so you receive ₹18,000 in your bank. At a 30% slab, total tax = ₹6,000 (the ₹2,000 TDS is a credit; you pay the ₹4,000 balance at filing). Net after-tax dividend = ₹14,000, an effective post-tax cash yield of about 0.40% on the current share price.
Worked example — standard template (1,000 shares, ₹10/share, 30% slab)
Gross dividend = 1,000 × ₹10 = ₹10,000. As this does not exceed ₹10,000, no TDS applies. At a 30% slab, tax = ₹3,000, leaving a net dividend of ₹7,000. (This illustrative template uses ₹10/share; Page actually pays ₹200/share.)
Note: From 1 April 2026, the earlier Section 57 deduction for interest on money borrowed to buy shares has been withdrawn for dividend income, so for FY2026-27 no expense deduction is generally available against the dividend. TDS is only tax deducted at source — it is adjusted against your final liability, not an extra tax. Always report the gross dividend in your return.
Key Risks
1. Margin compression is already visible
Q1 FY27 showed revenue up 7.9% but PAT down 4%, with expenses (traded goods +17.3%, other expenses +9.8%) outpacing sales. If cost pressure persists, profit — and therefore future payouts — could stay under pressure.
2. High payout leaves little earnings buffer
With payout ratios running 80–110%, a weak earnings year directly threatens the dividend. The company has trimmed payouts before.
3. Discretionary demand and competition
Innerwear and athleisure are discretionary and increasingly competitive (mass players, D2C brands, private labels). Slower volume growth would pressure both earnings and dividends.
4. Working-capital and cash-flow volatility
Operating cash flow has swung sharply before (near zero in FY23 on inventory build-up). A repeat would strain the cash available for distributions in that year.
5. Licence dependence and litigation/cost overhangs
The business runs on exclusive Jockey and Speedo licences; any change in licensing terms is a structural risk. The company has also flagged incremental labour-code costs, and a reported overseas legal claim adds a monitorable, if not yet quantified, overhang.
What To Monitor
1. Operating margin trend
Watch whether EBITDA margin recovers from the ~20% Q1 level or keeps sliding. Margin, not revenue, is the swing factor for profit and payout.
2. Volume growth in innerwear and athleisure
Track volume (not just value) growth and inventory levels each quarter as the demand-health signal.
3. Payout ratio and full-year dividend total
Compare each interim against EPS. If FY27's cumulative dividend outpaces earnings again, sustainability tightens further.
4. Operating cash flow conversion
Confirm OCF stays comfortably above net profit and doesn't relapse toward the FY23-style near-zero level.
5. Cost lines and one-off overhangs
Follow raw-material and traded-goods costs, the New Labour Codes impact, and any development on the reported overseas claim — each can move the profit and dividend picture.
Conclusion
Page Industries' ₹200 first interim dividend for FY2026-27 looks headline-grabbing at "2,000%" on face value, but the real cash yield on this single payout is only about 0.57%, and the trailing-twelve-month yield is around 1.70%. This is a high-price, high-payout, modest-yield consumer stock.
The positives are real: a debt-free, net-cash balance sheet, ROE above 50%, strong operating cash flow in most years, and a long record of returning substantial cash to shareholders. Cash and liquidity comfortably cover this dividend.
The negatives deserve equal attention: Q1 FY27 showed revenue rising but profit falling as costs outpaced sales, the payout ratio runs high (80–110%) leaving thin earnings headroom, and the company has both cut its dividend before and seen cash flow swing sharply. On our four-test framework the dividend rates Moderately Sustainable.
In short: a financially sturdy business paying a large, affordable-but-earnings-tight dividend, where the number to watch is margin, not the eye-catching face-value percentage.
Frequently Asked Questions
What dividend has Page Industries announced?
What is the Page Industries dividend yield?
What is the record date for the Page Industries dividend?
What is the ex-date for this dividend?
When will the Page Industries dividend be paid?
Who was eligible for the dividend?
How is the Page Industries dividend taxed?
How much tax will I pay on ₹20,000 of Page dividend?
Is the Page Industries dividend sustainable?
What is Page Industries' dividend history?
Why did profit fall even though revenue rose in Q1 FY27?
Does this dividend need AGM approval?
How much of the dividend goes to promoters?
What should investors monitor going forward?
Disclaimer
This article is for informational and educational purposes only and does not constitute investment, financial, legal or tax advice, nor a recommendation to buy, sell or hold any security. ShareBazaar Online is not a SEBI-registered investment adviser. Figures drawn from the company's filing are stated as disclosed; market prices, ratios, shareholding and peer data are sourced from third-party databases as of mid-September 2026 and may change. Some historical dividend totals and the ex-date are marked as approximate or inferred and should be verified against official BSE/NSE records. Taxation depends on individual circumstances and prevailing law. Please consult a SEBI-registered adviser and a qualified tax professional before making any investment decision. Investments in securities are subject to market risks.