
Dividend Snapshot – Mahanagar Gas Limited
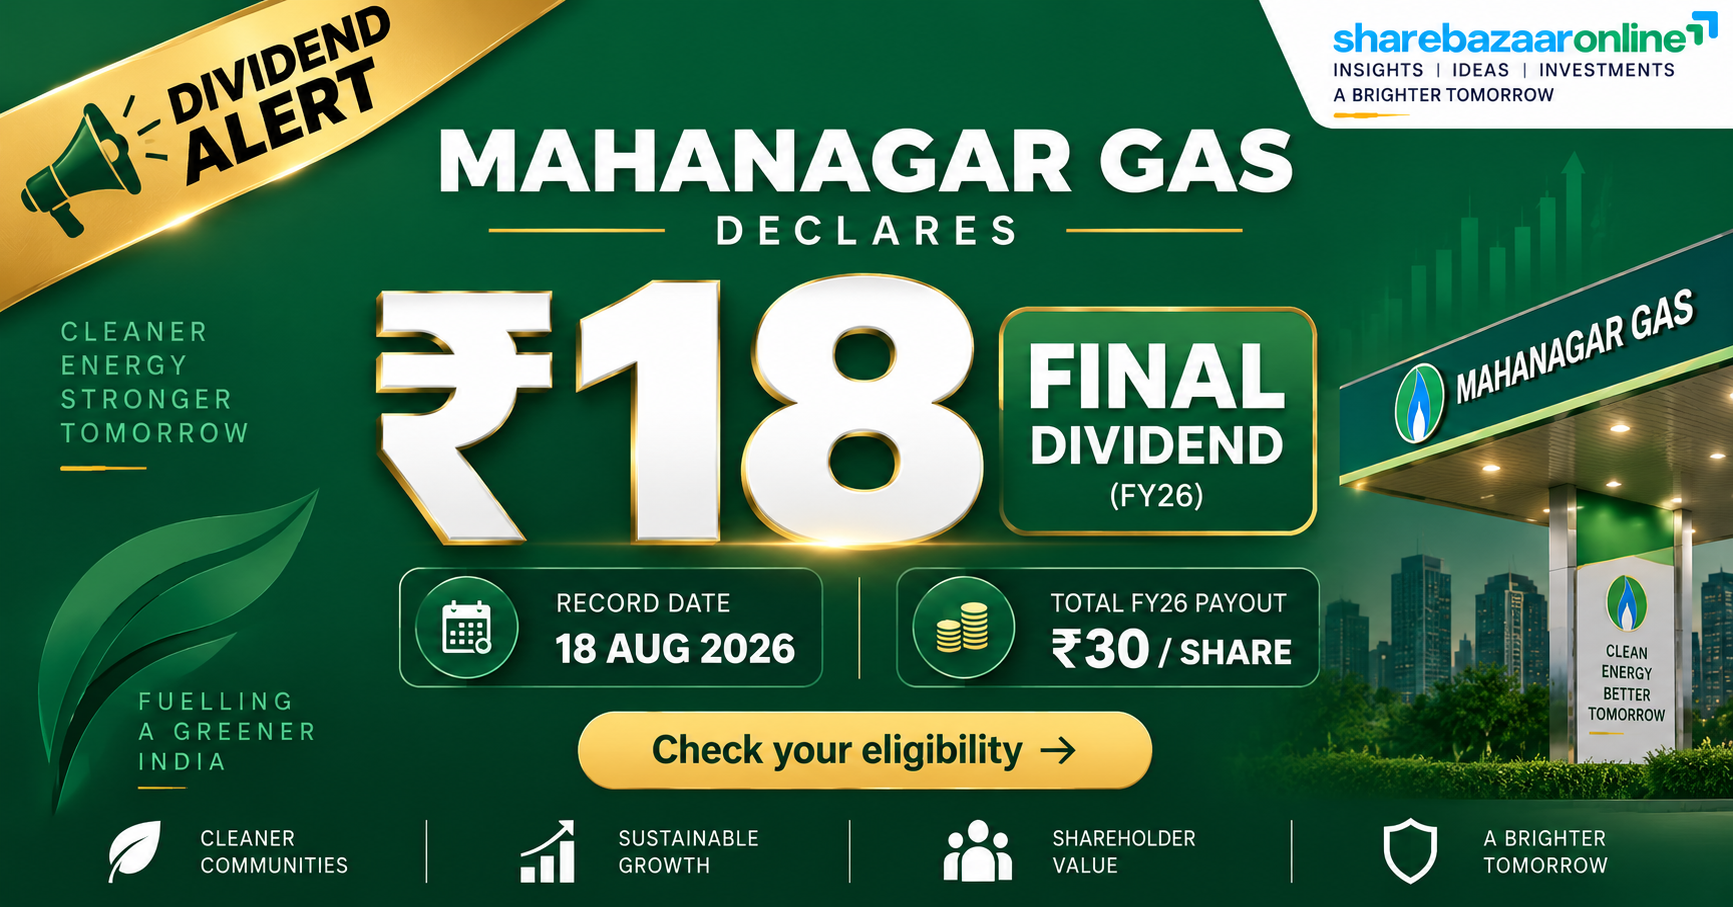
Mahanagar Gas Limited (MGL), Mumbai’s monopoly city gas distributor, has completed its FY2025-26 dividend cycle. The board recommended a final dividend of Rs 18 per equity share on 7 May 2026, taking the total Mahanagar Gas dividend for FY26 to Rs 30 per share (face value Rs 10). For retail investors researching the Mahanagar Gas dividend, the headline “300%” figure is on face value — the real, cash-in-hand yield is far lower, and the numbers below cut through that.
Current market price (CMP) of Rs 1,080 is the NSE/BSE close on 16 September 2026 (Source: Screener.in). Dividend and financial figures are from MGL’s Board Outcome filing dated 7 May 2026.
Dividend Announcement Summary – Mahanagar Gas Limited
At its board meeting held on Thursday, 7 May 2026 (1530–1715 hrs), the Board of Directors of Mahanagar Gas Limited approved the audited standalone and consolidated financial statements for the year ended 31 March 2026 and recommended a final dividend of Rs 18 per equity share of face value Rs 10 each, subject to shareholder approval.
This is in addition to the interim dividend of Rs 12 per share already declared on 7 February 2026. With this, the total MGL dividend for FY2025-26 is Rs 30 per share. The company disclosed that the final dividend would result in a cash outflow of approximately Rs 177.80 crore.
The dividend was approved by shareholders at the Annual General Meeting held on 25 August 2026. Auditors Deloitte Haskins & Sells LLP issued an unmodified (clean) opinion on both the standalone and consolidated results.
Company Identifiers
Dividend Details
Key Dates Timeline – Mahanagar Gas Limited
These are the key dates every investor tracking the Mahanagar Gas dividend record date and payment date needed to know. Because the record date of 18 August 2026 has already passed, eligibility for this final dividend is now closed.
Under India’s T+1 rolling settlement, the ex-dividend date coincides with the record date — consistent with MGL’s own history (its August 2025 dividend also had an identical ex-date and record date). Record date and AGM dates are from exchange filings (Source: TipRanks, InvestyWise). Payment date is the statutory 30-day window from the 25 August 2026 AGM.
Mahanagar Gas Limited Dividend Yield Analysis
This is the single most misunderstood number in the Mahanagar Gas dividend story. The company announces dividends as a percentage of face value (Rs 10), not of the share price. So a “300% dividend” sounds enormous but simply means Rs 30 per share. What matters to you as an investor is the dividend yield — the return on the price you actually pay.
The Face-Value Illusion
Why the Yield Looks Higher Now
MGL’s dividend yield of 2.78% is the highest in the city-gas peer group. But part of that “attractiveness” comes from a falling share price — the stock is down roughly 21% over the past year and near its 52-week low of Rs 900. A rising yield driven by a sinking price is a warning sign as much as a reward, so it must be read alongside the earnings trend discussed below.
Mahanagar Gas Limited Dividend History
Since listing in 2016, Mahanagar Gas has been a consistent dividend payer, growing its per-share payout at a compound rate of about 13% a year over nine years. The table below shows the full-year Mahanagar Gas dividend history (interim plus final, per share).
| Financial Year | Total Dividend (Rs/share) | Year-on-Year Change |
|---|---|---|
| FY2016-17 | 10.0 | — |
| FY2017-18 | 19.0 | +90% |
| FY2018-19 | 20.0 | +5% |
| FY2019-20 | 35.5 | +77% |
| FY2020-21 | 23.0 | -35% |
| FY2021-22 | 25.0 | +9% |
| FY2022-23 | 26.0 | +4% |
| FY2023-24 | 28.0 | +8% |
| FY2024-25 | 30.0 | +7% |
| FY2025-26 | 30.0 | 0% |
What the Trend Tells Us
The FY20 spike (Rs 35.5) included a one-time special/enhanced payout; the FY21 “cut” is simply the base normalising after that. Barring that, MGL has raised or held its dividend every year. Crucially, FY26’s Rs 30 is flat versus FY25 — the first time in years the dividend has not grown, mirroring the profit decline.
Payer Classification
Consistent Payer. No dividend suspensions, no missed years since listing. However, the FY26 freeze signals that management is becoming more cautious as earnings soften — a shift worth watching.
Mahanagar Gas Limited Financial Performance Analysis
Here lies the real Mahanagar Gas dividend story that headline reports miss: revenue rose but profit fell sharply. This is a textbook case of operating leverage working in reverse — margin compression eating into earnings even as the top line grows.
| Metric (Standalone) | FY2025-26 | FY2024-25 | Change |
|---|---|---|---|
| Net Revenue from Operations | Rs 8,240 Cr | Rs 7,261 Cr | +13.5% |
| EBITDA | Rs 1,451 Cr | Rs 1,570 Cr | -7.6% |
| Profit After Tax (PAT) | Rs 846.82 Cr | Rs 1,041.26 Cr | -18.7% |
| EPS | Rs 85.73 | Rs 105.41 | -18.7% |
The Margin Squeeze
Revenue grew because gas volumes and prices rose, but the cost of natural gas purchased climbed faster, compressing margins. Standalone EBITDA margin fell, and the pain intensified late in the year: Q4FY26 EBITDA margin collapsed to 12.69% from 17.10% in Q3, and Q4 PAT fell 34.68% quarter-on-quarter.
Why It Matters for the Dividend
A flat Rs 30 dividend on an 18.7% lower profit means the payout ratio has risen. The dividend is still comfortably covered by earnings (2.86x), but the direction of travel — softer margins, a regulated price environment — is what determines whether future increases are affordable.
Mahanagar Gas Limited Cash Flow Analysis
Reported profit is an accounting opinion; cash is a fact. On cash, MGL sends a mixed message: operating cash flow is strong, but free cash flow is thin because the company is spending heavily on expanding its pipeline network.
Cash Flow Snapshot (Standalone FY26)
How Is the Dividend Funded?
Operating cash flow easily covers the dividend (3.87x). But after heavy capex, free cash flow of just Rs 86 crore covers barely 0.29x of the Rs 296 crore dividend outflow.
In plain terms: MGL is funding its dividend from operating cash and its large cash/investment reserves, not from surplus free cash, because it is reinvesting almost all its operating cash back into network expansion. This is sustainable while the balance sheet is strong — but it is not a “dividend funded entirely by spare cash” situation.
Receivables Check
Trade receivables rose to Rs 458 crore (from Rs 363 crore), and debtor days edged up to about 20 from 18. This is a modest, controlled increase rather than a red flag — cash generated from operations of Rs 1,413 crore tracked reported profit closely, confirming earnings are backed by real cash.
Mahanagar Gas Limited Balance Sheet Strength
A dividend is only as safe as the balance sheet behind it. On this test, Mahanagar Gas is on very solid ground — it is effectively debt-free and sits on a large cash-and-investments cushion.
Key Balance Sheet Items (Standalone, Mar 2026)
Debt & Returns
The only items on the “borrowings” line are lease liabilities of about Rs 219 crore — MGL carries no meaningful interest-bearing debt. Its cash and investments alone could fund more than four years of the current dividend. Debt is not rising to pay dividends. Source for CMP-derived ratios: Screener.in.
Mahanagar Gas Limited Dividend Sustainability Analysis
We score dividend sustainability on four tests — earnings coverage, operating cash coverage, free cash flow coverage, and liquidity. MGL passes three comfortably and fails one, which shapes the final verdict.
Verdict: Moderately Sustainable
The Mahanagar Gas dividend is well covered by profits, operating cash and reserves, and the company is debt-free — so there is no near-term threat to the payout. The one caveat is that free cash flow does not cover the dividend because of heavy capex, and earnings are declining. The dividend is safe today, but future growth in the payout depends on margins recovering. We classify it Moderately Sustainable.
Mahanagar Gas Limited Peer Comparison
Against its city gas distribution (CGD) peers — Indraprastha Gas (IGL), Gujarat Gas and Adani Total Gas (ATGL) — Mahanagar Gas stands out as the highest-yielding, lowest-valued name in the group.
| Company | Dividend Yield | P/E | ROE |
|---|---|---|---|
| Mahanagar Gas (MGL) | 2.78% | 14.9 | 12.2% |
| Indraprastha Gas (IGL) | ~0.9–1.0% | 15.4 | 13.5% |
| Gujarat Gas | ~1.5% | — | — |
| Adani Total Gas (ATGL) | ~0.05% | ~110 | 13.5% |
Yield Leader
MGL offers the highest dividend yield in the CGD sector at 2.78%, versus roughly 1% for IGL and a negligible yield for the high-growth, richly-valued ATGL. For an income-focused investor, MGL is the clear yield pick among city gas stocks.
The Trade-Off
That higher yield partly reflects a lower valuation and weaker recent price performance. IGL earns a slightly higher ROE; ATGL is priced for rapid geographic expansion. MGL is the mature, cash-rich, slower-growth income name.
Peer figures are indicative and vary by source and date (Source: Screener.in, Univest, Wisesheets, as of Aug–Sep 2026). Peer yields in particular fluctuate with share prices and interim/final dividend timing.
Mahanagar Gas Limited Promoter Impact Analysis
Who actually receives this Rs 296 crore dividend? With promoters holding 32.50% of Mahanagar Gas, roughly a third of every rupee distributed flows to the promoter group, which includes GAIL (India) and the Government of Maharashtra.
Dividend Distribution (Total FY26 Outflow Rs 296.34 Cr)
Shareholding Pattern (Jun 2026)
Minority-shareholder view: because MGL pays a uniform per-share dividend, all shareholders are treated equally — the majority of the payout (Rs 200 crore, or 67.5%) goes to public and institutional investors. A meaningful Rs 200 crore returns to non-promoter shareholders, which is a genuine benefit for retail holders rather than a promoter-skewed distribution.
Mahanagar Gas Limited Taxation Analysis
Since April 2020, dividends in India are taxed in the hands of the investor at their income-tax slab rate — there is no separate dividend distribution tax paid by the company anymore. Understanding this is essential before you treat the Mahanagar Gas dividend as “income”.
The Rules in Brief
Dividend income is added to your total income and taxed at your slab rate (5%, 20% or 30% plus cess).
TDS: the company deducts 10% TDS if your total dividend from that company exceeds Rs 5,000 in a financial year (20% if PAN is not provided). You can claim this TDS back against your final tax liability.
Worked Example: 1,000 Shares, 30% Slab
The lesson: a headline “300% dividend” becomes a post-tax yield of under 2% for a top-slab investor. For someone in the 5% or nil slab, the effective yield is much closer to the full 2.78%.
Key Risks for Mahanagar Gas Limited Investors
1. Margin compression from gas costs
EBITDA margin fell to 12.69% in Q4FY26 from 17.10% a quarter earlier. MGL buys gas at costs it cannot always fully pass through, and any spike in APM/spot LNG prices directly squeezes profits and the dividend’s growth capacity.
2. Regulatory / pricing risk (PNGRB & APM allocation)
Cuts to cheaper administered-price-mechanism (APM) gas allocation force MGL to buy costlier gas, hurting margins. Tariff and pricing decisions are outside the company’s control.
3. EV and alternative-fuel transition
Rising adoption of electric vehicles in Mumbai could erode long-term CNG volume growth, the core of MGL’s business.
4. Declining earnings trend
PAT fell 18.7% in FY26. If profits keep sliding, the dividend may be frozen (as in FY26) or eventually reduced, even though it is currently well covered.
5. Heavy capex limiting free cash flow
With capex of Rs 1,062 crore nearly equal to operating cash flow, free cash flow is thin (Rs 86 crore). Sustained heavy investment leaves little surplus, making the dividend reliant on reserves rather than current free cash.
What To Monitor – Mahanagar Gas Limited
1. Gross margin per unit (Rs/scm)
The clearest early signal of dividend-growth capacity. Watch whether MGL restores its spread between gas cost and selling price in coming quarters.
2. APM gas allocation percentage
Track how much of MGL’s requirement is met by cheaper administered-price gas versus costlier market-priced gas.
3. Volume growth (CNG + PNG, MMSCMD)
Total volumes were 4.672 MMSCMD in Q4FY26. Steady volume growth is what offsets margin pressure over time.
4. Dividend payout ratio trend
The payout ratio rose to 35% as profits fell. A payout climbing toward 50–60% on falling earnings would signal reduced room for future increases.
5. Capex intensity vs free cash flow
Watch whether the network expansion phase eases, which would lift free cash flow and put the dividend on a fully self-funded footing.
Conclusion – Mahanagar Gas Limited Dividend
The FY2025-26 Mahanagar Gas dividend of Rs 30 per share (Rs 18 final + Rs 12 interim) delivers the highest yield in the city-gas sector at 2.78%, backed by a debt-free balance sheet, a large cash cushion (Rs 1,283 crore), and a long record of consistent payouts.
The honest counterweight: profit fell 18.7%, margins compressed sharply into year-end, the dividend was held flat rather than raised for the first time in years, and free cash flow does not cover the payout because of heavy network capex. The dividend is safe today — but its future growth hinges on a margin recovery.
Positives: highest sector yield, debt-free, strong cash coverage, consistent payer. Negatives: declining earnings, margin squeeze, thin free cash flow, flat dividend. We present the evidence — the decision on whether MGL fits your income goals is yours.
Frequently Asked Questions
What dividend has Mahanagar Gas announced for FY2025-26?
What is the Mahanagar Gas dividend yield?
What was the record date for the Mahanagar Gas final dividend?
What was the ex-dividend date?
When will the Mahanagar Gas dividend be paid?
Who was eligible for the dividend?
How is the Mahanagar Gas dividend taxed?
Is the Mahanagar Gas dividend sustainable?
What is the Mahanagar Gas dividend history?
What should investors monitor going forward?
Why did Mahanagar Gas profit fall despite higher revenue?
How does MGL’s dividend compare with IGL and other peers?
Disclaimer
This article on the Mahanagar Gas Limited dividend is for informational and educational purposes only and does not constitute investment advice or a buy, sell, or hold recommendation. Figures are sourced from MGL’s board outcome filing dated 7 May 2026 and publicly available data (Screener.in, exchange filings, TipRanks, and others) as cited; some market-derived figures such as CMP and peer yields change daily and were current around 16 September 2026. ShareBazaar Online does not guarantee the accuracy or completeness of third-party data. Dividend decisions remain subject to the company’s disclosures. Please consult a SEBI-registered investment adviser and verify all figures against original filings before making any investment decision.