
Dividend

Syrma SGS Dividend 2026 — ₹1.50 Final Dividend, Yield, Record Date, History

Syrma SGS Dividend 2026 — ₹1.50 Final Dividend, Yield, Record Date, History

Dividend Snapshot – Syrma SGS Technology Limited

Syrma SGS Technology Limited has declared a final dividend of ₹1.50 per equity share for the financial year ended 31 March 2026 (FY26), on a face value of ₹10. Expressed on face value, that is a headline of 15% — a number that sounds large but translates into a real cash yield of roughly 0.10% at the current market price. This is the classic face-value illusion, and it is the first thing every Syrma SGS Technology dividend investor should understand before reading further.

Dividend TypeFinal Dividend
Dividend Per Share₹1.50
Face Value₹10
Dividend (% of Face Value)15%
Financial YearFY 2025–26
Real Yield (at CMP ~₹1,511)~0.10%
Record Date18 August 2026
Payment Date24 September 2026
Total Outflow~₹28.9 crore
Consolidated EPS (FY26)₹16.94

Figures sourced from the company’s Outcome of Board Meeting filing dated 11 May 2026 and audited FY26 results. Market price data from NSE/BSE via public sources (as of 16 September 2026).

Syrma SGS Technology Dividend Announcement Summary

At its board meeting held on 11 May 2026 (commenced 2:30 p.m., concluded 4:45 p.m.), the Board of Directors of Syrma SGS Technology Limited approved the audited standalone and consolidated financial results for the quarter and year ended 31 March 2026 and recommended a final dividend of ₹1.50 per equity share (15% of face value of ₹10) for FY26.

The dividend was expressly made subject to shareholder approval at the ensuing Annual General Meeting (AGM). The statutory auditors, Walker Chandiok & Co LLP, issued an unmodified (clean) audit opinion on both the standalone and consolidated results. The AGM was subsequently held on 25 August 2026, and the dividend has since been approved and paid.

A structurally important detail in the same filing: the FY26 comparatives were restated under a Scheme of Amalgamation (SGS Infosystems and SGS Tekniks merged into the company), approved by the NCLT on 7 October 2025 with an appointed date of 1 April 2023 and accounted for using the pooling-of-interest method. This means Syrma SGS Technology’s prior-year numbers were re-cast — a nuance most wire-service coverage skips entirely.

Syrma SGS Technology Dividend Key Dates Timeline

Board Meeting / Announcement11 May 2026
Record Date18 August 2026
Ex-Dividend Date18 August 2026
AGM (Approval)25 August 2026
Payment Date24 September 2026
StatusRecord date passed

Under India’s T+1 settlement cycle, the ex-date and record date fell on the same day, 18 August 2026. Investors who held Syrma SGS Technology shares as of that record date were eligible for the ₹1.50 dividend. As the record date and ex-date have now passed, this timeline is presented for reference; new buyers today do not qualify for this particular dividend.

Syrma SGS Technology Dividend Yield Analysis

The single most misleading figure in dividend reporting is the “percentage” quoted on face value. Syrma SGS Technology’s 15% dividend is calculated on the ₹10 face value, not on the market price you actually pay. Here is what the ₹1.50 dividend really yields:

Headline (on face value ₹10)15%
Yield at announcement (~₹1,070)0.14%
Yield at current price (~₹1,511)0.10%

The headline 15% is roughly 151 times the real cash yield of about 0.10%. On a ₹1 lakh investment at the current price, the annual dividend works out to under ₹100. Syrma SGS Technology is, unambiguously, a growth stock, not an income stock.

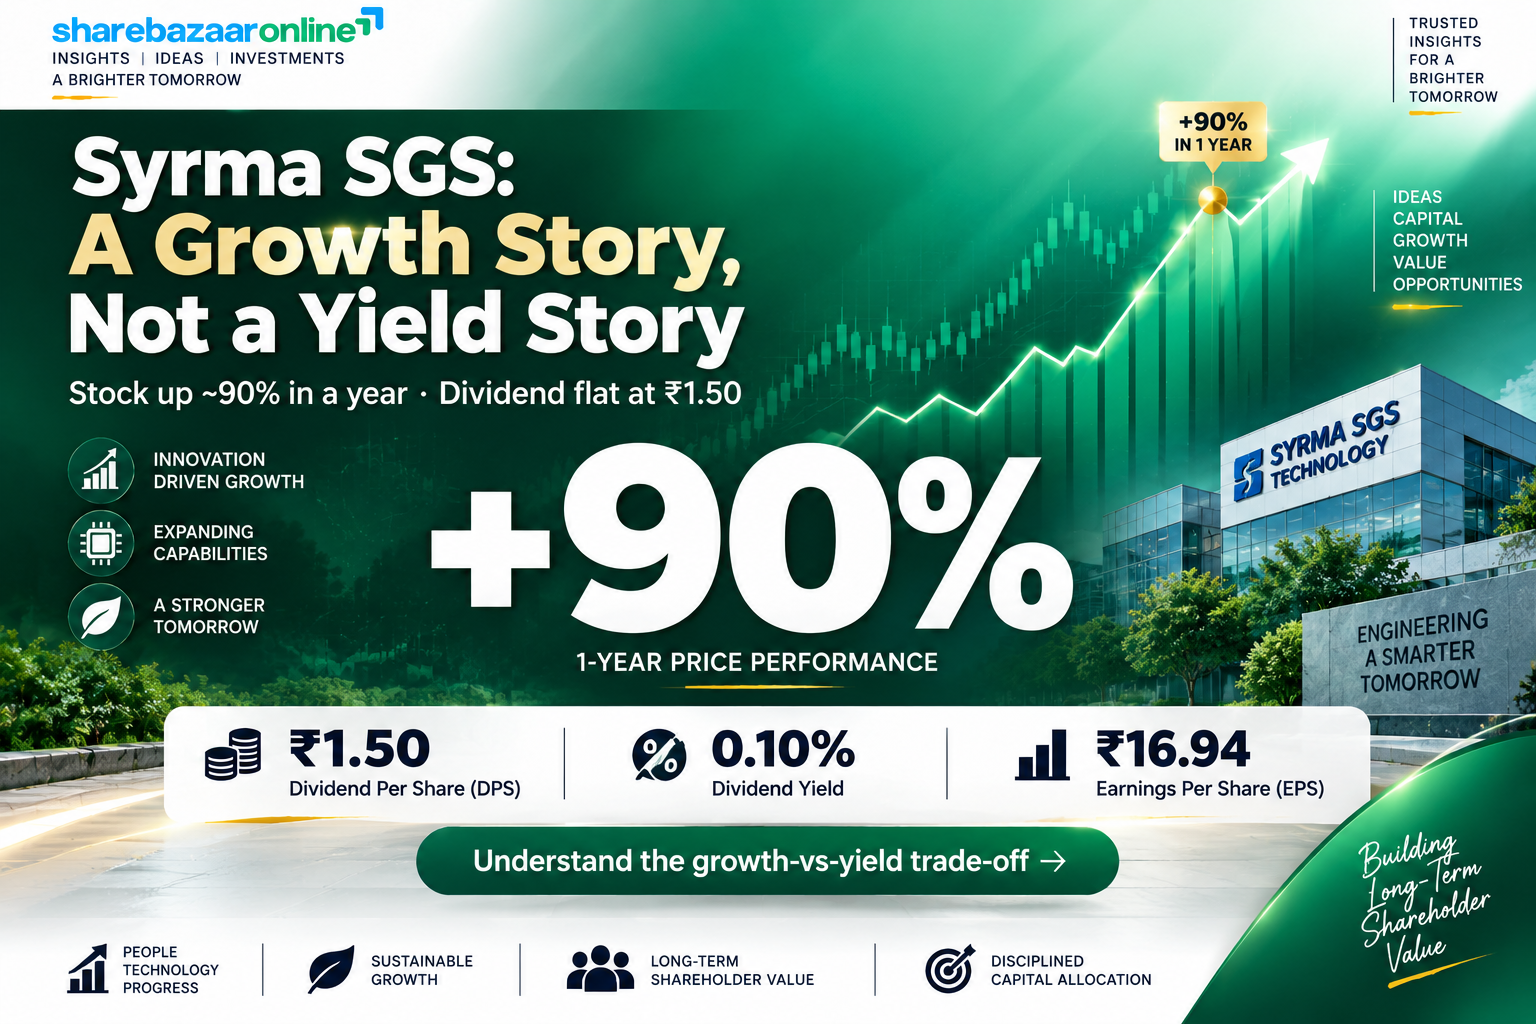
Yield reality check: the yield here is low not because of any business weakness, but because the share price has re-rated sharply upward — the stock is up over 90% in the past year — while the dividend has stayed flat at ₹1.50. A rising denominator (price) against a fixed numerator (dividend) mechanically compresses yield. This is a “good problem” yield, driven by capital appreciation rather than a distressed payout.

Syrma SGS Technology Dividend History

Financial YearDividend Per ShareTypeDividend Payout Ratio*
FY22Nil—0%
FY23₹1.50Final~22%
FY24₹1.50Final~25%
FY25₹1.50Final~16%
FY26₹1.50Final~9%

*Payout ratio on consolidated PAT. Source: company filings and Screener.in. Syrma SGS Technology listed in 2022 and began paying dividends from FY23.

The Syrma SGS Technology dividend payment history reveals the real story: the company has paid a flat ₹1.50 per share for four consecutive years (FY23–FY26), with no increase, no special dividend and no cut. Because profits have grown rapidly over the same period, the payout ratio has fallen steadily from ~22% to ~9%. Syrma SGS Technology is best classified as a consistent but token payer — reliable in frequency, but deliberately conservative in amount, prioritising reinvestment over distribution.

Syrma SGS Technology Financial Performance Analysis

Consolidated (₹ cr)FY24FY25FY26
Revenue3,1543,7874,819
Operating Profit203323546
Net Profit (total)124184346
EPS (₹)6.049.5316.94

FY26 was a breakout year for Syrma SGS Technology. Consolidated revenue rose 27.3% YoY to ₹4,819 crore, while net profit jumped 88% YoY to ₹346 crore. Over FY22–FY26 the company compounded revenue at ~40% and profit at ~45%.

Positive operating leverage: profit grew far faster than revenue in FY26 because operating margin expanded (OPM ~11% vs ~9% a year earlier) as a richer product mix — higher-margin industrial, healthcare and export/ODM work — flowed through. This is the opposite of margin compression, and it is what powered the EPS near-doubling.

Syrma SGS Technology Cash Flow Analysis

Reported profit is an opinion; cash is a fact. For an electronics manufacturing services (EMS) company that consumes working capital to grow, the cash flow statement matters more than the headline PAT.

Operating Cash Flow (FY26)₹289.6 cr
Capex (FY26)₹191.8 cr
Free Cash Flow (FY26)₹97.8 cr
Dividend Outflow₹28.9 cr

The key forensic finding: FY26 is the first year in recent memory that Syrma SGS Technology generated positive free cash flow. In FY23 and FY24 the company posted negative FCF (roughly –₹188 cr and –₹446 cr) as it ploughed cash into growth and working capital. In FY26, operating cash flow recovered strongly and FCF turned positive at ~₹97.8 crore — comfortably covering the ₹28.9 crore dividend about 3.4 times.

Receivables watch: trade receivables remain elevated (debtor days ~139), a structural feature of the EMS model where large OEM customers negotiate long credit terms. Investors should note that the dividend is genuinely funded by current operating cash flow in FY26 — not by fresh borrowing or asset sales — which strengthens its quality.

Syrma SGS Technology Balance Sheet Strength

Cash + Current Investments₹701 cr
Total Borrowings₹353 cr
Net Cash Position~₹348 cr
Gross Debt / Equity0.12x

Syrma SGS Technology ended FY26 in a net-cash position of roughly ₹348 crore, having actively reduced current borrowings during the year. A major reason the balance sheet is flush: the company raised ₹1,000 crore through a Qualified Institutional Placement (QIP) in FY26, issuing 1.43 crore shares at ₹699 each. Against that backdrop, the ₹28.9 crore dividend is a rounding error — under 3% of the QIP proceeds.

One caveat to flag: consolidated goodwill stands at ~₹455 crore (about 16% of owners’ equity), reflecting an acquisition-led strategy (Elcome, Navicom and others were consolidated during the year). Goodwill is not a cash asset; it is an accounting residue of acquisitions and would be tested for impairment if any acquired business underperforms. It does not threaten the dividend, but it is a quality-of-equity nuance worth monitoring.

Syrma SGS Technology Dividend Sustainability

Sustainability TestMetricVerdict
Earnings CoverageEPS ₹16.94 vs DPS ₹1.50 = 11.3xVery Strong
Operating Cash CoverOCF ₹289.6 cr = 10.0x outflowStrong
Free Cash Flow CoverFCF ₹97.8 cr = 3.4x outflowAdequate
Liquidity / Cash CoverCash+inv ₹701 cr = 24x outflowVery Strong

Overall verdict: Sustainable. On all four tests — earnings, operating cash flow, free cash flow and liquidity — the ₹1.50 dividend is very comfortably covered. The real question for Syrma SGS Technology is not whether the dividend is safe (it clearly is) but whether it will ever grow. With payout ratio down to ~9% and management directing capital into capacity, PCB expansion and acquisitions, the token dividend appears deliberate. Sustainability is not in doubt; income relevance is.

Syrma SGS Technology Peer Comparison

CompanyLatest DPSDividend YieldDividend Posture
Syrma SGS Technology₹1.50~0.10%Consistent token payer
Dixon Technologies₹8–10~0.05%Token payer, growing DPS
Kaynes TechnologyNil / minimal~0%Reinvests all
Amber EnterprisesNil0%Does not pay
Cyient DLM / AvalonNil / minimal~0%Reinvests all

Peer yields are indicative, from public sources; verify against latest exchange data. EMS is a low-yield, high-growth sector.

Against its EMS peers, Syrma SGS Technology actually looks relatively shareholder-friendly on dividends — several peers such as Amber, Kaynes, Cyient DLM and Avalon pay little or nothing, choosing to reinvest entirely. The takeaway is that across the entire electronics manufacturing services sector, dividends are a symbolic gesture, not an income stream. Investors buy these names for growth, order-book visibility and the “Make in India”/PLI tailwind, not for yield.

Syrma SGS Technology Promoter Impact Analysis

Promoter Holding42.28%
FII Holding7.51%
DII Holding15.90%
Public / Others~34.3%
Promoter Dividend Income~₹12.2 cr
Public Shareholders’ Share~₹9.9 cr
DII + FII Share~₹6.8 cr

Promoters, holding 42.28%, receive approximately ₹12.2 crore of the total ₹28.9 crore dividend. Two governance-relevant observations for Syrma SGS Technology dividend investors: first, promoter holding has declined over the past three years (from ~47% to ~42%), partly a consequence of the QIP and equity issuances that diluted all holders; second, the modest payout means the dividend is not a mechanism for disproportionate promoter cash extraction — the benefit is shared broadly and proportionally, with institutions (DII 15.9% + FII 7.5%) now owning a meaningful ~23% combined.

Syrma SGS Technology Dividend Taxation Analysis

Since April 2020, dividends in India are taxed in the hands of the investor at their applicable income-tax slab rate. The company no longer pays Dividend Distribution Tax. A 10% TDS applies under Section 194 only if total dividend from a company exceeds ₹5,000 in a financial year (20% if PAN is not furnished).

Worked Example — Investor Holding 1,000 Syrma SGS Technology Shares

Gross Dividend (1,000 × ₹1.50)₹1,500
TDS @ 10%Nil (below ₹5,000 threshold)
Tax @ 30% slab₹450
Net Dividend in Hand₹1,050
Effective Post-Tax Yield (at CMP)~0.07%

Illustrative for a 30% slab investor; add applicable surcharge and cess. Tax outcomes vary by individual slab. Not tax advice — consult a qualified professional.

Syrma SGS Technology Key Risks

1. Negligible income appeal. At ~0.10% real yield, the dividend is immaterial as income. Anyone buying Syrma SGS Technology for regular cash flow is in the wrong stock.

2. Rich valuation. The stock trades at a very high P/E (~78x) and around 10x book value. At such multiples, any earnings miss can trigger a sharp de-rating — a far bigger risk to total return than the tiny dividend adds back.

3. Working-capital intensity. High debtor days (~139) and inventory needs mean cash conversion can swing year to year; FY23–FY24 saw negative free cash flow. A working-capital blowout could pressure future FCF.

4. Customer and margin concentration. EMS margins are thin (OPM ~11%) and depend on a mix of large OEM customers; loss of a key client or input-cost inflation (memory, components) could compress profitability.

5. Acquisition / goodwill risk. Rapid inorganic expansion has created ~₹455 crore of goodwill. Integration missteps or underperformance of acquired units could lead to impairment charges.

What To Monitor in Syrma SGS Technology

1. Payout trajectory. Watch whether management lifts the dividend above the flat ₹1.50 as FCF strengthens, or keeps the payout ratio compressing toward reinvestment.

2. Free cash flow durability. FY26 turned FCF positive; confirm this holds in FY27 rather than reverting to the negative FCF of FY23–FY24.

3. Working-capital cycle. Track debtor days and the cash conversion cycle each quarter — the single biggest swing factor for cash generation.

4. Margin mix. Follow the shift toward higher-margin industrial, healthcare, export and ODM revenue that drove FY26 margin expansion.

5. Capex and new capacity. Monitor the PCB/Naidupeta expansion, PLI benefits and export targets (management guided toward ₹1,500 crore FY27 exports) — these determine the growth that justifies the low payout.

Should You Consider Syrma SGS Technology for Dividend Income?

The Syrma SGS Technology FY26 dividend of ₹1.50 per share tells a clear story once you strip away the misleading “15%” headline. The real yield is about 0.10% — the headline is roughly 151 times the actual cash return. This is a growth company that pays a token, symbolic dividend, not an income investment.

On the positives, the dividend is exceptionally well covered — 11x by earnings, 10x by operating cash flow and 24x by cash and investments — and FY26 marked the encouraging turn to positive free cash flow. The balance sheet is net-cash, aided by a ₹1,000 crore QIP. On the negatives, the yield is negligible, valuation is demanding, and the payout ratio has quietly fallen to ~9% as the dividend stayed frozen while profits tripled.

For a dividend-income seeker, Syrma SGS Technology offers little. For a growth investor, the dividend is simply a minor bonus on top of a fast-compounding EMS business. We present the positives, negatives, risks and monitoring factors; the decision rests with you.

Frequently Asked Questions About Syrma SGS Technology Dividend

What dividend has Syrma SGS Technology announced for FY26?
Syrma SGS Technology Limited recommended a final dividend of ₹1.50 per equity share (15% of the ₹10 face value) for the financial year ended 31 March 2026, announced at its board meeting on 11 May 2026 and approved by shareholders at the AGM.
What is the Syrma SGS Technology dividend yield?
The real dividend yield is approximately 0.10% at the current market price of around ₹1,511. The “15%” figure often quoted is calculated on the ₹10 face value, not the market price, and is about 151 times the actual cash yield.
What was the record date for the Syrma SGS Technology dividend?
The record date was 18 August 2026. Shareholders on the company’s register as of that date were eligible for the ₹1.50 dividend. The record date has now passed.
What is the ex-date for the Syrma SGS Technology dividend?
The ex-dividend date was 18 August 2026, the same as the record date under India’s T+1 settlement cycle. Buyers on or after the ex-date did not qualify for this dividend.
When was the Syrma SGS Technology dividend paid?
The dividend payment date was 24 September 2026, following shareholder approval at the AGM held on 25 August 2026.
Who was eligible for the Syrma SGS Technology dividend?
Investors who held Syrma SGS Technology shares in their demat account as of the record date, 18 August 2026, were eligible. To be on the register by then, shares had to be bought before the ex-date.
How is the Syrma SGS Technology dividend taxed?
Dividends are taxed in the investor’s hands at their income-tax slab rate. A 10% TDS applies only if total dividend from the company exceeds ₹5,000 in a financial year. For a 30% slab investor holding 1,000 shares, the ₹1,500 gross dividend leaves about ₹1,050 net.
Is the Syrma SGS Technology dividend sustainable?
Yes. The ₹1.50 dividend is covered about 11x by earnings, 10x by operating cash flow, 3.4x by free cash flow and 24x by cash and investments. Sustainability is not in question; the constraint is that the dividend has stayed flat and is very small.
What is the Syrma SGS Technology dividend history?
Since listing in 2022, Syrma SGS Technology has paid a flat ₹1.50 per share every year from FY23 to FY26, with no increases, cuts or special dividends. Because profits grew, the payout ratio fell from ~22% to ~9%.
Why is the Syrma SGS Technology dividend yield so low?
The yield is low mainly because the share price has risen more than 90% in a year while the dividend stayed at ₹1.50. A rising price against a fixed dividend mechanically compresses yield — a reflection of capital appreciation, not business weakness.
How does Syrma SGS Technology’s dividend compare with EMS peers?
It is broadly in line with, and in some cases more shareholder-friendly than, peers. Amber Enterprises pays nothing, while Kaynes, Cyient DLM and Avalon pay little or nothing. Across the EMS sector, dividends are symbolic; these stocks are held for growth.
What should investors monitor in Syrma SGS Technology going forward?
Key items: whether the dividend rises above ₹1.50, the durability of free cash flow, the working-capital cycle (debtor days), margin mix improvement, and execution on capacity expansion (PCB/Naidupeta), PLI benefits and export targets.
Should I buy Syrma SGS Technology for dividend income?
This article does not give buy, sell or hold advice. As a factual matter, at ~0.10% yield the dividend is negligible as income; Syrma SGS Technology is a growth-oriented EMS stock where the dividend is a minor bonus rather than a reason to invest.

Syrma SGS Technology Dividend Disclaimer

This article is for informational and educational purposes only and does not constitute investment, financial, legal or tax advice. ShareBazaar Online is not a SEBI-registered investment adviser. Nothing here should be interpreted as a recommendation to buy, sell or hold any security. All financial figures are drawn from Syrma SGS Technology Limited’s official regulatory filings dated 11 May 2026 and audited FY26 results; market prices and peer data are from public sources and may change. Ratios and yields are computed estimates and should be independently verified. Investments in securities are subject to market risks; please read all related documents carefully and consult a qualified financial advisor before making any investment decision. ShareBazaar Online accepts no liability for any loss arising from the use of this information.

Share this update
Back to Corporate Actions

Explore More Investment Opportunities

Discover IPOs, unlisted shares, and broker comparison tools curated for smart investors.