
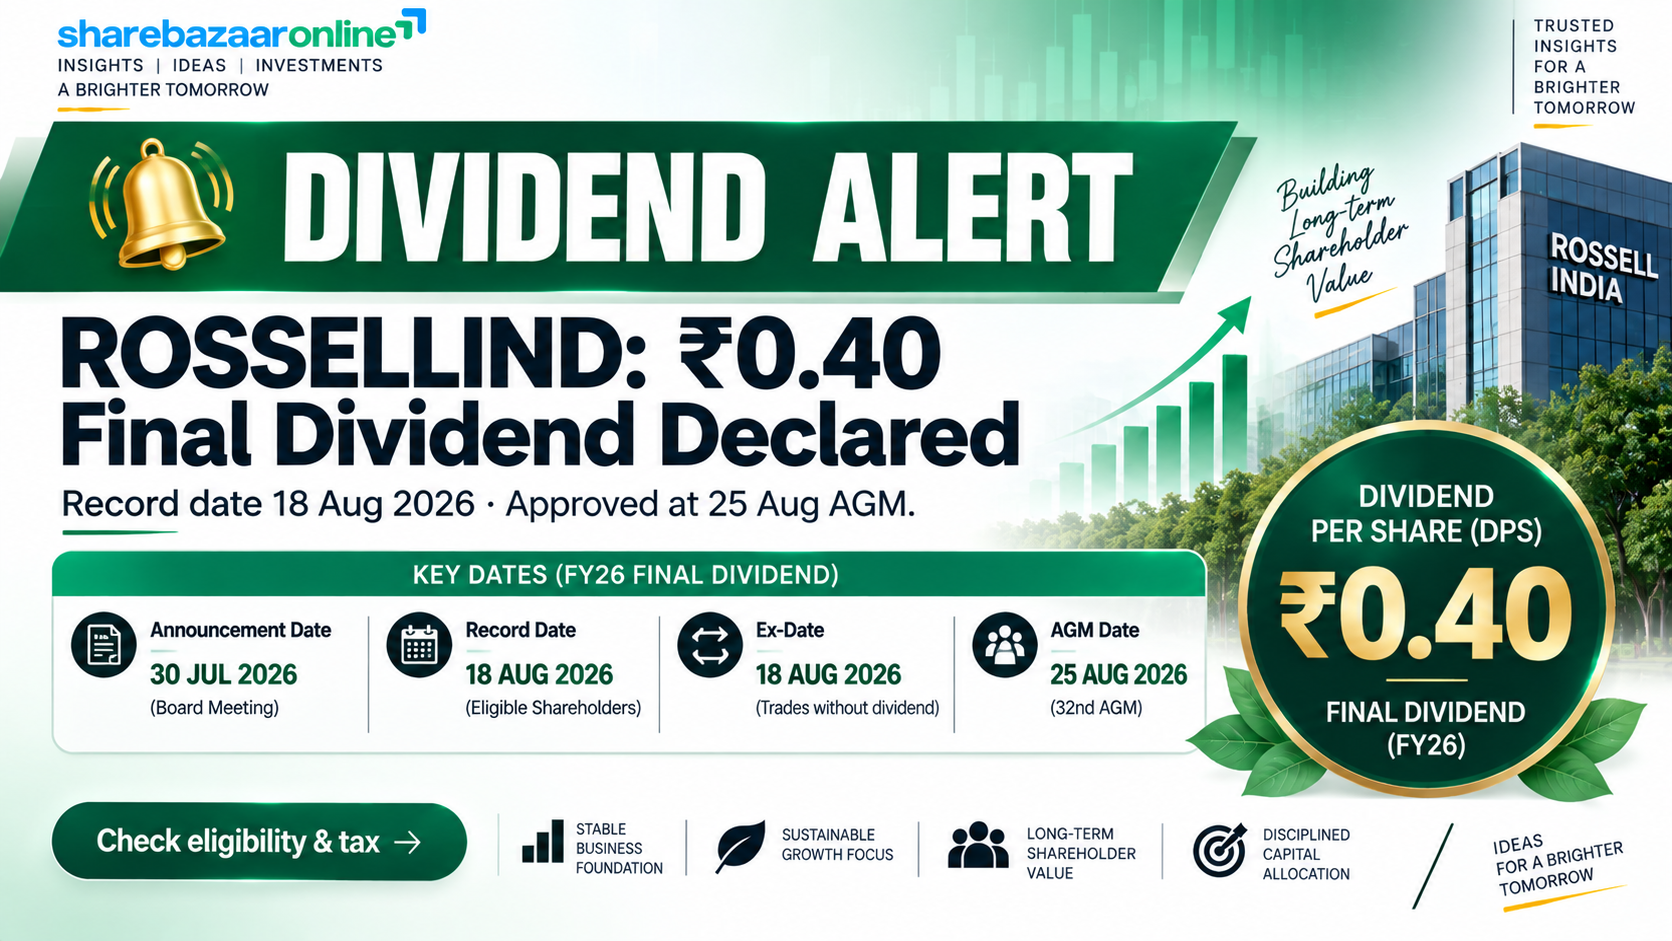
Dividend Snapshot
Rossell India Limited (NSE: ROSSELLIND | BSE: 533168) has declared a Final Dividend of Re 0.40 per equity share of face value ₹2 for the financial year 2025–26. On paper that reads as a 20% dividend. On the real market price of about ₹55, the actual cash yield is only 0.73% — the classic face-value illusion this analysis unpacks below.
Dividend Per Share
₹0.40
Dividend Type
Final Dividend
Dividend on Face Value
20%
Real Market Yield
~0.73%
Record Date
18 August 2026
AGM Date
25 August 2026
Total Dividend Outflow
~₹1.51 crore
Dividend Payout Ratio
~9.5% of profit
The single most important fact for a retail investor: Rossell India is no longer the company it was two years ago. Its high-growth aerospace and defence arm, Rossell Techsys, was demerged and separately listed in December 2024. What remains under the ROSSELLIND ticker is a pure-play Assam tea business — smaller, cyclical, and cash-generative, but with a very different profile from the ₹600-plus stock investors may remember. Market price of ₹55.1 is as on the 11 September 2026 close on the NSE.
Dividend Announcement Summary
At its Board Meeting held on 21 May 2026, the Board of Directors of Rossell India Limited recommended a Final Dividend of Re 0.40 per fully paid-up equity share of ₹2 each (20% of paid-up share capital) for the year ended 31 March 2026. The same 20% rate was declared for the previous year (FY 2024–25).
The dividend was recommended by the Board and subject to approval by shareholders at the 32nd Annual General Meeting held on 25 August 2026. As per exchange filings, that AGM approved the ₹0.40 dividend along with director appointments, so the recommendation has since been confirmed.
Alongside the dividend, the Board approved the audited results for Q4 and FY 2025–26, noted the retirement of Whole-time Director Mr. Nirmal Kumar Khurana on superannuation, and approved the appointment of Mr. Digant Mahesh Parikh (Senior Vice-President, Finance) as Director and Whole-time Director from 26 August 2026. The statutory auditors, Khandelwal Ray & Co., issued an unmodified (clean) opinion on the FY26 results.
Why the 20% headline is misleading: A 20% dividend means 20% of the ₹2 face value, i.e. ₹0.40 per share — not 20% of your invested amount. If you buy the share near ₹55, your cash return is about ₹0.40 ÷ ₹55 = 0.73%, not 20%. Face-value percentages are a legacy convention and should never be read as a yield.
Key Dates Timeline
Board Meeting / Announcement
21 May 2026
Book Closure
19 – 25 August 2026
Record Date (dividend entitlement)
18 August 2026
Ex-Dividend Date
18 August 2026 (inferred)
Annual General Meeting (32nd)
25 August 2026
Payment Date
Not separately disclosed by Company
The Company fixed 18 August 2026 as the record date for determining dividend entitlement. Under India's T+1 settlement, the ex-date effectively coincides with the record date; independent trackers indicate shares needed to be bought on or before 18 August 2026 to qualify. The exact credit/payment date was not separately stated in the filing; dividends are typically paid within 30 days of the AGM. All eligibility windows for this dividend have now passed.
Dividend Yield Analysis
Yield on Face Value (headline)
20.00%
Yield at Announcement (~₹57)
~0.70%
Yield at Current Price (₹55.1)
~0.73%
A ₹1,00,000 investment in Rossell India at ₹55.1 buys roughly 1,815 shares, which earn a dividend of about ₹726 a year before tax. That is the honest picture behind the "20%" headline. For comparison, a plain bank fixed deposit or a liquid fund would pay materially more in cash income.
Yield reality check — why the yield looks the way it does. Rossell's yield is low not because the dividend was cut, but because the share price is doing the arithmetic. Two mechanical forces matter here:
1. The demerger, not a crash. ROSSELLIND traded above ₹600 in mid-2024 (all-time high ₹665 on 9 July 2024). It now trades near ₹55. That fall is largely a structural value split: the aerospace/defence business (Rossell Techsys) was hived off on a 1:1 basis and separately listed on 9 December 2024. Shareholders received Rossell Techsys shares (which trade well above ₹600), so the drop in ROSSELLIND is not, by itself, a distress signal. Anyone reading a "yield spike from a price crash" story would be misreading the event.
2. The dividend itself is tiny. At ₹0.40 on ~₹55, even a stable price keeps the yield well under 1%. This is a token distribution, not an income stock.
Dividend History Analysis
Rossell India has a long but uneven dividend record. Per-share payouts (face value ₹2) over the last decade, based on exchange and third-party corporate-action data:
| Financial Year | Dividend / Share | % of Face Value |
|---|---|---|
| FY 2025–26 | ₹0.40 | 20% |
| FY 2024–25 | ₹0.40 | 20% |
| FY 2023–24 | ₹0.30 | 15% |
| FY 2022–23 | ₹0.40 | 20% |
| FY 2021–22 | ₹0.30 | 15% |
| FY 2020–21 | ₹0.30 | 15% |
| FY 2019–20 | ₹0.20 | 10% |
| FY 2018–19 | Nil | 0% |
| FY 2017–18 | Nil | 0% |
| FY 2016–17 | ₹0.20 | 10% |
| FY 2014–16 | ~₹0.50 | 25% |
Pattern classification: Irregular Payer
The Company skipped dividends entirely in FY18 and FY19, and the amount has moved between ₹0.20 and ₹0.50 over the decade. Third-party analysis notes the annual dividend has effectively shrunk from ~₹0.50 to ₹0.30–0.40 since 2015. That is not the profile of a reliable income compounder.
The recent steadier phase
On the positive side, Rossell has paid a dividend every year from FY20 through FY26 — seven consecutive years — and has held ₹0.40 for two years running. But remember: pre-demerger dividends came from a company with 3–4x the revenue. Post-demerger, the base is a smaller tea-only business, so raw per-share comparisons across FY24 are not like-for-like.
Financial Performance Analysis
Rossell India has no subsidiary, associate or joint venture, so standalone equals consolidated — there is only one set of financials to read. FY26 (audited) figures:
| Metric (₹ crore) | FY 2025–26 | FY 2024–25 | Change |
|---|---|---|---|
| Revenue from Operations | 226.2 | 181.9 | +24.4% |
| EBITDA (pre-exceptional) | 29.7 | 29.7 | Flat |
| Profit Before Tax | 17.5 | 21.1 | -17% |
| Net Profit (PAT) | 15.9 | 19.7 | -19.5% |
| EPS (₹) | 4.21 | 5.22 | -19.3% |
Operating leverage: revenue up, profit down
Revenue jumped +24% (helped by a full year of the newly-acquired Dhoedaam Tea Estate versus only three months in FY25) but PAT fell 19.5%. The gap is explained on the cost side: total operating expenses rose from ₹155.8 crore to ₹201.3 crore, with employee benefits (₹138.6 crore, +27%) the biggest single cost, plus higher power & fuel and stores. Finance cost also nearly doubled to ₹6.8 crore as debt was taken on for the Dhoedaam acquisition. In short, the bigger estate footprint added sales but compressed margins — EBITDA stayed flat at ₹29.7 crore while the business grew.
Seasonality warning
Tea is highly seasonal. Q4 (Jan–Mar) sees very little cropping, so Rossell reported a Q4 net loss of ~₹23.8 crore even though the full year was profitable at ₹15.9 crore. Do not read the quarterly loss as distress — it is structural. Roughly ₹462 lakh of impairment on a non-current investment was also recognised below the line (in Other Comprehensive Income), so it did not hit reported PAT but is worth noting.
Cash Flow Analysis
Reported profits are opinions; cash is fact. Here Rossell looks healthier than its P&L suggests.
Operating Cash Flow (FY26)
₹28.5 crore
Net Profit (FY26)
₹15.9 crore
OCF ÷ Net Profit
~1.8x
Capex (FY26)
₹13.4 crore
Free Cash Flow (OCF − Capex)
~₹15.1 crore
Dividend Outflow
~₹1.51 crore
Quality of earnings is good. Operating cash flow of ₹28.5 crore comfortably exceeds net profit of ₹15.9 crore (a cash conversion of ~180%), which is the opposite of the red flag we watch for — there is no sign of profits being propped up by uncollected receivables. Trade receivables are negligible (debtor days near zero), typical of an auction-and-cash tea model. After ₹13.4 crore of capex, free cash flow is about ₹15.1 crore — roughly 10 times the ₹1.51 crore dividend. The dividend is funded comfortably out of current-year cash generation, not reserves, asset sales or fresh borrowing.
Balance Sheet Strength
Total Equity (Net Worth)
₹199.8 crore
Book Value / Share
~₹53
Total Borrowings
₹64.6 crore
Debt / Equity
~0.32
Cash + Current Investments
₹30.4 crore
Cash Cover of Dividend
~20x
ROE (FY26)
~8.2%
ROCE (FY26)
~9.4%
The balance sheet is moderately leveraged but well within comfort. Debt-to-equity of ~0.32 is modest; the Company reduced overall borrowings during the year. Against total borrowings of ₹64.6 crore, it holds ₹30.4 crore of cash and liquid investments. Returns are the soft spot: an ROE of ~8% and ROCE of ~9% are low, reflecting a capital-heavy plantation business with thin margins. The dividend, at just ₹1.51 crore, is a rounding error against a ₹200 crore net worth — affordability is not in question.
Dividend Sustainability Analysis
We run four independent coverage tests. Rossell passes all four comfortably:
1. Earnings coverage ✔
Payout is just ~9.5% of profit; EPS covers the dividend 10.5x. Enormous headroom.
2. Operating cash cover ✔
OCF of ₹28.5 crore is ~19x the dividend.
3. Free cash flow cover ✔
FCF of ~₹15.1 crore covers the dividend ~10x, after capex.
4. Liquidity cover ✔
Cash and liquid investments cover the dividend ~20x.
Verdict: Sustainable
The dividend is so small relative to cash generation, reserves and net worth that its continuation is not the question — a ₹1.51 crore payout is trivially affordable. The real caveat is that the payout is low by design: management retains ~90% of profit, so this is not an income stock. Investors seeking cash yield will find far more elsewhere; the risk here is earnings volatility from a cyclical tea business, not a dividend cut.
Peer Comparison
Against other listed Indian tea/plantation companies, Rossell is mid-of-pack on returns and a very low yielder. Figures below are from public market data (approximate, mid-2026):
| Company | Div Yield | ROE | ROCE | P/E | P/B |
|---|---|---|---|---|---|
| Rossell India | ~0.73% | ~8.2% | ~9.4% | ~17.5 | ~1.04 |
| Goodricke Group | Low | ~1.6% | ~4.0% | ~7.5 | ~1.37 |
| Jay Shree Tea | ~0.5% | Negative | Low | N/A (loss) | ~0.67 |
| United Nilgiri Tea | Low | ~6.0% | ~7.6% | ~11.1 | ~0.91 |
| Dhunseri Tea & Inds. | Modest | Low | Low | — | ~0.27 |
| McLeod Russel | Nil | Negative | ~3.3% | N/A (loss) | Negative |
Takeaway: The Indian listed tea sector is broadly a low-yield, low-return, cyclical space. Several large names (Jay Shree Tea, McLeod Russel) are loss-making. On that backdrop Rossell screens relatively well on profitability (positive ROE/ROCE, clean-ish balance sheet) but its dividend yield of ~0.73% is not a differentiator — the whole sector pays little. None of these are dividend-income plays.
Promoter Impact Analysis
Promoter Holding
74.80%
Promoter Share of Dividend
~₹1.13 crore
Public + Institutions Holding
25.20%
Minority Share of Dividend
~₹38 lakh
The promoter group (H.M. Gupta family) holds 74.80% — near the 75% regulatory ceiling — so about three-quarters of every rupee of dividend, roughly ₹1.13 crore, flows to promoters. Minority shareholders collectively receive around ₹38 lakh. With such a small total payout and a high promoter stake, the dividend is not a meaningful cash transfer to public investors. Notably, FII holding fell to effectively 0% during FY26 (from ~1.2% a year earlier), while DII holding held steady at 2.66% and public holding edged up to ~22.5% — a shift worth monitoring given the stock's low institutional footprint.
Taxation Analysis
Since FY 2020–21, dividends are taxable in the shareholder's hands at their income-tax slab rate (the old Dividend Distribution Tax was abolished). Key rules for FY 2025–26:
Slab-rate taxation
The full dividend is added to your income and taxed at your slab — 5%, 20%, 30% etc. There is no separate concessional rate for residents.
TDS under Section 194
A company deducts 10% TDS only if your total dividend from it exceeds ₹10,000 in the year (threshold raised from ₹5,000 from FY26). Without PAN, TDS is 20%. Non-residents: ~20% under Section 195, subject to DTAA.
Worked example — 1,000 shares
Investor holds 1,000 shares, dividend ₹0.40/share, tax slab 30%:
- Gross dividend: 1,000 × ₹0.40 = ₹400
- TDS: Nil (below the ₹10,000 threshold)
- Tax at 30% slab: ₹400 × 30% = ₹120 (paid via your ITR)
- Net in hand after tax: ₹280
- Effective post-tax yield on a ₹55,000 holding: ~0.51%
Residents with income below the taxable limit can file Form 15G/15H to avoid TDS. This is general information, not tax advice.
Key Risks
1. Commodity & weather cyclicality
Tea earnings swing with Assam auction prices, monsoon and pest conditions. A bad crop or weak price year can turn profit into loss, as the volatile quarterly numbers show.
2. Labour cost inflation
Employee costs are the single largest expense (₹138.6 crore, +27% YoY). The New Labour Codes added ₹24 lakh of gratuity liability; further wage-cost increases directly hit thin margins.
3. Very low real dividend yield
At ~0.73%, the dividend offers negligible cash income. Anyone buying for yield is mismatched to this stock.
4. Micro-cap liquidity & concentration
A ~₹208 crore market cap with 74.8% promoter holding and near-zero FII interest means thin free float, wide price swings and limited institutional support.
5. Acquisition integration & debt
The ₹64.2 crore Dhoedaam acquisition raised finance costs and operating expenses. If the new estate does not lift realisations, returns (already ~8% ROE) stay depressed.
6. Investment-book impairment
A ₹462 lakh impairment on a non-current investment was booked in OCI this year, signalling some stress in the Company's investment holdings outside the core tea operations.
What To Monitor
1. Assam tea auction prices
The single biggest driver of Rossell's realisations and margins. Track North Indian CTC auction averages season to season.
2. Full-year (not quarterly) profitability
Because of seasonality, judge the business on the annual PAT and OCF, not on the loss-making March quarter.
3. Dhoedaam estate contribution
Watch whether the new estate lifts production volume and blended realisation enough to justify the added debt and costs.
4. Debt and finance cost trajectory
Finance cost nearly doubled to ₹6.8 crore. Falling borrowings and interest would strengthen the earnings and dividend base.
5. Payout-ratio direction
A rising payout (above the current ~9.5%) would signal a shift toward rewarding shareholders; a flat token payout signals continued reinvestment.
6. Institutional interest & free float
FII holding has gone to ~0%. Any re-entry by domestic or foreign institutions would improve liquidity and price discovery.
Conclusion
The positives
Rossell India's ₹0.40 dividend is comfortably and safely funded — covered ~10x by free cash flow, ~19x by operating cash flow and ~20x by liquid assets. The Company has a clean audit opinion, moderate debt (D/E ~0.32), strong cash conversion (OCF ~1.8x profit), and it grew revenue 24% while expanding its estate base.
The negatives
The "20%" headline is a face-value figure; the real yield is only ~0.73%. Payout is a token ~9.5%, so this is not an income stock. PAT fell ~19.5%, returns are low (~8% ROE), earnings are cyclical with loss-making quarters, and the dividend record is irregular (two skipped years last decade). Post-demerger, this is a small, promoter-heavy, low-liquidity tea company.
In short: the dividend is sustainable but immaterial. The Rossell India story is about a cyclical tea turnaround and capital appreciation, not dividend income. We present the facts; the decision is yours.