
Dividend Snapshot
NGL Fine-Chem Limited (NSE: NGLFINE | BSE: 524774) has declared a final dividend of ₹1.75 per equity share for the financial year ended 31 March 2026. The face value of each share is ₹5, so this works out to a headline 35% dividend — but that percentage is calculated on face value, not on the market price. On the traded price, the real cash return is only about 0.06%. This gap between the headline number and the actual yield is the single most important thing for a retail investor to understand about this payout.
Dividend Per Share
₹1.75
Final dividend, FY2025-26
Dividend on Face Value
35%
On ₹5 face value
Real Dividend Yield
~0.06%
On CMP of ~₹2,868
Record Date
18 Aug 2026
Now passed
Total Dividend Outflow
₹1.08 Cr
₹108.12 lakh
Payout Ratio
~2.3%
Of consolidated FY26 profit
Dividend Announcement Summary
At its board meeting held on Thursday, 21 May 2026, the Board of Directors of NGL Fine-Chem recommended a final dividend of ₹1.75 per fully paid-up equity share of ₹5 each for the year ended 31 March 2026. Because it is a final dividend, it is a recommendation that requires shareholder approval at the Annual General Meeting (AGM) before it can be paid.
The company confirmed that the 45th AGM will be held on 25 August 2026 through video conferencing. The dividend, once approved, was payable to shareholders on the company's register as of the record date. The statutory auditors, Manek & Associates, issued an unmodified (clean) audit opinion on both standalone and consolidated results — a positive governance signal that the reported numbers carry no auditor qualification.
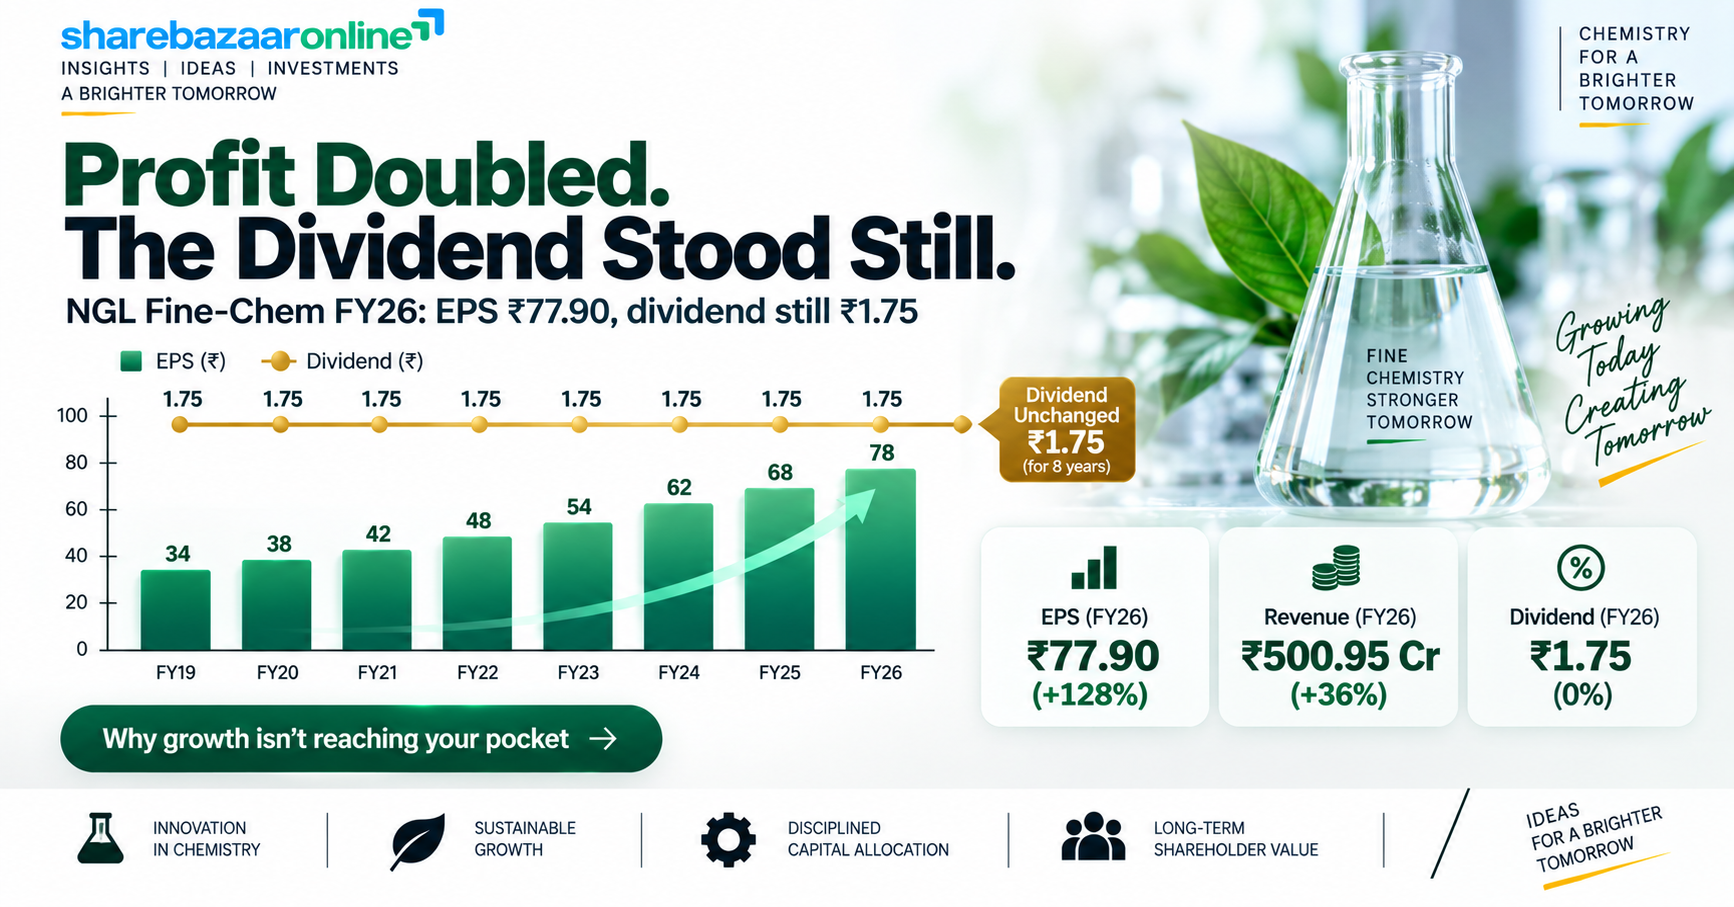
Key context: The dividend of ₹1.75 is exactly the same amount NGL Fine-Chem has paid every year since FY2018-19 — eight consecutive years of an unchanged ₹1.75, even as the company's earnings per share more than doubled. The headline percentage has not moved because both the dividend and the ₹5 face value are unchanged.
Key Dates Timeline
| Event | Date | Status |
|---|---|---|
| Board Meeting & Announcement | 21 May 2026 | Completed |
| Ex-Dividend Date | 18 Aug 2026 | Passed (aligned with record date under T+1) |
| Record Date | 18 Aug 2026 | Passed |
| Register / Book Closure | 19–25 Aug 2026 | Passed |
| Annual General Meeting (AGM) | 25 Aug 2026 | Completed |
| Dividend Payment | ~18 Sep 2026 | Post-AGM (per external tracking) |
Announcement, record and AGM dates are from the company's exchange filing dated 21 May 2026. The ex-date equals the record date under India's T+1 settlement. The payment date of ~18 September 2026 is from external dividend trackers and was not a fixed date in the board filing.
Dividend Yield Analysis — The Face-Value Illusion
A "35% dividend" sounds enormous. It is not. That 35% is simply ₹1.75 expressed as a percentage of the ₹5 face value. What actually lands in your bank account depends on the price you paid for the share, which is far higher than ₹5.
Yield on Current Price
0.06%
₹1.75 ÷ ~₹2,868 (CMP, late Aug 2026)
Yield on Announcement Price
0.07%
₹1.75 ÷ ₹2,360 (22 May 2026 close)
In plain terms: if you invest ₹1,00,000 in NGL Fine-Chem at the current price, this dividend pays you roughly ₹60 for the year. The 35% figure is not wrong — it is just measured against a number (₹5) that has nothing to do with what the share costs today. NGL Fine-Chem is a growth-and-capex story, not an income stock, and the yield reflects that.
Dividend History Analysis
NGL Fine-Chem has been a remarkably consistent payer — and a remarkably static one. The dividend has been frozen at ₹1.75 per share for eight straight years, through good years and weak ones.
| Financial Year | Dividend / Share | Ex / Record Date | Growth |
|---|---|---|---|
| FY2025-26 | ₹1.75 | 18 Aug 2026 | 0% |
| FY2024-25 | ₹1.75 | 12 Aug 2025 | 0% |
| FY2023-24 | ₹1.75 | 16 Aug 2024 | 0% |
| FY2022-23 | ₹1.75 | 17 Aug 2023 | 0% |
| FY2021-22 | ₹1.75 | 22 Jun 2022 | 0% |
| FY2020-21 | ₹1.75 | 12 Aug 2021 | 0% |
| FY2019-20 | ₹1.75 | 06 Aug 2020 | 0% |
| FY2018-19 | ₹1.75 | 13 Aug 2019 | — |
Dividend history compiled from external dividend trackers. There have been no bonus issues, stock splits, special dividends, cuts or suspensions in this window.
Classification: Consistent Payer with zero dividend growth. The reliability is genuine — NGL has never skipped or cut the payout. But the dividend has not grown at all in eight years, even though consolidated EPS rose from roughly ₹29 (FY25) to ₹77.90 (FY26). An investor relying on this stock for rising income has received none.
Financial Performance Analysis
FY2025-26 was a strong recovery year (all figures consolidated unless stated). Revenue and profit both jumped sharply, and margins expanded — this was operating leverage working in the company's favour.
| Metric (Consolidated) | FY2025-26 | FY2024-25 | Growth |
|---|---|---|---|
| Revenue from Operations | ₹500.95 Cr | ₹368.26 Cr | +36.0% |
| EBITDA (approx.) | ₹87.4 Cr | ₹42.5 Cr | +105.7% |
| EBITDA Margin | 17.5% | 11.5% | +600 bps |
| Profit Before Tax | ₹63.37 Cr | ₹27.71 Cr | +128.6% |
| Net Profit (PAT) | ₹48.13 Cr | ₹21.12 Cr | +127.8% |
| EPS (Basic & Diluted) | ₹77.90 | ₹34.19 | +127.8% |
Standalone PAT was ₹41.63 Cr (EPS ₹67.39). The wholly-owned subsidiary, Macrotech Polychem Pvt. Ltd, adds the gap between standalone and consolidated numbers.
Operating leverage — the positive version: revenue grew 36% but EBITDA more than doubled (+106%) because costs did not rise as fast. EBITDA margin expanded from 11.5% to 17.5%. This is the mirror image of a margin-compression year: revenue and profit moved in the same direction, and profit moved faster. The FY25 base was unusually weak, which magnifies the growth percentages.
Cash Flow Analysis
Reported profit is an accounting opinion; cash is a fact. Here the two diverge in an important way. NGL Fine-Chem generated healthy operating cash but spent far more than that on building capacity — leaving negative free cash flow.
Operating Cash Flow (FY26)
₹43.3 Cr
vs PAT of ₹48.1 Cr → OCF/PAT = 0.90
Capital Expenditure (FY26)
₹89.85 Cr
Property, plant & work-in-progress
Free Cash Flow (FY26)
–₹46.5 Cr
OCF minus capex — negative
Dividend Outflow
₹1.08 Cr
Tiny relative to the numbers above
How is the dividend actually funded? The ₹1.08 Cr dividend is trivially small next to ₹43.3 Cr of operating cash, so at face value it is covered many times over by earnings and operating cash. But because free cash flow is negative — the company is spending roughly twice its operating cash on expansion — the dividend is not funded by surplus free cash. In a year of heavy capex partly financed by fresh borrowing, every rupee paid out as dividend is effectively a rupee that had to be raised or retained elsewhere.
Watch the receivables: trade receivables jumped 58% to ₹130.9 Cr, faster than the 36% revenue growth. Receivables as a share of revenue rose from 22.5% to 26.1%. That is why operating cash (₹43.3 Cr) lagged profit (₹48.1 Cr) — a chunk of the year's sales is still stuck in the debtor book rather than in the bank.
Balance Sheet Strength
Cash + Current Investments
₹44.3 Cr
Covers dividend ~41x
Total Borrowings
₹108.4 Cr
Up from ₹73.3 Cr a year earlier
Net Debt
₹64.1 Cr
Debt minus cash & investments
Debt-to-Equity
0.33x
Total equity ₹329.2 Cr
The balance sheet is moderately leveraged and getting more so. Non-current borrowings roughly doubled during the year (from ₹25.3 Cr to ₹56.4 Cr) to help fund the capex programme. At 0.33x debt-to-equity the leverage is still comfortable, and cash plus current investments of ₹44.3 Cr comfortably covers the tiny dividend around 41 times over. The key point for a dividend investor is that debt is rising while dividends are being paid — the company is prioritising growth capex over returning cash, and borrowing to bridge the gap. Capital work-in-progress alone stood at ₹94.6 Cr, signalling that the heavy investment phase is not over.
Dividend Sustainability Analysis
We test sustainability on four measures — earnings coverage, operating-cash coverage, free-cash-flow coverage, and liquidity coverage.
| Test | Result | Verdict |
|---|---|---|
| Earnings coverage (EPS ÷ DPS) | 44.5x; payout ~2.3% | Very strong |
| Operating-cash coverage | OCF ₹43.3 Cr vs ₹1.08 Cr | Very strong |
| Free-cash-flow coverage | FCF negative (–₹46.5 Cr) | Fails |
| Liquidity / cash coverage | Cash & investments cover ~41x | Strong |
Overall verdict: Sustainable — but a token payout, not an income stream. The dividend is so small (₹1.08 Cr, about 2.3% of profit) that it is easily affordable from operating cash even in a heavy-capex year, and there is no realistic risk of a cut. The one test it fails — free-cash-flow coverage — matters less here because the shortfall is driven by growth investment, not by an inability to fund the dividend. The real risk for shareholders is not that the dividend gets cut; it is that it stays frozen at ₹1.75 indefinitely while the company keeps ploughing cash back into expansion.
Peer Comparison
NGL Fine-Chem operates in veterinary / animal-health APIs and intermediates. Against animal-health and broader pharma peers, its yield sits at the very bottom of the range, while its return ratios are respectable.
| Company | Dividend Yield | ROE | Payout |
|---|---|---|---|
| NGL Fine-Chem | ~0.06% | ~14.6% | ~2.3% |
| Hester Biosciences | ~0.48% | ~14.9% | Not Disclosed |
| Pharma sector average | ~0.8% | — | — |
| Indian market top 25% | ~1.3% | — | — |
Peer yields and ratios are indicative, drawn from public data aggregators as of mid/late 2026, and will move with prices. ROE for NGL is the FY26 computed figure (₹48.1 Cr ÷ ₹329.2 Cr equity); some aggregators quote a higher standalone/trailing ROE.
The takeaway: NGL's ~0.06% yield is roughly one-eighth of Hester Biosciences' and a fraction of the pharma-sector and market benchmarks. On profitability (ROE ~14.6%) it is broadly in line with animal-health peers. This is a company being valued for growth, not for its cash distribution.
Promoter Impact Analysis
Promoter Holding
~72.5%
No shares pledged
Promoter Dividend Income
~₹0.78 Cr
72.5% of ₹1.08 Cr outflow
Because the promoter group (the Lawande / Nachane family) holds about 72.5% of the company, roughly ₹0.78 Cr of the ₹1.08 Cr dividend flows to the promoters, and only around ₹0.30 Cr to all public and minority shareholders combined. Mutual-fund and FII ownership is minimal. In many high-promoter-holding companies a large dividend can be a way to route cash to promoters; here the opposite reading is more accurate — the dividend is so small that neither promoters nor minorities gain much. The company's clear preference is to retain cash for capex rather than distribute it. That is arguably shareholder-friendly if the reinvestment earns good returns, but it offers nothing to an income-seeking minority investor.
Taxation Analysis
Since April 2020, dividends in India are taxed in the hands of the shareholder at their applicable income-tax slab rate — there is no separate Dividend Distribution Tax any more. Key rules:
- Dividend is added to your total income and taxed at your slab rate (5% / 20% / 30% plus cess).
- TDS is deducted by the company at 10% if your total dividend from that company in a financial year exceeds ₹5,000 (20% if PAN is not provided).
- If your income is below the taxable limit, you can file Form 15G / 15H to avoid TDS.
Worked example — 1,000 shares at ₹1.75
| Gross dividend (1,000 × ₹1.75) | ₹1,750 |
| TDS (below ₹5,000 threshold → nil) | ₹0 |
| Tax at 30% slab | ₹525 |
| Net dividend in hand (30% slab) | ₹1,225 |
| Effective post-tax yield (on ~₹28.7 lakh invested) | ~0.04% |
A 1,000-share holding is worth roughly ₹28.7 lakh at the current price, yet produces a gross dividend of just ₹1,750. For a 30%-slab investor, the net cash return is negligible.
Key Risks
- Negative free cash flow & rising debt: capex (₹89.85 Cr) ran at roughly twice operating cash, borrowings rose to ₹108.4 Cr, and CWIP of ₹94.6 Cr signals the spend continues. Execution delays or cost overruns could strain cash.
- Receivables stretch: debtors grew 58% versus 36% revenue growth and now sit at 26% of revenue. A slippage in collections would hit cash conversion and could pressure working-capital funding.
- Concentrated end-market: the group is a single-segment (pharmaceuticals) business focused on veterinary / animal-health APIs, largely exported to unregulated markets — leaving it exposed to that niche's demand and pricing cycles.
- Forex & export dependence: a large share of revenue is exports (India was only ~₹158 Cr of ₹494 Cr FY26 revenue), so currency swings and trade / regulatory changes in destination markets matter.
- Dividend stagnation: the payout has been frozen at ₹1.75 for eight years despite doubling profits — income investors face zero dividend growth and a yield near 0.06%.
- Low base effect: FY26's triple-digit growth partly reflects an unusually weak FY25 base; the pace is unlikely to repeat and should not be extrapolated.
What To Monitor
- Capex completion and returns: track whether the ₹94.6 Cr of capital work-in-progress converts into revenue and improves ROCE, and when free cash flow turns positive.
- Receivable days: watch whether debtors as a percentage of revenue fall back from 26% — a sustained rise would be a red flag for cash quality.
- Debt trajectory: monitor total borrowings and debt-to-equity; further increases while capex continues would raise the balance-sheet risk.
- Margin durability: the jump to a 17.5% EBITDA margin needs to hold across a full cycle rather than being a one-year rebound.
- Any change in dividend policy: the first move away from the frozen ₹1.75 — a hike, a special dividend, or a buyback — would be a meaningful signal about capital-allocation priorities.
- Credit rating: CRISIL revised its outlook to 'Stable' from 'Negative' (BBB+); watch for further rating action as debt and capex evolve.
Conclusion
NGL Fine-Chem's FY2025-26 final dividend of ₹1.75 per share is best understood as a token, symbolic payout rather than a source of income. The headline "35%" is a face-value artefact; the real yield is roughly 0.06%, and the amount has not changed in eight years even as profit more than doubled.
The positives: a genuine and uninterrupted eight-year payment record, a clean audit opinion, a strong FY26 recovery (revenue +36%, PAT +128%, EBITDA margin up 600 bps), an easily affordable payout (2.3% of profit), and healthy liquidity relative to the dividend.
The negatives: negative free cash flow, rising debt, a stretched receivable book, and a dividend that has been completely static — delivering no income growth to shareholders. This is a growth-and-capex company that pays a nominal dividend, not a dividend stock. Investors should judge it on its reinvestment and earnings prospects, not on its yield.
Frequently Asked Questions
What dividend has NGL Fine-Chem announced for FY2025-26?
What is the actual dividend yield of NGL Fine-Chem?
Why is the dividend called 35% when the yield is only 0.06%?
What was the record date for the NGL Fine-Chem dividend?
What was the ex-dividend date?
When will the NGL Fine-Chem dividend be paid?
Who was eligible to receive this dividend?
How is the dividend taxed?
Is the NGL Fine-Chem dividend sustainable?
What is NGL Fine-Chem's dividend history?
How did NGL Fine-Chem perform financially in FY2025-26?
Why is free cash flow negative if profit doubled?
How does NGL's dividend compare with peers?
What should investors monitor going forward?
Is NGL Fine-Chem a good stock for dividend income?
Disclaimer
This article is for informational and educational purposes only and does not constitute investment advice, a recommendation, or an offer to buy or sell any security. ShareBazaar Online is not a SEBI-registered investment adviser. Figures are sourced from NGL Fine-Chem's exchange filing dated 21 May 2026, its audited FY2025-26 results, and public data aggregators; market prices, yields and peer data are indicative and change continuously. Dividend amounts, dates and tax treatment are subject to shareholder approval and prevailing law. Readers should verify all data with official NSE, BSE and company sources and consult a qualified, SEBI-registered financial adviser before making any investment decision. Investments in securities are subject to market risks.