
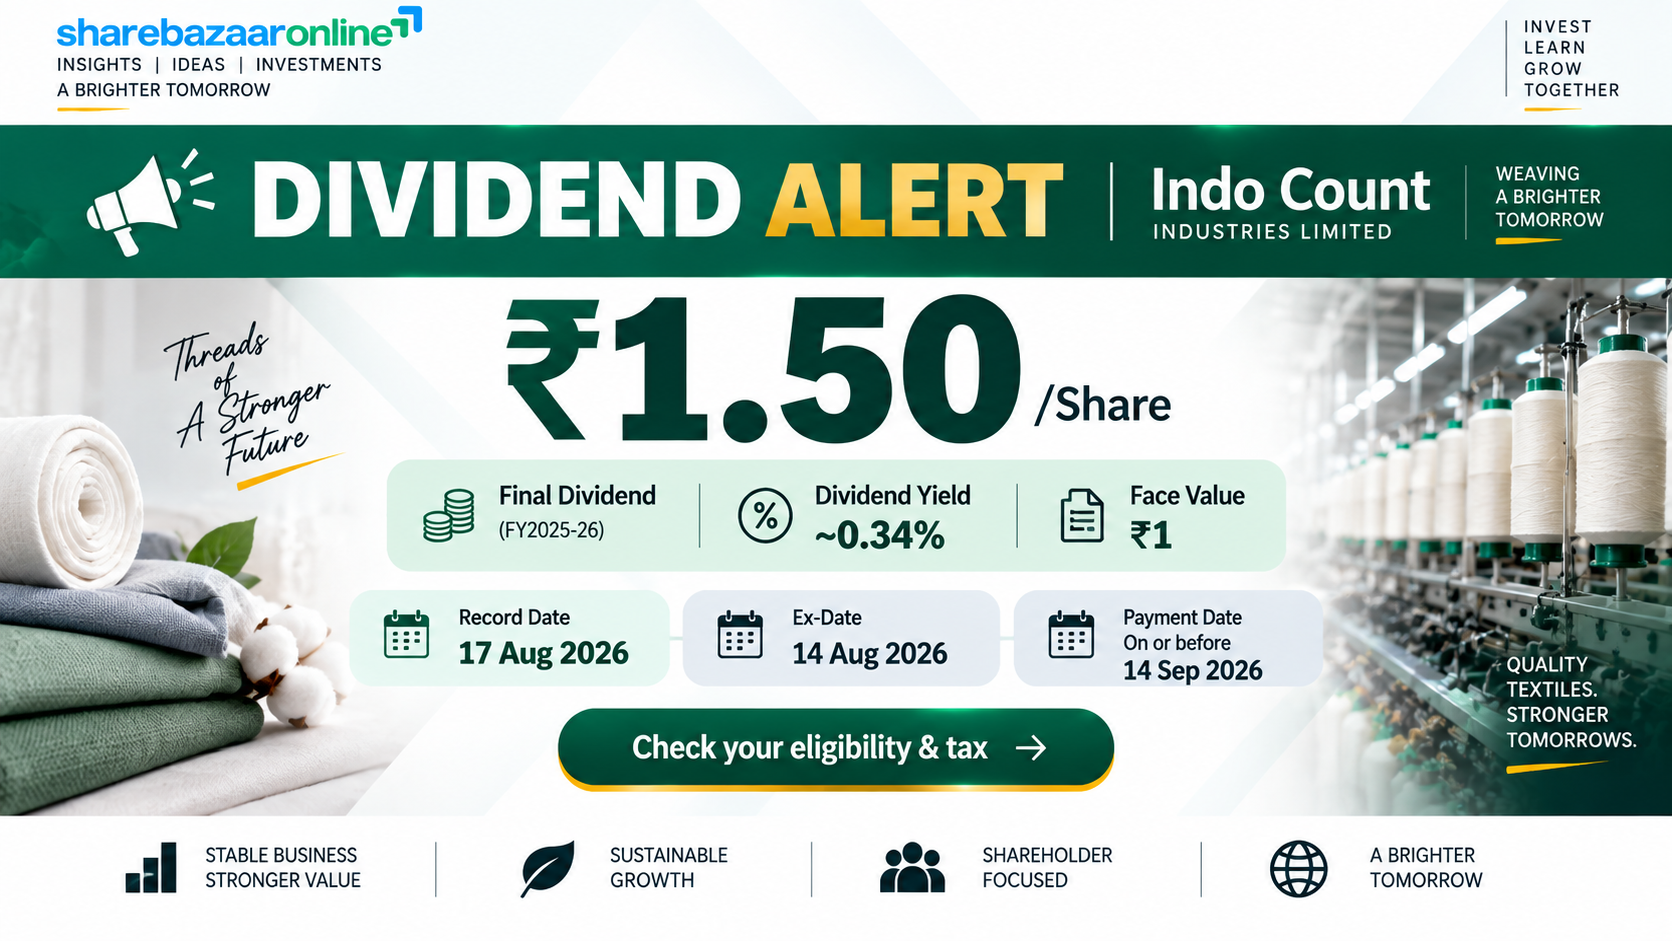
Dividend Snapshot
Indo Count Industries Limited (NSE: ICIL, BSE: 521016) has declared a Final Dividend of ₹1.50 per equity share for the financial year ended 31 March 2026. The company headlines this as a 75% dividend — but that 75% is calculated on the ₹2 face value, not on the market price. At a market price of about ₹443 (11 September 2026 close), the real cash yield in a buyer’s hand is roughly 0.34%. That gap between the loud “75%” and the quiet 0.34% is the first thing every retail investor should understand.
Dividend Details
- Dividend Type: Final Dividend
- Dividend Per Share: ₹1.50
- Dividend Percentage: 75% of ₹2 face value
- Face Value: ₹2 per share
- Financial Year: FY2025-26
- AGM Approval: Required (recommended, not yet paid)
Real-World Yield
- Yield on Market Price (~₹443): ~0.34%
- Yield near Announcement (~₹335): ~0.45%
- Total Dividend Outflow: ~₹29.71 Crore
- Shares Outstanding: ~19.81 Crore
- Payout Ratio (Consolidated): ~23.5% of profit
- Dividend vs Last Year: Cut from ₹2.00 to ₹1.50
The forensic headline: this is a dividend cut. Indo Count paid ₹2.00 last year and ₹2.20 the year before; the FY26 payout of ₹1.50 is a 25% reduction year-on-year. It comes in a year when consolidated net profit almost halved — from ~₹250 Crore to ~₹126.68 Crore — even though revenue barely moved. Cash generation, however, actually improved. This report separates the profit story from the cash story, because they point in opposite directions.
Dividend Announcement Summary
At its Board Meeting held on 30 May 2026 (which ran from 2:00 p.m. to 4:40 p.m. IST), the Board of Directors of Indo Count Industries Limited approved the audited standalone and consolidated results for the quarter and year ended 31 March 2026 and recommended a Final Dividend of ₹1.50 per equity share of ₹2 each, subject to shareholder approval at the ensuing Annual General Meeting (AGM).
What the Board Said
Per the exchange filing, if approved by shareholders, the dividend will be paid (net of tax deducted at source) within 30 days of the AGM date. The company later fixed 17 August 2026 as the Record Date for the final dividend. The auditors, M/s Price Waterhouse Chartered Accountants LLP, issued an unmodified (clean) audit opinion on both the standalone and consolidated results.
Company Identity
- Company: Indo Count Industries Limited
- NSE Symbol: ICIL
- BSE Code: 521016
- ISIN: INE483B01026
- CIN: L72200PN1988PLC068972
- Business: Home textiles / bed linen (single segment)
Plain-English translation: Indo Count makes bed sheets, quilts and other “top-of-bed” home textiles and is one of the world’s largest bed-linen exporters. A “final dividend” is the reward the Board proposes out of the full-year profit; it becomes payable only after shareholders vote on it at the AGM. The Record Date of 17 August 2026 was the cut-off used to decide which shareholders were entitled to receive it.
Key Dates Timeline
| Event | Date | Status |
|---|---|---|
| Board Meeting / Announcement | 30 May 2026 | Completed |
| Ex-Dividend Date | 17 August 2026 | Passed |
| Record Date | 17 August 2026 | Passed |
| Annual General Meeting (AGM) | To be intimated | Not Disclosed by Company |
| Payment Date | Within 30 days of AGM | Subject to AGM approval |
How to read this: under India’s T+1 settlement, the ex-date and record date for a dividend now typically fall on the same day — here, 17 August 2026. To have qualified for the dividend, an investor needed to be holding the shares as of that record date. Both dates have already passed, so eligibility for this particular dividend is now settled. The exact payment date depends on the AGM date, which the company had said would be intimated separately.
Dividend Yield Analysis
The Face-Value Illusion
The “75% dividend” number is technically correct and practically misleading. It means ₹1.50 as a percentage of the ₹2 face value (1.50 ÷ 2 = 75%). It has nothing to do with what you earn on the money you actually invest. On the traded price, the real yield looks very different:
Yield Reality Check
- Headline (on face value): 75%
- Real yield on ~₹443 (Sep 2026): ~0.34%
- Yield near announcement (~₹335): ~0.45%
- 52-week range: ₹216.90 – ₹474.65
Why the Yield Is So Low
Two forces are at work. First, the stock has re-rated sharply — up roughly 80%+ over the past year — so a fixed ₹1.50 dividend now buys a much smaller yield. Second, the company reduced the dividend even as the price rose. High price + lower payout = a yield that rounds to a third of one percent. Indo Count is a growth/re-rating story, not an income stock.
Bottom line on yield: a buyer at today’s price who invests ₹1,00,000 in ICIL would receive roughly ₹340 a year in dividend at this rate — before tax. Anyone buying this share for dividend income is misreading it. The payout here is a token gesture on top of a business the market is valuing for future growth (P/E around 58, per Screener).
Dividend History Analysis
| Financial Year | Dividend Per Share | Trend |
|---|---|---|
| FY2016-17 | ₹0.40 | Base |
| FY2017-18 | ₹0.80 | Up |
| FY2018-19 | ₹0.60 | Down |
| FY2019-20 | ₹0.60 | Flat |
| FY2020-21 | ₹1.50 | Up |
| FY2021-22 | ₹2.00 | Up |
| FY2022-23 | ₹2.00 | Flat |
| FY2023-24 | ₹2.20 | Peak |
| FY2024-25 | ₹2.00 | Down |
| FY2025-26 | ₹1.50 | Down again |
Dividend history compiled from public corporate-action records (TipRanks, exchange filings). All amounts are on the current ₹2 face value; no bonus/split adjustment is required within this 10-year window.
What the Record Shows
Indo Count grew its dividend steadily from ₹0.40 (FY17) to a peak of ₹2.20 in FY24, then reversed course: ₹2.00 in FY25 and now ₹1.50 in FY26. That is a two-year declining trend and a cumulative ~32% drop from the peak. The company has paid a dividend every single year over this window, so it is a committed payer — but the direction of travel has clearly turned down, tracking the recent fall in reported profit.
Classification: Consistent Payer, but on a shrinking trend. The consistency (10 straight years) is a genuine positive. The shrinking absolute payout for two years running is the caution flag — it tells you management is prioritising cash for the business over rewarding shareholders, which the growth investment plans (below) help explain.
Financial Performance Analysis
The Operating Leverage Problem (Consolidated, FY26 vs FY25)
| Metric | FY26 | FY25 | Change |
|---|---|---|---|
| Revenue from Operations | ₹4,141 Cr | ₹4,151 Cr | −0.2% |
| Operating EBITDA | ₹392 Cr | ₹537 Cr | −27% |
| EBITDA Margin | 9.5% | 12.9% | −3.4 pts |
| Profit Before Tax | ₹166 Cr | ₹338 Cr | −51% |
| Net Profit (PAT) | ₹126.68 Cr | ₹250 Cr | −49% |
| EPS (Basic) | ₹6.40 | ₹12.62 | −49% |
Why Profit Halved on Flat Revenue
This is the classic negative operating-leverage trap: sales stayed still while costs climbed. The three culprits, all from the audited results:
- Employee costs up ~19.3% (₹516 Cr vs ₹433 Cr) — partly a one-time hit: the new Labour Codes forced ~₹9.6 Crore of past-service cost (gratuity & leave) into this year’s wage bill.
- Depreciation up ~37.3% (₹159 Cr vs ₹116 Cr) — the cost of recent capacity expansion and acquisitions now flowing through the P&L.
- Finance costs up ~10.5% (₹136 Cr vs ₹123 Cr) — including a ₹12.82 Crore interest charge on a delayed IGST refund paid to Maharashtra GST authorities.
Standalone vs consolidated: On a standalone (parent-only) basis, PAT was ₹144.61 Crore with EPS of ₹7.30. The consolidated number (₹126.68 Cr) is lower because the overseas subsidiaries (US acquisitions Fluvitex and Modern Home Textiles) posted a combined net loss of ~₹27.8 Crore for the year, per the auditor’s note. Since the dividend is paid by the parent, the standalone profit is the more relevant cover for the payout — and it is healthier than the group number.
Cash Flow Analysis
Reported profit is an opinion; cash is a fact — and here the cash tells a better story than the profit. Even though PAT halved, Indo Count actually generated more operating cash in FY26 than in FY25.
Consolidated Cash Generation
- Operating Cash Flow (FY26): ₹572.86 Cr
- Operating Cash Flow (FY25): ₹394.14 Cr
- Capital Expenditure (FY26): ~₹202 Cr
- Free Cash Flow (FY26): ~₹370.6 Cr
- Dividend Outflow: ~₹29.71 Cr
Profit vs Cash Divergence
Operating cash flow (₹573 Cr) came in at roughly 4.5x the reported net profit of ₹127 Cr. The reason is non-cash and working-capital swings: depreciation of ₹159 Cr is a book charge (no cash out), and the company collected ₹80.7 Cr from trade receivables and stretched trade payables by ₹165.5 Cr, releasing cash. So the profit dip is largely accounting- and cost-driven, while the cash engine kept running.
How the dividend is funded: the ₹1.50 dividend costs about ₹29.71 Crore. Against ₹370.6 Crore of free cash flow, that is comfortably covered ~12.5 times over. This dividend is being paid out of current cash generation, not from borrowings or asset sales. Note, however, that the company redirected a large chunk of that cash to deleveraging in FY26 — net financing outflow was ~₹349 Crore as short-term borrowings were repaid.
Balance Sheet Strength
Liquidity & Debt (Consolidated)
- Cash & Equivalents: ₹113.56 Cr
- Current Investments: ₹190.07 Cr
- Total Cash + Investments: ~₹303.6 Cr
- Total Borrowings: ~₹1,073.7 Cr
- Net Debt: ~₹770 Cr
- Total Equity (Net Worth): ₹2,355.3 Cr
What This Means
Indo Count carries a net debt of roughly ₹770 Crore against a net worth of ~₹2,355 Crore — a net debt-to-equity of about 0.33x, which is moderate for a working-capital-heavy exporter. Encouragingly, the company cut its current (short-term) borrowings from ~₹947 Cr to ~₹734 Cr during the year. Inventory (₹1,251 Cr) and receivables (₹513 Cr) are large, reflecting the export cycle.
Cash coverage of dividend: the ₹303.6 Crore of cash and liquid investments covers the ₹29.71 Crore dividend more than 10 times over. The balance sheet has no difficulty affording this payout. The constraint on a bigger dividend is not affordability — it is management’s choice to fund an aggressive capacity-and-growth push (see Sustainability and What to Monitor).
Dividend Sustainability Analysis
Four-Test Sustainability Scorecard
| Test | Reading | Verdict |
|---|---|---|
| Earnings coverage | EPS ₹6.40 vs DPS ₹1.50 = 4.3x | Strong |
| Operating cash cover | ₹573 Cr OCF = 19.3x outflow | Very Strong |
| Free cash cover | ₹370.6 Cr FCF = 12.5x outflow | Strong |
| Liquidity / cash cover | ₹303.6 Cr cash = 10.2x outflow | Strong |
Verdict: Sustainable. On every quantitative test, a ₹1.50 dividend (payout ~23% of profit, and a tiny fraction of cash flow) is easily affordable. The low payout ratio actually gives the company a large buffer — even if profits stayed depressed, the dividend has room to spare. The risk to future dividends is not affordability but appetite: management has shown it will trim the payout to conserve cash for growth. A flat or lower dividend in a weak year is plausible; a suspension is not indicated by these numbers.
Peer Comparison
| Company | Div/Share (FY26) | Approx Yield | 3-Yr ROE |
|---|---|---|---|
| Indo Count | ₹1.50 | ~0.34% | ~11.2% |
| Welspun Living | ₹0.10 | ~0.07% | ~11.1% |
| Vardhman Textiles | ₹5.00 | ~0.8–2.0% | ~7.6% |
| Trident | Regular payer | ~2.0% | Moderate |
Peer figures sourced from Screener, TipRanks, INDmoney and public data; yields move with price and are approximate. Comparison is indicative, not a ranking.
Where Indo Count sits: its 0.34% yield is higher than Welspun Living (barely 0.07%) but well below Vardhman and Trident, which yield around 2%. Indo Count’s FY26 return ratios (ROE ~5.5%, ROCE ~8.2% on Screener’s latest consolidated read; ~11.2% ROE on a 3-year average) reflect the profit dip. Across the home-textile pack, none of these are high-yield income stocks — the sector generally trades on export-growth expectations, and Indo Count is priced at the richer end (P/E ~58 vs Vardhman ~19).
Promoter Impact Analysis
Shareholding (Jun 2026)
- Promoters: 58.74%
- FII / Foreign: ~10.14%
- Mutual Funds: ~5.08%
- Retail & Others: ~25.30%
Who Gets the Cash
- Total dividend outflow: ~₹29.71 Cr
- Promoter share (58.74%): ~₹17.45 Cr
- Public shareholders’ share: ~₹12.26 Cr
Reading the alignment: because promoters hold a clear majority (58.74%), roughly ₹17.45 Crore of the ₹29.71 Crore dividend flows back to the promoter family. That is normal for a promoter-led company and means the family’s interests are broadly aligned with minority holders on payout. The fact that promoters chose to cut the dividend — foregoing some of their own cash to keep money in the business — is a mild signal that management genuinely prioritises reinvestment over near-term distribution. FIIs and mutual funds both nudged up their stakes in the June 2026 quarter, per public data.
Taxation Analysis
How Dividends Are Taxed in India (FY2025-26)
- Slab-rate taxation: the whole dividend is added to your income and taxed at your personal slab rate (0% to 30% plus cess).
- TDS (Section 194): the company deducts 10% TDS only if your total dividend from that company crosses ₹10,000 in the year (threshold raised from ₹5,000 with effect from 1 April 2025). No PAN means 20%.
- TDS is not the final tax — it is adjustable against your final liability when you file your return.
- NRIs: 20% TDS under Section 195, or a lower DTAA rate with Form 10F and a Tax Residency Certificate.
- Section 57: interest on money borrowed to buy the shares is deductible, capped at 20% of the dividend.
Worked Example (illustrative)
Investor owns 1,000 shares; dividend ₹10 per share; 30% tax slab:
- Gross Dividend: ₹10,000
- Tax at 30% + 4% cess (31.2%): ~₹3,120
- Net Dividend in hand: ~₹6,880
- TDS: 10% applies above ₹10,000/year (adjustable in ITR)
For an Actual ICIL Holder
At ₹1.50 per share, a holder of 1,000 ICIL shares receives ₹1,500 gross — comfortably below the ₹10,000 TDS threshold, so no TDS is deducted. The ₹1,500 is still added to income and taxed at slab. A 30%-slab investor keeps ~₹1,032 after tax; a 5%-slab investor keeps ~₹1,422. On a ~₹443 share, that is a post-tax yield of roughly 0.23%–0.32%.
Key Risks
- 1. Margin compression is real, not one-off. EBITDA margin fell from ~12.9% to ~9.5%. Some drivers were one-time (Labour Code catch-up, IGST interest), but employee and depreciation costs are structurally higher now, and management’s own FY26 EBITDA was described as pressured by incubation costs and weak fixed-cost absorption.
- 2. US tariff and demand risk. Indo Count is an export-heavy home-textile maker with large US operations; reported US tariff actions on Indian goods and soft global home-furnishing demand directly threaten volumes and pricing.
- 3. Loss-making overseas subsidiaries. The acquired US entities (Fluvitex, Modern Home Textiles) posted a combined ~₹27.8 Crore net loss in FY26, dragging consolidated profit below standalone.
- 4. Rich valuation vs weak returns. A P/E near 58 and P/B near 3.7 sit against ROE of ~5.5% and flat revenue — the price already assumes a strong FY27 recovery.
- 5. Working-capital and debt intensity. Large inventory and receivables plus ~₹770 Crore net debt make cash flow sensitive to the export cycle and interest rates.
- 6. Dividend direction is downward. Two consecutive annual cuts (₹2.20 → ₹2.00 → ₹1.50) show the payout is not a management priority right now.
What To Monitor
- 1. The FY27 revenue target. Management has publicly guided to ~₹5,500 Crore revenue in FY27 (roughly 30% growth) and 105–110 million metres of volume. Track quarterly progress toward that number — the current valuation depends on it.
- 2. EBITDA margin recovery. Watch whether margins climb back toward the low-teens as one-time costs roll off and volumes absorb fixed costs. Q1 FY27 already showed a profit rebound (net profit ~₹63 Cr).
- 3. Overseas subsidiary turnaround. Whether Fluvitex and Modern Home Textiles move from loss to profit will decide how close consolidated earnings track standalone.
- 4. Net debt trajectory. Continued repayment of short-term borrowings would strengthen the balance sheet and free future cash for either growth or higher dividends.
- 5. Next year’s dividend decision. A return to ₹2.00+ would signal management confidence; another cut would confirm a reinvestment-first stance.
- 6. US tariff and FTA developments. India-UK FTA progress is a tailwind; US tariff escalation is a headwind — both move this exporter’s earnings.
Conclusion
Indo Count’s FY26 final dividend of ₹1.50 per share is a study in the gap between headline and reality. The “75%” label is impressive; the real yield of ~0.34% is not. More importantly, this is a dividend cut — the second in a row — landing in a year when consolidated profit nearly halved on flat revenue, squeezed by higher employee, depreciation and finance costs.
Positives
- 10 straight years of dividends — a committed payer
- Dividend covered 12.5x by free cash flow
- Operating cash flow rose to ₹573 Cr despite the profit fall
- Short-term debt reduced; moderate 0.33x net gearing
- Ambitious FY27 growth roadmap (~₹5,500 Cr target)
Negatives
- Dividend cut 25% year-on-year; two-year downtrend
- Net profit down ~49%; EBITDA margin down 3.4 pts
- Overseas subsidiaries loss-making in FY26
- Rich valuation (P/E ~58) vs modest ROE (~5.5%)
- Negligible income appeal — yield ~0.34%
The one-line takeaway: the dividend is perfectly safe and comfortably funded — but it is small, shrinking, and beside the point. Indo Count is being valued as a home-textile growth and export-recovery play, and the dividend is a token, not a thesis. Read this stock through the FY27 execution lens, not the dividend lens.
Frequently Asked Questions
What dividend has Indo Count Industries announced for FY2025-26?
What is the actual dividend yield of Indo Count?
What was the record date for the Indo Count dividend?
What is the ex-date for this dividend?
When will the Indo Count dividend be paid?
Who is eligible for the dividend?
How is the Indo Count dividend taxed?
Is the Indo Count dividend sustainable?
Why did Indo Count cut its dividend?
What is Indo Count’s dividend history?
Is Indo Count a good dividend (income) stock?
What should investors monitor going forward?
What is the difference between standalone and consolidated profit here?
How much of the dividend goes to promoters?
Disclaimer
This article is for informational and educational purposes only and does not constitute investment, financial, legal or tax advice, nor any recommendation to buy, sell or hold any security. ShareBazaar Online is not a SEBI-registered investment adviser. Figures are compiled from the company’s audited FY2025-26 results filed with the exchanges and from public third-party sources (Screener, TipRanks, INDmoney, Yahoo Finance, exchange records); market prices and yields are approximate and change constantly. Computed ratios are our own analysis and may contain errors. Dividends are subject to shareholder approval at the AGM and to applicable taxes. Please verify all data independently and consult a SEBI-registered adviser and a qualified tax professional before making any investment decision. Investments in securities are subject to market risks.