
Dividend Snapshot
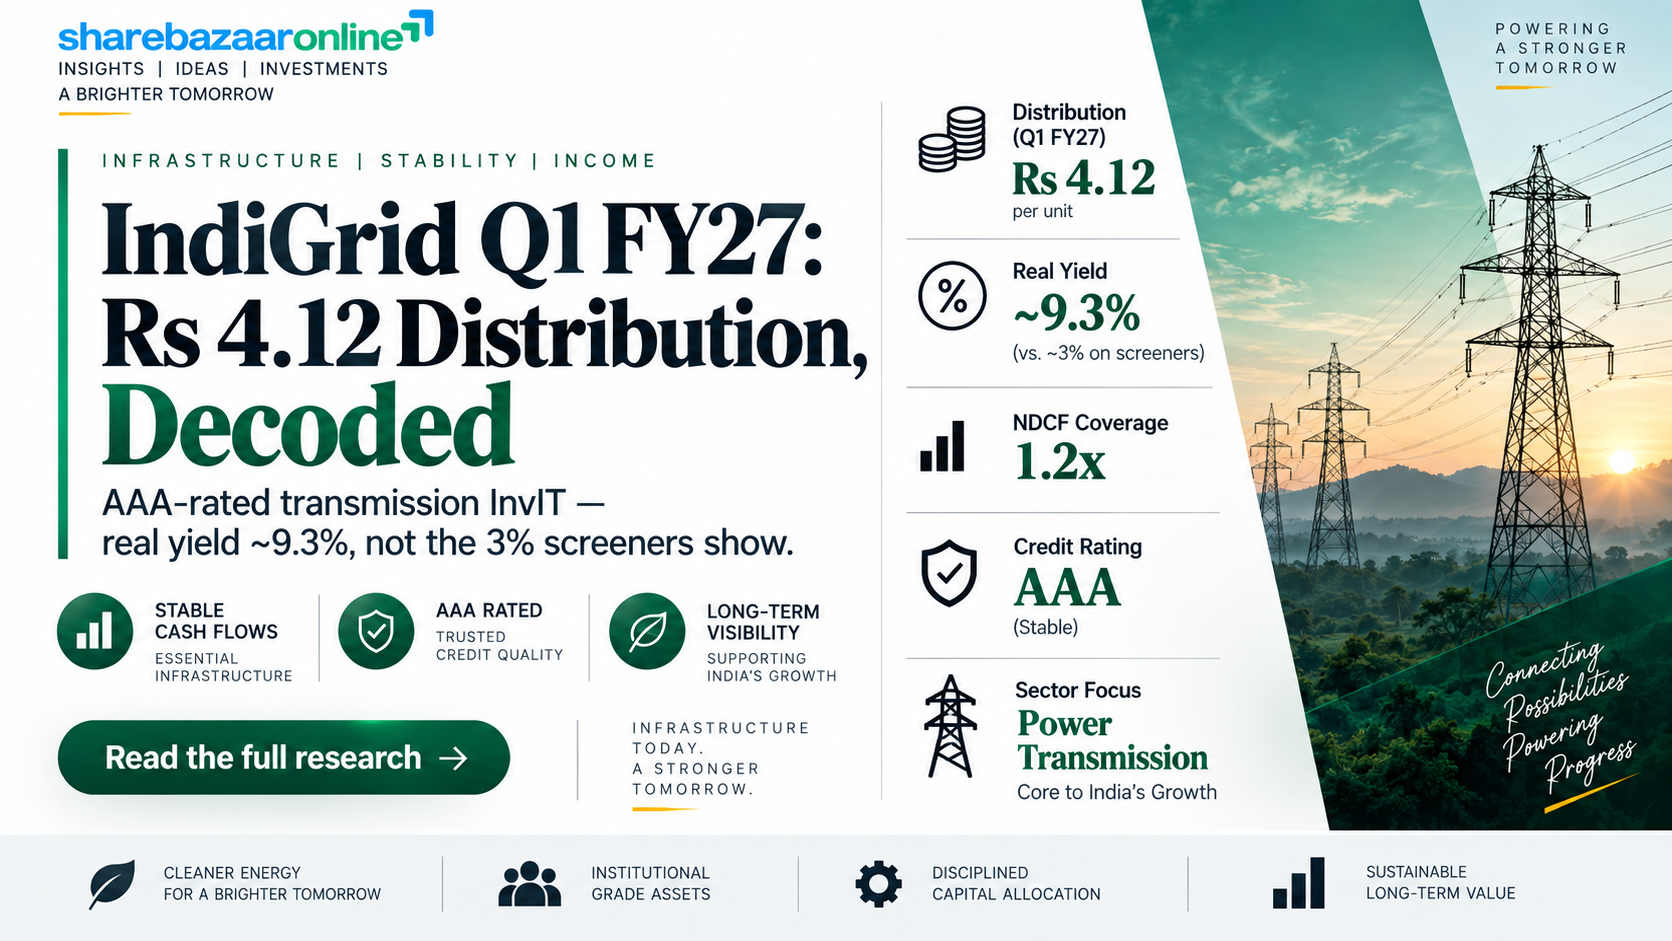
IndiGrid Infrastructure Trust (formerly India Grid Trust) declared its Q1 FY27 distribution of Rs 4.12 per unit on 13 August 2026. Because IndiGrid is an Infrastructure Investment Trust (InvIT), this payout is a distribution, not a company dividend – it is split into interest, a small taxable dividend, and a return of capital. Each part is taxed differently, which most screeners miss.
Distribution Per Unit (Q1 FY27)
Rs 4.12
Interest Rs 2.6909 + Dividend Rs 0.0224 + Capital repayment Rs 1.4067
Real Cash Distribution Yield
~9.3% – 9.5%
FY26 trailing 9.25%; FY27 guided 9.47% (on CMP Rs 174)
Distribution Type
Interim (Quarterly)
4th consecutive quarterly payout for FY27 cycle
Record Date
17 Aug 2026
Paid on or before 24 Aug 2026 (already paid)
Watch this gap: Popular screeners show IndiGrid’s “dividend yield” as roughly 3.23% because only the tiny Rs 0.0224 taxable-dividend slice is counted as a dividend. The actual cash a unitholder receives – interest plus dividend plus capital return – works out to about 9.3%–9.5%. Judging IndiGrid on the 3% headline number badly understates the payout. (Yield math: Rs 16.10 FY26 / Rs 16.48 FY27 guidance ÷ Rs 174. Source: Screener.in, IndiGrid Q1 FY27 filing.)
Dividend Announcement Summary
On 13 August 2026, the Board of IndiGrid Investment Managers Limited (IIML), acting as Investment Manager to IndiGrid Infrastructure Trust, approved a Q1 FY27 (quarter ended 30 June 2026) distribution of Rs 4.12 per unit. Management kept its full-year FY27 DPU guidance at Rs 16.48, implying about 6.7% growth over FY26’s Rs 16.10, and reiterated a medium-term target of 3–5% annual DPU growth. (Source: IndiGrid Q1 FY27 results, 13 Aug 2026.)
What the trust owns
India’s first and largest listed power-sector InvIT: ~9,698 ckm of transmission lines, ~32,550 MVA of substation capacity and ~1.5 GWp of solar, plus battery storage under construction, across 20 states and 2 union territories. Assets Under Management were Rs 34,041 crore as of 30 June 2026.
Why the cash flow is stable
Transmission assets earn availability-based tariffs under 25-year-plus contracts – income does not depend on how much power actually flows. Weighted-average transmission availability was 99.64% in Q1 FY27, which underpins predictable distributions.
Distribution components (Q1 FY27)
| Component | Rs / unit | Share | Taxed as |
|---|---|---|---|
| Interest | 2.6909 | 65.3% | Slab rate (TDS 10%) |
| Dividend | 0.0224 | 0.5% | Slab rate (TDS 10%) |
| Capital repayment | 1.4067 | 34.1% | Not taxed now; reduces cost of units |
| Total DPU | 4.1200 | 100% | Mixed |
Key Dates Timeline
Announcement Date
13 August 2026
Board approved Q1 FY27 results and DPU
Record Date
17 August 2026
Unitholders on record were eligible
Ex-Date
17 August 2026
Coincides with the record date under India’s T+1 settlement, consistent with IndiGrid’s recent payouts
Payment Date
On or before 24 August 2026
Credited to registered bank mandates
This distribution cycle is complete. Investors who held units on the record date of 17 August 2026 received the payout; anyone who bought on or after the ex-date did not qualify for this particular distribution.
Dividend Yield Analysis
The single most important number for any InvIT is its cash distribution yield. IndiGrid pays quarterly, so the annual run-rate matters more than any one quarter. On the current market price of Rs 174 (11 Sep 2026 close), the numbers are: (Source: Screener.in, IndiGrid filings.)
FY26 trailing yield
9.25%
Rs 16.10 paid in FY26 ÷ Rs 174
FY27 forward yield (guidance)
9.47%
Rs 16.48 guided ÷ Rs 174
Trailing four quarters
9.32%
Rs 16.22 (Q2 FY26 to Q1 FY27) ÷ Rs 174
Yield on announcement price
9.26%
Rs 16.48 guided ÷ Rs 178 (13 Aug 2026)
Yield reality check
IndiGrid’s ~9.3% yield is not the product of a falling unit price or a one-off special payout. The unit is trading near its 52-week high (Rs 181), well above its NAV of Rs 146.93, and the DPU has risen every year. The high cash yield reflects the InvIT pass-through structure – the trust must distribute at least 90% of its net distributable cash flow – not distress. That said, a large part of the yield is return of your own capital (34% of Q1 DPU), so it should not be read as a pure income coupon like a bond.
Dividend History Analysis
Recent quarterly distributions (Rs per unit)
| Quarter | Record date | DPU (Rs) |
|---|---|---|
| Q1 FY27 | 17 Aug 2026 | 4.12 |
| Q4 FY26 | 14 May 2026 | 4.00 |
| Q3 FY26 | 17 Feb 2026 | ~4.05 |
| Q1 FY26 | 29 Jul 2025 | 4.00 |
| Q4 FY25 | 20 May 2025 | 4.10 |
| Q3 FY25 | 28 Jan 2025 | 3.75 |
| Q1 FY25 | 30 Jul 2024 | 3.75 |
| Q1 FY24 | 03 Aug 2023 | 3.45 |
Q3 FY26 shown as ~Rs 4.05 (FY26 total confirmed at Rs 16.10; the two mid-year quarters have not been individually re-verified – desk to confirm). Source: exchange filings, Trendlyne, Tipranks.
Annual DPU trend
FY24 ~Rs 13.80 → FY25 ~Rs 15.35 → FY26 Rs 16.10 → FY27 guidance Rs 16.48. Since listing in June 2017, IndiGrid has distributed about Rs 113 per unit, a roughly 6.7% year-on-year DPU growth rate and about 13% annualised total return. (Source: IndiGrid investor disclosures.)
Verdict: Consistent Payer
Across 30-plus quarters IndiGrid has never cut or suspended its distribution and has raised it steadily. There are no one-off special distributions inflating the record. On the classification scale, this is a Consistent (and Growing) Payer – among the strongest track records in the Indian InvIT space.
Financial Performance Analysis
For an InvIT, accounting profit is a poor guide to distribution capacity because heavy non-cash depreciation depresses reported net profit while cash keeps flowing in. That is exactly IndiGrid’s picture: modest and lumpy PAT, but strong and rising operating cash. (Consolidated. Source: Screener.in.)
Consolidated performance (Rs crore)
| Metric | FY24 | FY25 | FY26 |
|---|---|---|---|
| Revenue | 2,864 | 3,288 | 4,768 |
| Operating profit | 2,439 | 2,891 | 3,075 |
| Net profit (PAT) | 296 | 410 | 399 |
| Cash from operations | 2,663 | 2,902 | 3,377 |
Q1 FY27 growth was strong
Reported revenue rose 29.4% year-on-year to Rs 1,087 crore, reported EBITDA rose 28.7%, operational EBITDA rose 23.6% (margin 89.1%), and NDCF grew 29.4% to Rs 370 crore. Growth came from new acquisitions and the commissioning of previously under-construction assets.
Where profits lag revenue
PAT is small versus revenue because interest (Rs 1,651 cr in FY26) and depreciation (Rs 1,145 cr) together consume most of the operating profit. In FY26, a service-concession accounting change also lifted reported revenue and expenses. So do not judge the payout by the sub-Rs 5 EPS – judge it by cash.
Cash Flow Analysis
Reported profit is an opinion; cash is a fact. Here the cash is genuinely strong. In FY26, IndiGrid’s operating cash flow of Rs 3,377 crore was about 110% of operating profit and roughly 8.5 times its reported PAT of Rs 399 crore. This CFO-to-operating-profit ratio has stayed near or above 100% for years, which is the hallmark of a genuine cash-generating asset base rather than accrual-driven earnings. (Source: Screener.in cash-flow statement.)
How the distribution is funded
The interest and dividend portion (about Rs 309 crore in Q1 FY27) is comfortably covered by NDCF of Rs 370 crore – roughly 1.2x cover. The capital-repayment portion (about Rs 160 crore) is a deliberate return of capital, funded from refinancing and reserves, not from current operating income.
The one caveat: Q1 is seasonally tight
Total Q1 FY27 payout (~Rs 469 crore) exceeded Q1 NDCF (Rs 370 crore), so about Rs 99 crore came from reserves. This is normal for IndiGrid: transmission collections run lower in Q1 (collection efficiency 95%, receivable days 38) and typically improve later in the year. It is worth watching, but it is a timing feature, not a red flag.
Free cash flow swings with the acquisition cycle (FY25 was strongly positive at Rs 2,141 crore; FY26 was negative Rs 526 crore as capex and acquisitions ramped). For a growth InvIT this is expected – new assets are bought to lift future distributions – but it does mean the trust relies on debt and fresh unit issuance to fund growth rather than internal surplus.
Balance Sheet Strength
Cash balance
Rs 1,511 cr
As of 30 Jun 2026
Gross borrowings
~Rs 21,100 cr
89% fixed-rate; avg cost 7.4%
Net debt to AUM
58.5%
Below the 70% SEBI ceiling for InvITs
Interest coverage
2.29x
Credit rating: AAA (all three agencies)
IndiGrid carries an AAA/Stable rating from CRISIL, ICRA and India Ratings, with 89% of borrowings on fixed rates that insulate it from rate hikes. NAV per unit stood at Rs 146.93 (30 Jun 2026), so at Rs 174 the units trade at about 1.18x NAV – a premium the market awards for growth and stability. FY27 refinancing needs are modest at ~Rs 1,900 crore (under 10% of borrowings). (Source: IndiGrid Q1 FY27 disclosures, rating agency updates.)
The trade-off to note: leverage near 58.5% of AUM and interest coverage of only 2.29x mean IndiGrid is a leveraged yield vehicle. Its distribution safety depends on refinancing large debt at reasonable rates. The AAA rating and fixed-rate book make this manageable today, but leverage is the single biggest structural risk in the model.
Dividend Sustainability Analysis
For an InvIT the right sustainability test is NDCF and cash coverage, not the accounting payout ratio. On an accounting basis IndiGrid’s FY26 payout looks like it exceeds 100% of profit – but that is meaningless here because depreciation is non-cash. The four-test scorecard tells the real story:
1. NDCF coverage
Income portion of DPU covered ~1.2x by NDCF; full DPU at ~0.8x in a seasonally soft Q1 (topped up from reserves). Adequate.
2. Operating cash coverage
FY26 CFO Rs 3,377 cr comfortably exceeds full-year distribution of ~Rs 1,830 cr. Strong.
3. Liquidity / cash coverage
Rs 1,511 cr cash covers roughly one full quarter of distribution; modest FY27 refinancing. Comfortable.
4. Earnings / cash-flow trend
Revenue, EBITDA and NDCF all growing ~25–30% YoY; DPU rising each year. Positive.
Verdict: Sustainable, with leverage the key dependency
The current distribution is well supported by operating cash and long-dated contracted tariffs. The dependency to watch is debt refinancing and continued acquisition-led growth: the model needs to keep buying value-accretive assets and rolling debt at reasonable rates to sustain 3–5% annual DPU growth. On today’s numbers, the payout is Sustainable.
Peer Comparison
Listed InvIT distribution yields (approx.)
| InvIT | Segment | Approx. DPU | Approx. yield | Profile |
|---|---|---|---|---|
| IndiGrid | Transmission + solar | Rs 16.10–16.48 | ~9.3% | AAA; DPU growing; active acquirer |
| PowerGrid InvIT | Transmission (PSU) | ~Rs 12 | ~12% | AAA; DPU flat; AUM stagnant |
| IRB InvIT | Toll roads | varies | ~10–11% | Higher yield; heavier return-of-capital |
Yields are approximate and move with unit prices; verify on trade date. Source: PrimeInvestor, BondScanner, Trendlyne (2025–2026).
Why IndiGrid yields less than PGInvIT
A lower yield is not a weakness here. IndiGrid trades at a premium (higher price, lower yield) because the market rewards its rising DPU, growing AUM and AAA balance sheet. PowerGrid InvIT offers a higher headline yield but its distribution has been broadly flat and its asset base has not grown – a higher yield can signal lower expected growth.
Quality markers
On stability, IndiGrid scores well: availability-based, 25-year-plus contracted transmission revenue; 99.64% availability; AAA rating; and a diversified pool of 55-plus lines plus solar. Toll-road InvITs carry traffic risk and steeper return-of-capital, making their higher yields less comparable to pure income.
Promoter Impact Analysis
InvITs do not have “promoters” in the way listed companies do – they have a sponsor and an investment manager. IndiGrid’s investment manager is controlled by KKR, and GIC is a large co-investor. Crucially, the unitholding is widely spread rather than concentrated in a single promoter, so distributions flow largely to public and institutional investors. (Based on IndiGrid’s latest disclosed unitholding pattern; sponsor-entity classification can understate KKR’s total economic interest held via affiliates.)
Who receives the distribution (illustrative, on ~Rs 1,875 cr FY27 guided outflow)
| Holder category | Approx. holding | Approx. distribution (Rs cr) |
|---|---|---|
| Retail unitholders | 29.2% | ~548 |
| Other FIIs | 19.2% | ~360 |
| Corporates & trusts | 18.9% | ~354 |
| Insurance companies | 14.2% | ~266 |
| GIC | 7.4% | ~139 |
| KKR sponsor entity | 1.1% | ~21 |
Takeaway: Because retail investors hold nearly 30% of units, ordinary unitholders capture the single largest slice of the distribution – a structural positive versus promoter-heavy Indian companies where payouts concentrate at the top. The alignment is with all unitholders, not a controlling family.
Taxation Analysis
InvIT distributions are taxed under Section 115UA / 194LBA of the Income Tax Act, and the three components are treated very differently. This is the part most investors get wrong.
Interest component
Taxable at your slab rate. The trust deducts TDS at 10% for resident unitholders (higher for non-residents).
Dividend component
For IndiGrid this slice is flagged as a taxable dividend (its SPVs are under the concessional tax regime), so it is taxable at your slab rate with 10% TDS.
Capital-repayment component
Not taxed on receipt. It reduces your cost of acquisition; once cumulative repayments exceed your purchase price, the excess becomes taxable (as per the Finance Act 2023 rules).
Why this matters
The headline yield overstates taxable income: a third of IndiGrid’s payout is tax-deferred return of capital. Your post-tax income is better than a slab-taxed bond of the same yield.
Worked example: 1,000 units, Q1 FY27 (Rs 4.12), 30% tax slab
| Gross distribution | Rs 4,120.00 |
| – Interest (slab-taxable) | Rs 2,690.90 |
| – Dividend (slab-taxable) | Rs 22.40 |
| – Capital repayment (deferred) | Rs 1,406.70 |
| Taxable now (interest + dividend) | Rs 2,713.30 |
| TDS deducted at 10% | Rs 271.33 |
| Total tax at 30% slab | Rs 813.99 |
| Net cash retained (cap-repay tax deferred) | Rs 3,306.01 |
Illustrative; excludes cess and surcharge. Capital-repayment tax is deferred until it exceeds your cost of units. Consult a tax adviser. This is not tax advice.
Key Risks
1. Leverage and refinancing risk
Net debt is 58.5% of AUM with interest coverage of just 2.29x. Distributions depend on rolling ~Rs 21,100 cr of debt at reasonable rates; a sharp rise in rates or a rating slip would pressure payouts.
2. Growth requires constant fundraising
DPU growth relies on acquiring new assets, funded by fresh unit issuance and debt. Repeated preferential issues can dilute existing unitholders if acquisitions are not value-accretive.
3. Return-of-capital erosion
About a third of each distribution is return of capital. If not reinvested well by the unitholder, the “9% yield” partly reflects the investor’s own capital coming back.
4. Regulatory and tariff risk
Cash flows depend on SEBI InvIT rules and the TBCB tariff framework. Changes to InvIT taxation, leverage caps, or transmission tariff norms could affect distributions.
5. Interest-rate sensitivity of the unit price
As a yield instrument, IndiGrid’s unit price tends to fall when bond yields rise, and vice-versa. Capital values can be volatile even when distributions are steady.
6. Seasonal and collection risk
Q1 collections are seasonally lower and part of the Q1 payout drew on reserves. Persistent collection slippage or receivable build-up would be an early warning sign.
What To Monitor
1. NDCF per unit vs DPU
Track whether the income portion of DPU stays covered by NDCF as the year progresses. Q1 is tight; Q2–Q4 should improve.
2. Net debt to AUM
Watch that leverage stays comfortably below the 70% SEBI ceiling as acquisitions are funded.
3. Average cost of debt and refinancing
Currently 7.4% with 89% fixed. Rising costs on the ~Rs 1,900 cr FY27 refinancing would squeeze distributable cash.
4. Acquisition pipeline execution
The identified pipeline is over Rs 13,500 cr (transmission, BESS, EnerGrid greenfield). Value-accretive deals drive future DPU; overpaying would not.
5. Unit issuance and dilution
Track new preferential issues (a Rs 2,000 cr raise was approved in July 2026) and whether DPU per unit keeps rising despite a larger unit base.
6. Collection efficiency and receivable days
Transmission collections (95% in Q1) and receivable days (38) are the cleanest early indicators of cash-flow health.
Conclusion
IndiGrid’s Q1 FY27 distribution of Rs 4.12 per unit continues an unbroken record of steady, growing payouts, backed by AAA-rated, contracted, availability-based transmission cash flows. The real cash yield of about 9.3%–9.5% is far higher than the ~3% “dividend yield” shown on standard screeners, because most of the distribution is interest and return of capital rather than a classified dividend.
Positives
Consistent, rising DPU; ~110% cash conversion; AAA rating; long-dated contracted revenue; 99.64% availability; broad unitholder base; distribution guidance of Rs 16.48 for FY27.
Negatives / watch-outs
High leverage (58.5% of AUM, 2.29x coverage); reliance on debt and unit issuance to grow; a third of the payout is return of capital; Q1 payout drew on reserves; unit price is interest-rate sensitive.
On the desk’s framework, the distribution is Sustainable, with debt refinancing and disciplined, value-accretive acquisitions as the factors that will decide whether the 3–5% DPU growth target holds. As always, we present the evidence – positives, negatives, risks and what to monitor – and leave the decision to you.
Frequently Asked Questions
What distribution has IndiGrid announced for Q1 FY27?
What is IndiGrid’s dividend / distribution yield?
What was the record date?
What was the ex-date?
When was the distribution paid?
Who was eligible for the distribution?
How is an IndiGrid distribution taxed?
Is IndiGrid’s distribution sustainable?
What is IndiGrid’s distribution history?
Why is part of the payout a “return of capital”?
How does IndiGrid compare with PowerGrid InvIT?
What should investors monitor going forward?
Disclaimer
This article is for information and educational purposes only and is not investment, financial or tax advice, nor a recommendation to buy, sell or hold any security or unit. IndiGrid Infrastructure Trust is an Infrastructure Investment Trust; its distributions carry market, credit, interest-rate and regulatory risks, and past distribution performance does not guarantee future payouts. Figures are drawn from company filings and public sources (including Screener.in, exchange disclosures, IndiGrid results, PrimeInvestor, BondScanner, Trendlyne and Tipranks) believed to be reliable as of September 2026, but ShareBazaar Online does not guarantee their accuracy or completeness; unit counts and yields are estimates that move with price and should be verified on the trade date. Taxation depends on your individual circumstances – please consult a SEBI-registered adviser and a qualified tax professional before investing. ShareBazaar Online and its authors accept no liability for any loss arising from the use of this information.