
Dividend Snapshot
Company
Plastiblends India Limited
NSE: PLASTIBLEN | BSE: 523648 | ISIN: INE083C01022
Dividend Recommended
₹3.00 per share (Final)
60% on face value of ₹5 | FY2025-26
Real Dividend Yield
~1.5% at market price
Not 60% — that figure is on face value, not the share price
Record Date
17 August 2026
Subject to shareholder approval at the AGM
Plastiblends India, the Kolsite group’s masterbatch flagship, raised its dividend to ₹3.00 from ₹2.50 a year earlier — a 20% increase. Yet three things sit beneath that headline: the “60%” is measured against a ₹5 face value (real yield is closer to 1.5%), the payout is still 29% below the ₹4.00–4.25 the company paid from FY21 to FY24, and free cash flow for the year was negative. The dividend is comfortably covered by earnings and a large mutual-fund treasury, but not by this year’s own cash generation.
Dividend Announcement Summary
At its board meeting on Monday, 27 April 2026, the Board of Directors of Plastiblends India recommended a final dividend of ₹3.00 per equity share of face value ₹5 each (i.e. 60%) for the financial year ended 31 March 2026. The recommendation is subject to approval of shareholders at the ensuing (35th) Annual General Meeting. The prior-year final dividend was ₹2.50 per share (50%).
What was declared
- Dividend type: Final dividend (single annual payout)
- Amount: ₹3.00 per share
- Percentage: 60% of ₹5 face value
- Financial year: FY2025-26
- Total outflow (computed): ~₹7.80 crore
Context alongside the results
- FY26 revenue from operations: ₹788.66 cr (+1.05% YoY)
- FY26 net profit (PAT): ₹36.69 cr (+9.71% YoY)
- FY26 EPS: ₹14.12 (vs ₹12.87)
- Auditors issued an unmodified opinion
- The company has no subsidiaries — results are standalone
Because Plastiblends India Limited has no subsidiaries, associates or joint ventures as on 31 March 2026, consolidated financial statements are not applicable. All figures in this analysis are therefore standalone, which for this company is the complete and correct dividend-capacity picture.
Key Dates Timeline
Announcement / Board Meeting
27 April 2026
Record Date
17 August 2026
Ex-Dividend Date
17 August 2026 (inferred)
Under India’s T+1 settlement, the ex-date coincides with the record date; confirm against the exchange corporate-action circular
Payment Date
Not Disclosed by Company
Final dividends are paid after the AGM, within the statutory 30-day window; in FY25 payment followed roughly 4 weeks after the record date
Shareholders whose names appeared in the register of members / depository records as of the 17 August 2026 record date were eligible to receive the ₹3.00 dividend, once approved at the AGM. To have been eligible, a buyer needed to hold the shares before the ex-date. Anyone who sold on or after the ex-date still received the dividend for those shares.
Dividend Yield Analysis
This is where most headlines mislead retail investors. The company “declared a 60% dividend.” That 60% is calculated on the ₹5 face value — it is not the return on your investment. Face value is an accounting label fixed decades ago; the market price is what you actually pay. The real yield is the ₹3 dividend divided by the share price.
Yield at the announcement
Around the 27 April 2026 announcement the stock traded near ₹172 (NSE, late April 2026). Dividend yield at that price:
₹3 ÷ ₹172 ≈ 1.74%
Yield at the latest price
The stock later recovered to about ₹205.84 (NSE, 14 July 2026). Dividend yield at that price:
₹3 ÷ ₹205.84 ≈ 1.46%
The reality: a “60%” dividend translates to a real cash yield of roughly 1.5%. That is broadly in line with the Basic Materials sector average (about 1.6% per aggregator data) and is not a “high-yield” stock. Plastiblends is better understood as a modest, growth-oriented payer than an income play. The 52-week trading range has been wide — roughly ₹121 to ₹217 (NSE) — so the effective yield an investor locks in depends heavily on entry price.
Dividend History Analysis
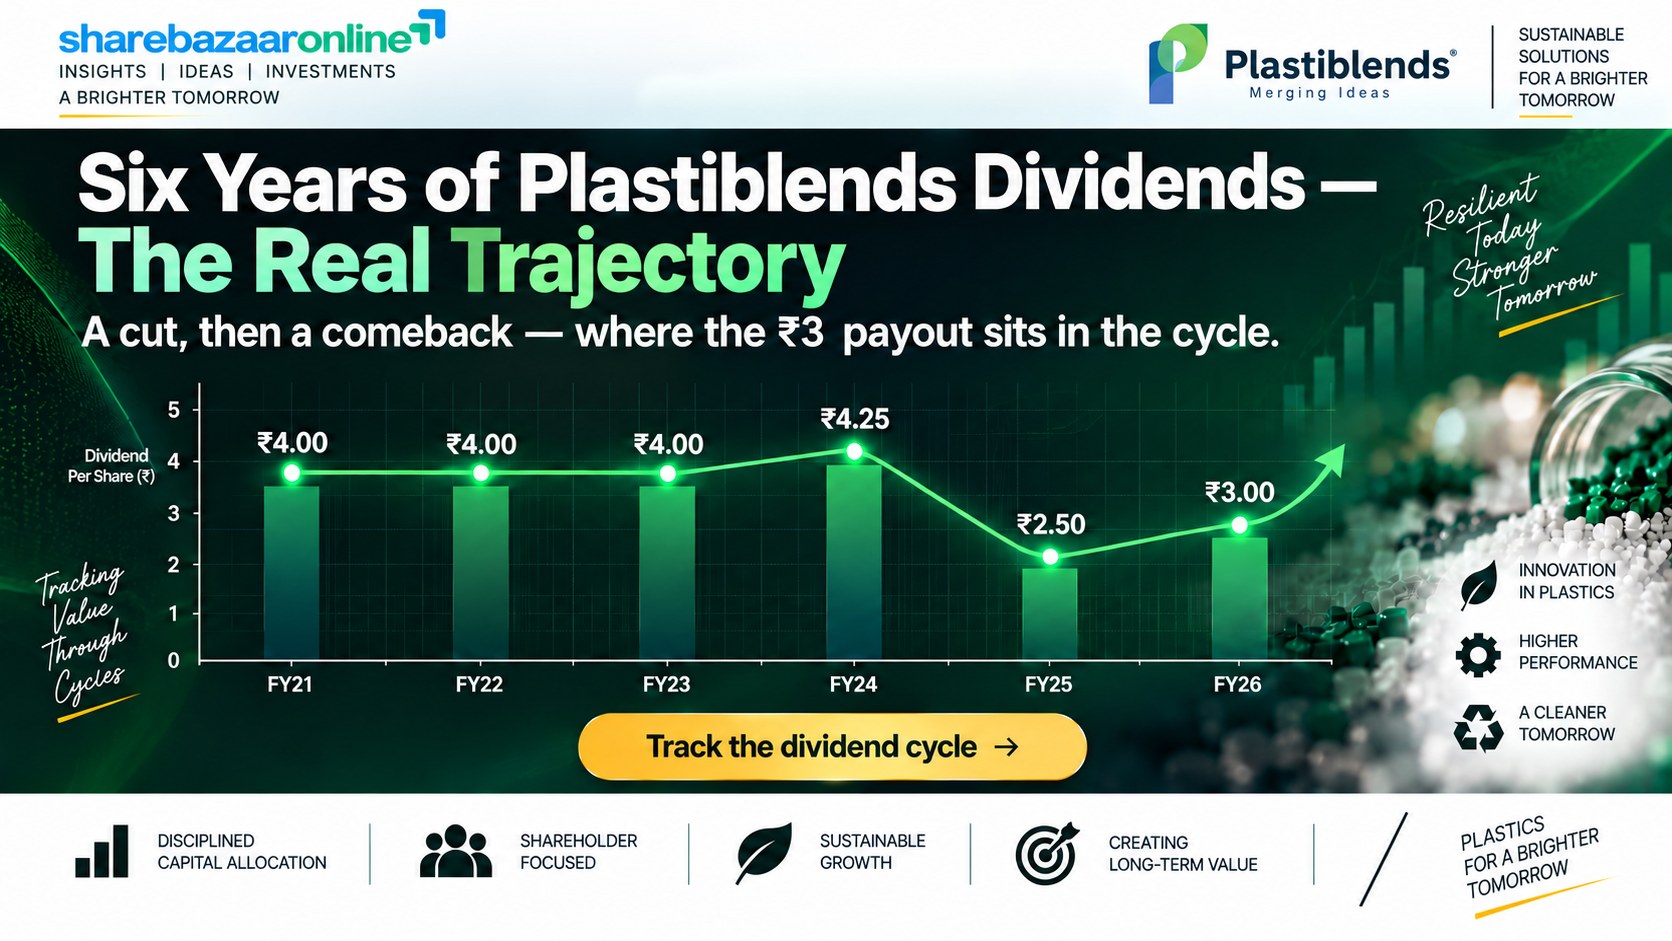
The company presents FY26 as a “raise” (₹2.50 → ₹3.00). True on a one-year view. But zoom out and the picture is a partial recovery from a cut, not a new high.
| Financial Year | Dividend / Share | % on FV ₹5 | Note |
|---|---|---|---|
| FY2020-21 | ₹4.00 | 80% | Plateau |
| FY2021-22 | ₹4.00 | 80% | Plateau |
| FY2022-23 | ₹4.00 | 80% | Plateau |
| FY2023-24 | ₹4.25 | 85% | Peak |
| FY2024-25 | ₹2.50 | 50% | Cut −41% |
| FY2025-26 | ₹3.00 | 60% | Recovery +20% |
Dividend history sourced from public exchange/aggregator records; the FY26 figure is from the company’s 27 April 2026 board outcome.
What the numbers show
- FY24 → FY25: cut of −41% (₹4.25 to ₹2.50)
- FY25 → FY26: recovery of +20% (₹2.50 to ₹3.00)
- FY26 is still 29% below the FY24 peak
- The company has paid a dividend every year in the record above
Classification
Plastiblends is a consistent but cyclical payer. It has never suspended the dividend, but the amount clearly tracks the margin cycle — it fell sharply when profits were squeezed in FY25 and is now rebuilding. Income investors should not assume the FY24 peak returns automatically; it is contingent on margins normalising.
Financial Performance Analysis
| Metric (Standalone) | FY2025-26 | FY2024-25 | Growth |
|---|---|---|---|
| Revenue from operations | ₹788.66 cr | ₹780.45 cr | +1.05% |
| EBITDA | ₹66.05 cr | ₹61.41 cr | +7.56% |
| Profit before tax | ₹48.82 cr | ₹44.92 cr | +8.67% |
| Net profit (PAT) | ₹36.69 cr | ₹33.44 cr | +9.71% |
| EPS (basic & diluted) | ₹14.12 | ₹12.87 | +9.71% |
| PAT margin | 4.65% | 4.28% | +37 bps |
Operating leverage: profit grew faster than sales
Revenue barely moved (+1.05%), but EBITDA rose +7.56% and PAT +9.71%. Profit outpacing flat revenue means margins expanded — EBITDA margin improved from 7.87% to 8.38%. The gains came from cost control and mix, not volume growth. The company’s five-year sales CAGR is a modest ~7.3%, which independent screeners flag as slow.
The Q4 caveat you should know
Q4 FY26 looked spectacular — PAT up +44.85% and EBITDA margin at 10.76%. But the company itself disclosed a one-time inventory gain in Q4: it was holding minimum inventory bought at pre-escalation rates. That flattered the quarter. The full-year EBITDA margin of 8.38% is the cleaner run-rate. Treat Q4’s spike as partly non-recurring.
Cash Flow Analysis
Reported profit is an opinion; cash is a fact. This is the most important section for a dividend, because a dividend is paid in cash, not in accounting profit. Here Plastiblends shows some strain.
Operating cash flow vs profit
- Net profit (PAT): ₹36.69 cr
- Operating cash flow (OCF): ₹21.33 cr
- OCF as % of PAT: 58%
Only ~58 paise of every rupee of profit converted into operating cash. The gap was absorbed by working capital.
Free cash flow was negative
- Operating cash flow: ₹21.33 cr
- Capital expenditure: −₹27.95 cr
- Free cash flow (FCF): −₹6.62 cr
After a heavy capex year (engineering-plastics expansion), the company generated no free cash. The ₹7.80 cr dividend was therefore not funded by FY26’s own free cash flow.
Where receivables and inventory went
Trade receivables grew 16.5% while revenue grew just 1.05% — a divergence worth watching, as it means sales are increasingly on credit. Receivables rose by ₹18.37 cr and inventory by ₹14.47 cr during the year, together locking up roughly ₹32.8 cr of cash. That working-capital build is the main reason OCF trailed profit.
How was the dividend funded, then? Not from current earnings-in-cash and not from free cash flow. It was funded from the company’s accumulated treasury of mutual-fund investments (about ₹41 cr) — a real, liquid resource, but a reserve being drawn on rather than replenished this year.
Balance Sheet Strength
Net cash, but with a twist
- Current investments (mutual funds): ₹41.10 cr
- Non-current investments: ₹15.14 cr
- Cash & bank balances: ₹5.56 cr
- Borrowings (bank overdraft): ₹19.997 cr
- Net cash surplus: ~₹41.8 cr
Equity & leverage
- Total equity: ₹449.05 cr
- Book value per share: ~₹172.8
- Debt-to-equity: ~0.04 (near debt-free)
- Promoter pledge: 0%
The company describes itself as net-cash-surplus, and on paper it is: liquid investments plus cash exceed borrowings by roughly ₹42 cr. But there is a subtlety the “net cash” label hides. Because Plastiblends drew a ₹20 cr bank overdraft to fund working capital, its reported year-end cash-and-equivalents balance was actually negative (−₹15.46 cr). In other words, the company simultaneously holds ₹41 cr in mutual funds and runs a ₹20 cr overdraft — a capital-allocation quirk explored below. Overall, the balance sheet is comfortably solvent; the dividend is not a solvency risk.
Dividend Sustainability Analysis
We test sustainability on four independent measures:
| Test | Result | Verdict |
|---|---|---|
| Earnings coverage (EPS ÷ DPS) | 4.71× | Pass |
| OCF coverage (OCF ÷ dividend) | 2.74× | Pass |
| FCF coverage (FCF ÷ dividend) | Negative FCF | Fail |
| Liquidity coverage (liquid assets ÷ dividend) | 7.93× | Pass |
Verdict: Moderately Sustainable
Three of four tests pass comfortably. The ₹3 dividend consumes only about 21% of profit and less than half of operating cash flow, and the company’s mutual-fund treasury could fund it nearly eight times over. The single failed test — negative free cash flow — is the reason this is “moderately” rather than “fully” sustainable. In FY26 the dividend was effectively paid from reserves, not from cash the business threw off after investing. That is fine for one year of heavy capex; it would be a concern if it repeated while margins stay compressed. Sustainability here rests on margin recovery and capex normalising, both of which management flags as uncertain in the near term.
Peer Comparison
| Company | Dividend Yield | Payout Ratio | ROE / ROCE |
|---|---|---|---|
| Plastiblends India | ~1.5% | ~21% | ~8% / ~10% |
| Ddev Plastiks | ~0.5% | ~4% | Not Disclosed |
| Basic Materials sector avg | ~1.6% | — | — |
Peer yields and ratios from public aggregator data; the listed masterbatch / plastics-additive peer set is small, so treat this as directional. Additional peer ratios not independently pulled are marked “Not Disclosed.”
Against its narrow peer set, Plastiblends screens as a relatively generous but still modest payer: its ~1.5% yield and ~21% payout are higher than plastics peer Ddev Plastiks and roughly in line with the broader Basic Materials average. Its return ratios are the weak point — ROE of about 8% and ROCE of about 10% are below what a capital-efficient specialty-chemicals business would target, which is one reason the stock trades at a low P/E (about 13×) and around book value. A generous payout on a low-ROE base is a reasonable capital-return choice, but it does not by itself signal a high-quality compounder.
Promoter Impact Analysis
Who receives the ₹7.80 cr
- Promoter holding (Kolsite group): ~62.81%
- Promoter share of dividend: ~₹4.90 cr
- Public / non-promoter share: ~₹2.89 cr
- FII ~0.23%, DII ~0% — institutions barely own the stock
What it means
Roughly 63 paise of every dividend rupee flows to the promoter family. That is neither unusual nor improper for a promoter-heavy company, and a rising dividend does align promoter and minority interests. But it is worth naming plainly: the biggest beneficiary of the raise is the controlling family, and with almost no institutional ownership, minority holders have limited external oversight of capital-allocation decisions.
Taxation Analysis
How dividends are taxed in India (FY2025-26)
- Since FY2020-21, dividends are taxable in the shareholder’s hands at their income-tax slab rate — there is no separate flat rate and no dividend-specific exemption.
- TDS under Section 194: the company deducts 10% TDS if total dividend from it exceeds ₹10,000 in a financial year (the threshold was raised from ₹5,000 effective 1 April 2025).
- If PAN is not furnished / is inactive, TDS is 20%.
- TDS is only tax collected at source — it is adjusted against your final liability; report gross dividend under “Income from Other Sources.”
- A resident with income below the taxable limit can file Form 15G/15H to avoid TDS.
Worked example
An investor holds 1,000 shares of Plastiblends and receives the ₹3 dividend, and is in the 30% tax slab:
- Gross dividend: 1,000 × ₹3 = ₹3,000
- TDS deducted: ₹0 — ₹3,000 is below the ₹10,000 Section 194 threshold
- Tax payable at 30% slab (plus cess): ~₹936 (₹900 tax + 4% cess)
- Net, after-tax dividend: ~₹2,064
- Effective post-tax yield (at ~₹206 price): the ~1.46% gross becomes ~1.0%
Note: this illustrative example uses the stated ₹3 dividend. The example figures in the standard template (₹10/share) do not apply here. A shareholder holding enough to cross ₹10,000 of dividend would additionally see 10% TDS withheld and later reconciled.
Key Risks
- Raw-material / margin volatility. Management has flagged elevated polymer and input costs from geopolitical disruption (Iran–USA conflict), a weak rupee and higher logistics/insurance costs. Masterbatch margins are thin (PAT margin ~4.7%), so input inflation hits profits directly — and the dividend tracks profits.
- Negative free cash flow. FY26 FCF was −₹6.62 cr. If heavy capex continues while margins stay compressed, the dividend would keep drawing on reserves rather than being self-funding.
- Working-capital stretch. Receivables grew 16.5% against 1.05% revenue growth, and the company is running a ₹20 cr overdraft. A further build in receivables or inventory could pressure liquidity.
- Low return ratios. ROE ~8% and ROCE ~10% are modest; sluggish ~7% five-year sales growth suggests the business is not compounding quickly, which caps long-term dividend growth.
- Concentration & oversight. Promoters hold ~63% with negligible institutional ownership, so minority shareholders have limited external check on capital allocation.
- Cyclical dividend track record. The company cut the dividend 41% in FY25; the payout is not a fixed commitment and can fall again if earnings weaken.
What To Monitor
- EBITDA margin trajectory. Watch whether the full-year ~8.4% margin holds or improves once the Q4 one-time inventory gain washes out and input costs settle. Q1 FY27 (reported after year-end) showed revenue up ~11% to ₹221.6 cr and PAT of ₹14.95 cr — an early read on normalisation.
- Free cash flow recovery. The key sustainability signal — does FCF turn positive as the engineering-plastics capex cycle tapers? A return to positive FCF would move the dividend from “moderately” to “fully” sustainable.
- Receivables and overdraft. Track whether receivables growth re-aligns with revenue and whether the ₹20 cr overdraft is repaid, freeing up the working-capital drag.
- Engineering-plastics ramp-up. Management is banking on this higher-growth segment (₹18.14 cr capitalised in FY26). Watch its revenue contribution and whether it lifts blended ROCE.
- Dividend policy consistency. Whether the next payout continues rebuilding toward the FY24 ₹4.25 peak or plateaus — a tell on management’s confidence in earnings.
Conclusion
Positives
- Dividend raised 20% (₹2.50 → ₹3.00)
- Well covered by earnings (4.7×) and liquidity (7.9×)
- Near debt-free; ~₹42 cr net cash surplus
- PAT up ~10% on flat revenue — margins improving
- Unbroken dividend record; 0% promoter pledge
Negatives
- Real yield only ~1.5% — the “60%” is on face value
- Free cash flow negative; dividend drawn from reserves
- Still 29% below the FY24 ₹4.25 peak
- Receivables +16.5% vs revenue +1.05%; ₹20 cr overdraft
- Low ROE (~8%) and slow ~7% sales growth
Plastiblends India’s ₹3 dividend is a genuine, well-supported cash return from a financially solid, near-debt-free market leader — but it is a modest ~1.5% real yield, not the “60%” the headline implies, and it is a partial recovery from a prior cut rather than a fresh peak. The dividend is safe on earnings and liquidity, with the one honest caveat that FY26’s free cash flow was negative, so this year’s payout leaned on the mutual-fund treasury. Whether the payout keeps climbing depends squarely on margin recovery, working-capital discipline and the engineering-plastics ramp. We present the evidence; the decision is yours.
Frequently Asked Questions
What dividend has Plastiblends India announced for FY2025-26?
What is the real dividend yield — is it really 60%?
What was the record date for the dividend?
What is the ex-dividend date?
When will the dividend be paid?
Who was eligible to receive the dividend?
How is this dividend taxed?
Is the dividend sustainable?
What is Plastiblends’ dividend history?
Why did free cash flow turn negative if profit rose?
How much of the dividend goes to promoters?
What should investors monitor going forward?
What does Plastiblends India do?
Disclaimer
This article is for informational and educational purposes only and does not constitute investment advice, a recommendation, or an offer to buy or sell any security. ShareBazaar Online is not a SEBI-registered investment adviser. Figures for the dividend, financial results and shareholding are drawn from Plastiblends India Limited’s 27 April 2026 board-meeting disclosures and audited FY2025-26 standalone financial statements; market prices, dividend history, peer metrics and taxation rules are sourced from public exchanges, financial aggregators and current tax provisions and may change. Certain figures (such as the ex-date and payment date) are inferred or not disclosed and should be verified against official exchange filings. Keyword and search-demand data referenced in the accompanying publishing package could not be independently verified at the time of writing. Ratios and derived numbers are our own computations and may contain errors. Investors should conduct their own due diligence and consult a qualified financial adviser and tax professional before making any investment decision. Past dividend performance does not guarantee future payouts.