
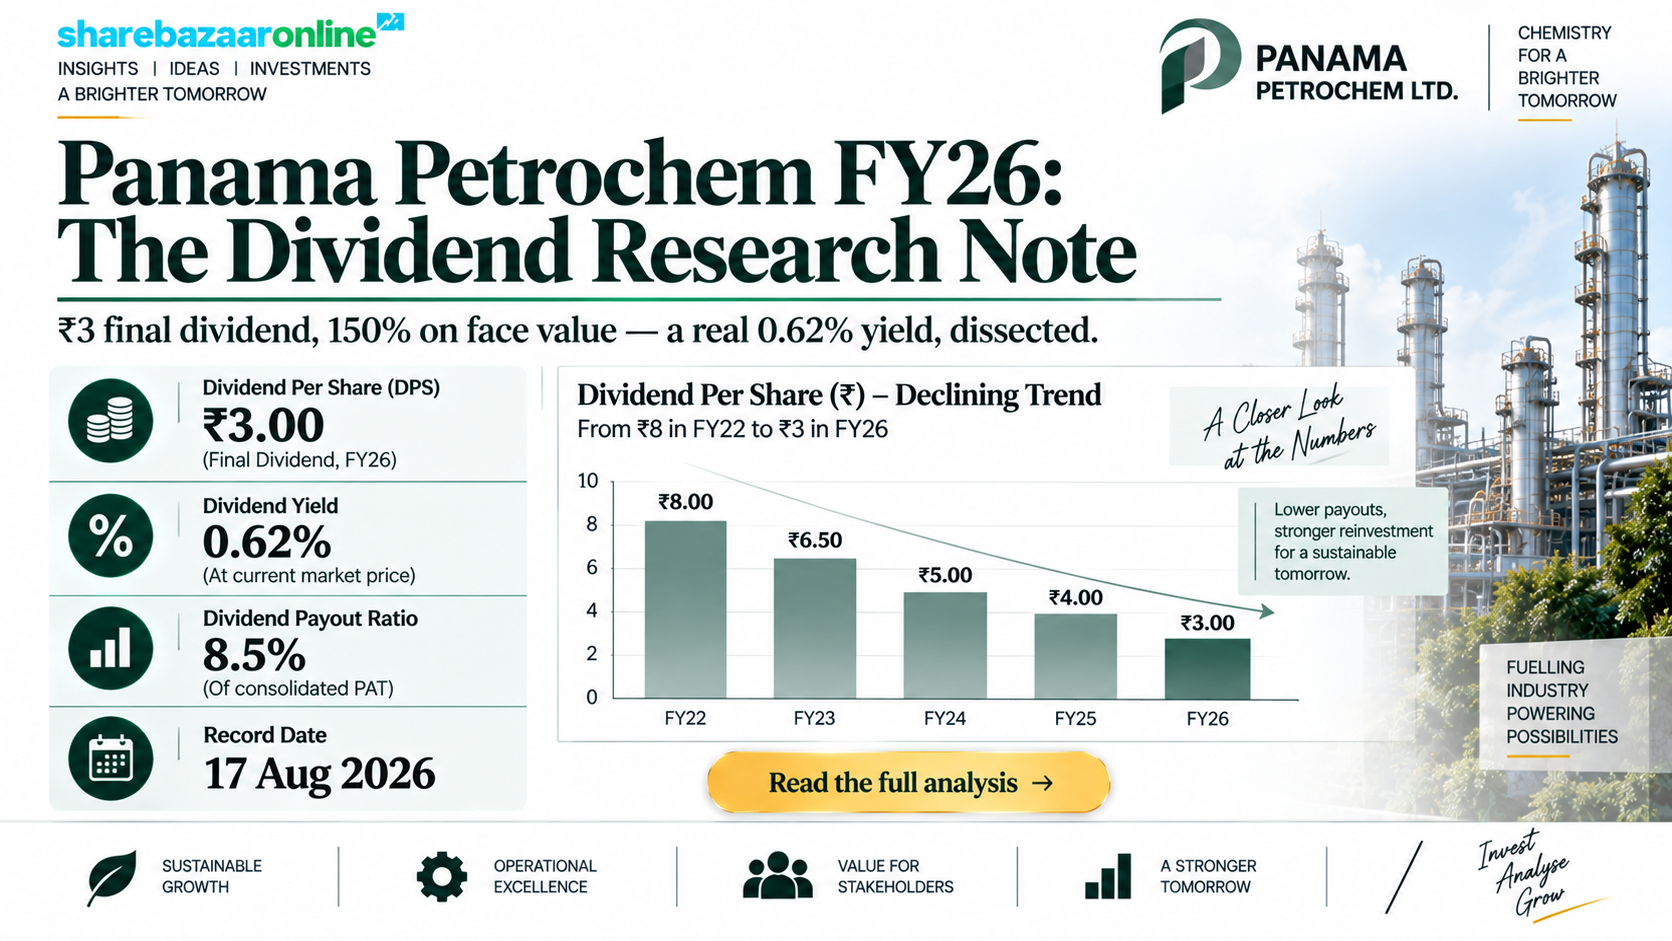
Dividend Snapshot
Panama Petrochem Limited (NSE: PANAMAPET, BSE: 524820) has declared a Final Dividend of ₹3 per equity share for the financial year ended 31 March 2026. On a face value of ₹2, that headline reads as a 150% dividend — but on the market price of roughly ₹483 (mid-September 2026), the real cash return works out to only about 0.62%. This gap between the eye-catching percentage and the actual yield is the first thing every income investor should understand.
Dividend Per Share
₹3.00
Final dividend (150% on ₹2 face value)
Real Dividend Yield (at CMP)
~0.62%
On CMP of about ₹483, not on face value
Record Date
17-Aug-2026
Ex-date the same day under T+1
Estimated Dividend Outflow
~₹18.15 cr
On about 6.05 crore shares
Why this matters: The payout is comfortably covered by earnings, but it is a much smaller dividend than the company paid a few years ago (total ₹8 per share in FY22 versus ₹3 in FY26), and it comes in a year when operating cash flow fell sharply. Panama Petrochem is behaving like a growth-reinvestment company, not an income stock. The sections below walk through the numbers, the cash-flow reality, and how this dividend compares with lubricant-sector peers.
Dividend Announcement Summary
The Board of Directors, at its meeting on 29 May 2026, approved the audited standalone and consolidated results for the quarter and year ended 31 March 2026 and recommended a final dividend of ₹3 per equity share (150%) of face value ₹2, subject to shareholder approval. The statutory auditors issued an unmodified (clean) opinion on the accounts. A separate filing on 16 July 2026 fixed the record date and convened the 44th Annual General Meeting.
What was declared
- Dividend type: Final Dividend (no interim was declared during FY26)
- Amount: ₹3.00 per share — 150% of ₹2 face value
- Financial year: FY2025–26 (ended 31 March 2026)
- Approval: recommended by the Board; put to shareholders at the AGM
Approval & meeting
- 44th AGM: 24 August 2026, 11:30 A.M. IST via video conferencing
- AGM approval was required before the final dividend could be paid
- Subsidiary consolidated: Panol Industries RMC FZE (UAE)
- Company Secretary & Compliance Officer: Gayatri Sharma
Note on figures not in the filing: The record-date intimation itself did not state the dividend amount, market price, yield or financial data. The dividend size (₹3), the board-meeting date (29 May 2026), and all financial figures in this report are sourced from the company’s results announcements and market data, and are labelled as such.
Key Dates Timeline
Board Recommendation (Announcement)
29-May-2026
Dividend recommended with FY26 results
Record Date
17-Aug-2026
Shareholders on the register on this date were entitled
Ex-Dividend Date
17-Aug-2026
Same as record date under T+1 settlement
AGM Date
24-Aug-2026
Shareholder approval of the final dividend
Payment / Dispatch
By 23-Sep-2026
Statutory: within 30 days of AGM; company historically pays within ~2 weeks
Financial Year
FY2025–26
Year ended 31 March 2026
Because the record date (17 August 2026) and the AGM (24 August 2026) have already passed, entitlement is now settled: only members on the register as on the record date were eligible. The exact payment/credit date was not separately notified; the amounts above use the statutory 30-day window and the company’s past practice.
Dividend Yield Analysis
The single most common mistake with this stock is reading “150% dividend” as a 150% return. That 150% is only a percentage of the ₹2 face value — it simply means ₹3 per share. What actually lands in your bank account depends on the price you paid.
The face-value illusion
- Headline “dividend %” = 150% (on ₹2 face value)
- Actual cash = ₹3 per share
- Yield at CMP ~₹483 = 0.62%
- Yield across the 52-week range = roughly 0.50% (at ₹599.6 high) to 1.31% (at ₹229 low)
Yield reality check
The yield is low for a reason that is actually positive on the surface: the share price has re-rated sharply (from about ₹294 in January 2026 to a 52-week high near ₹599.6). A rising price mechanically shrinks the yield even if the dividend were unchanged. But here the dividend was also cut, so the low yield reflects both a higher price and a smaller payout.
Announcement-date yield: Around the 29 May 2026 recommendation the stock traded roughly in the ₹400–415 band (the exact closing price on that day could not be independently confirmed), which would place the yield near 0.7%. Either way, whether measured at announcement or today, this is a sub-1% yield — income seekers should size expectations accordingly.
Dividend History Analysis
Here is the most important, least-reported fact about Panama Petrochem’s dividend: the total annual payout has been falling for four straight years, even as profits rose. The company also did not declare an interim dividend during FY26, so the ₹3 final is the entire year’s payout.
| Financial Year | Interim (₹) | Final (₹) | Total / Share (₹) |
|---|---|---|---|
| FY2020 | — | 1.20 | 1.20 |
| FY2021 | — | 2.00 | 2.00 |
| FY2022 | 2.00 | 6.00 | 8.00 |
| FY2023 | 3.00 | 5.00 | 8.00 |
| FY2024 | 3.00 | 4.00 | 7.00 |
| FY2025 | 2.00 | 3.00 | 5.00 |
| FY2026 | Nil | 3.00 | 3.00 |
Amounts on ₹2 face value. Grouped by the financial year to which the dividend relates. Source: exchange dividend history; figures cited from market data providers.
What the trend shows
- Peak total payout: ₹8 per share (FY22 and FY23)
- FY26 total: ₹3 per share — about 62% below the peak
- Four consecutive years of lower total payout: FY23 → FY26
- FY26 interim skipped for the first time in years
Classification
Panama Petrochem is best described as a consistent but declining-scale payer: it has paid every year for a long stretch, but the amount has been trending down while earnings trend up. That combination — falling dividends alongside rising profits — is the signature of a company choosing reinvestment and cash conservation over distribution.
Financial Performance Analysis
On the reported numbers, FY26 was a good year. On a consolidated basis (which includes the UAE subsidiary, Panol Industries RMC FZE), revenue grew and profit grew faster — a healthy sign of positive operating leverage.
| Metric (Consolidated) | FY2026 | FY2025 | Change |
|---|---|---|---|
| Revenue from operations | ₹3,064.26 cr | ₹2,792.89 cr | +9.72% |
| Profit before tax | ₹262.54 cr | ₹228.38 cr | +14.96% |
| Net profit (PAT) | ₹212.50 cr | ₹187.03 cr | +13.62% |
| EPS (consolidated) | ₹35.13 | — | — |
| Standalone PAT | ₹143.28 cr | ₹116.59 cr | +22.89% |
Operating leverage check
Revenue rose +9.72% while PBT rose +14.96% and PAT +13.62% on a consolidated basis — profit grew faster than sales, which points to margin expansion during the year (Q4 EBITDA margin was reported around 11%). This is the opposite of margin compression and is a genuine positive.
The consolidated-vs-standalone gap
Consolidated PAT (₹212.50 cr) is much larger than standalone PAT (₹143.28 cr). The difference of roughly ₹69 cr — about 33% of consolidated profit — sits in the overseas subsidiary Panol Industries RMC FZE. That profit (and its cash) is offshore, which matters for how freely it can fund an Indian dividend (discussed under Sustainability).
Context worth flagging: Q1 FY27 (quarter ended June 2026) reported a very large consolidated PAT of about ₹308.91 cr, a jump so steep it points to a likely one-off / exceptional item rather than a run-rate. Readers should not annualise that quarter. This report is about the FY26 dividend and uses FY26 numbers.
Cash Flow Analysis
Reported profit is an opinion; cash is a fact. And this is where FY26 gets interesting. Even as consolidated profit rose to ₹212.50 cr, operating cash flow fell sharply to ₹69.38 cr, from ₹162.11 cr in FY25 — a drop of about 57%.
Operating Cash Flow (Consolidated)
₹69.38 cr
Down ~57% from ₹162.11 cr in FY25
Cash Conversion (OCF ÷ PAT)
~33%
Down from ~87% in FY25
What is going on, and does it threaten the dividend?
For a fast-growing manufacturer, weaker operating cash flow in a high-growth year usually means cash is being tied up in working capital — more inventory and receivables to support higher sales — rather than a profitability problem. Panama is also in an expansion phase (new units at Thane and Ambernath, plus a ₹41.6 cr commercial-property purchase in Khar, Mumbai), which absorbs cash. The reassuring part for the dividend specifically: the FY26 payout of about ₹18.15 cr is only a fraction of even the reduced ₹69.38 cr operating cash flow — roughly 3.8x covered. So the dividend is funded out of current operating cash, not borrowings or asset sales. The concern is not this year’s coverage; it is the direction of cash generation, which the company appears to be managing by keeping the dividend modest.
Free cash flow: A precise FY26 free-cash-flow figure (after capex) is Not Disclosed by Company in the results release and could not be independently confirmed line-by-line. Given rising capex, FY26 FCF is likely much thinner than OCF — another reason the board kept the payout small.
Balance Sheet Strength
The balance sheet is the strongest part of the story. Panama Petrochem is almost debt-free and carries more cash than debt.
Net Worth (Consolidated)
~₹1,469 cr
Book value ~₹242.78 per share
Debt Position
Net cash ~₹52 cr
Cash ~₹85 cr vs total debt ~₹33 cr
Return on Equity (ROE)
~15.6%
Consolidated, FY26
Return on Capital Employed (ROCE)
~18–19%
Consolidated, FY26
One nuance: cash on hand of roughly ₹85 cr is modest relative to ₹3,064 cr of revenue. This is a working-capital-heavy trading-and-manufacturing business, so a large slug of assets sits in inventory and receivables rather than idle cash. Debtor days did improve (reported down from about 47.6 to 36.0). The company is financially healthy, but it is not sitting on a huge cash pile it could shower on shareholders — which again fits the modest dividend.
Dividend Sustainability Analysis
We score sustainability on four independent tests. The question is not “is ₹3 affordable?” (it clearly is) but “is the current dividend policy durable, and could it even grow?”
1. Earnings coverage — Strong
Consolidated EPS ₹35.13 covers the ₹3 dividend about 11.7x; even standalone EPS (~₹23.7) covers it about 7.9x. Payout ratio is just ~8.5% consolidated (~12.7% standalone). Enormous headroom.
2. Operating cash coverage — Adequate
FY26 OCF of ₹69.38 cr covers the ~₹18.15 cr outflow about 3.8x. Comfortable this year, but the 57% fall in OCF is the watch-item.
3. Liquidity / cash coverage — Adequate
Cash of ~₹85 cr covers the payout about 4.7x, and the company is net-cash. But much of consolidated profit and cash is in the UAE subsidiary, and repatriation is not frictionless.
4. Earnings trend — Positive
Profits are growing (PAT +13.6% consolidated, +22.9% standalone). A rising earnings base is the best long-run support for any dividend.
Verdict: Sustainable at the current level — but management is deliberately choosing not to grow it
All four tests pass, so the ₹3 is safe. The more honest read is that the dividend is sustainable precisely because it has been cut to a level that leaves plenty of cash for expansion. Investors expecting the payout to climb back toward the old ₹7–8 range should note the clear signal in the FY26 numbers: rising profits, a skipped interim, weaker operating cash, and heavy capex all point to reinvestment, not distribution.
Peer Comparison
Against other listed specialty-oil and lubricant companies, Panama Petrochem is a low-yield, growth-oriented name. If you want dividend income from this sector, the peer set makes the trade-off obvious.
| Company | Approx Dividend Yield | ROE | Profile |
|---|---|---|---|
| Panama Petrochem | ~0.6% | ~15.6% | Growth / reinvestment, net cash |
| Gulf Oil Lubricants | ~4.8% | ~23% | High, consistent payer (ROCE ~47%) |
| Castrol India | ~3%+ | High | Established high-payout brand |
| Savita Oil Technologies | ~0.7–1.0% | ~10% | Specialty oils, net cash, low yield |
| Veedol Corporation | Moderate | — | Lubricants, dividend payer |
Peer yields/ROE are approximate, cited from market-data providers and vary with price; verify against the latest disclosures before use.
Takeaway: Panama Petrochem has the lowest dividend yield in this peer group — roughly one-eighth of Gulf Oil’s. Its ROE (~15.6%) is respectable but below Gulf Oil’s (~23%). For income, Gulf Oil and Castrol are the yield plays; Panama is a bet on capacity expansion and export growth translating into higher earnings over time, with the dividend as a small extra rather than the main event.
Promoter Impact Analysis
Who gets the dividend
- Promoter & promoter group: ~63.16%
- FIIs: ~11.7–12%
- DIIs: ~0.7% (very small institutional footprint)
- Public / others: ~24.4%
Promoter dividend income
At ~63.16% of the ~₹18.15 cr outflow, promoters receive roughly ₹11.5 cr of this dividend; public and institutional shareholders share the balance (~₹6.7 cr). Because the payout is small, the dividend is not a major promoter cash-extraction channel — unlike some high-payout companies, here the promoter benefit is modest in absolute terms.
One structural note: promoter holding has drifted down over the last three years (reported roughly −6.7 percentage points; it was above 71% in late 2021). Falling promoter stake alongside falling dividends is worth watching, though at ~63% promoters still hold clear majority control and there is no reported pledge.
Taxation Analysis
Since April 2020, dividends in India are taxed in the hands of the shareholder at their applicable income-tax slab rate — there is no separate Dividend Distribution Tax anymore, and no special exemption. The dividend is simply added to your total income.
The rules in brief
- Dividend is taxable at your slab rate (5% / 20% / 30% etc.)
- TDS at 10% applies once total dividend from a company in a year exceeds ₹5,000 (20% if PAN is not provided)
- You can claim credit for TDS when filing your return
- NRIs face higher TDS (typically 20% plus surcharge/cess, subject to treaty relief)
Worked example — generic (₹10/share)
Investor owns 1,000 shares, dividend ₹10/share, 30% slab:
Gross dividend = ₹10,000
TDS @10% (above ₹5,000) = ₹1,000 (adjustable)
Tax @30% = ₹3,000
Net in hand = ₹7,000
Effective post-tax yield falls by ~30% versus the gross yield.
Worked example — Panama Petrochem (₹3/share)
Investor owns 1,000 shares, dividend ₹3/share, 30% slab:
Gross dividend = ₹3,000 — below the ₹5,000 threshold, so no TDS is deducted
Tax @30% (paid via your return) = ₹900
Net in hand = ₹2,100
On a purchase price near ₹483, that ₹2,100 is a post-tax yield of roughly 0.43% — a useful reminder that after tax the income is very small.
Tax treatment is general and illustrative, not personal tax advice. Rules and thresholds can change; confirm current provisions and your own slab with a qualified tax professional.
Key Risks
1. Declining dividend trend
Total payout has fallen from ₹8 (FY22) to ₹3 (FY26) and the FY26 interim was skipped. Income investors should not assume a return to the old payout level.
2. Weakening operating cash flow
OCF fell ~57% in FY26 and cash conversion dropped to ~33% of PAT. If working-capital intensity keeps rising, free cash available for dividends stays constrained.
3. Raw-material and crude-linked margins
Base oils and petroleum feedstock costs move with crude oil. Sharp input-cost swings or an inability to pass them on can compress margins and profits.
4. Offshore profit concentration
Roughly a third of consolidated profit sits in the UAE subsidiary. Currency moves, and any friction in repatriating that cash, affect how much is truly available for Indian shareholder dividends.
5. Export & demand cyclicality
A large share of revenue is exports across many countries. Global demand softness, freight/logistics disruption, or trade barriers can hit volumes and realisations.
6. Valuation & volatility
The stock has re-rated sharply (roughly ₹294 to a ₹599.6 high within the year) and is small-cap and volatile. A one-off-flattered quarter can distort trailing multiples.
What To Monitor
1. Operating cash flow recovery
Watch whether FY27 OCF rebounds toward PAT. A return to ~80%+ cash conversion would signal working capital is normalising and the dividend has room to grow.
2. Whether an interim dividend returns
The skipped FY26 interim was a signal. A reinstated interim in FY27 would suggest a shift back toward distribution.
3. Capex intensity & new-plant ramp-up
Track how the Thane/Ambernath units and the Khar property scale up, and how much capex the company keeps committing — heavy capex keeps the payout low.
4. Margin trend vs crude
Follow gross and EBITDA margins quarter to quarter against base-oil/crude prices to gauge pricing power.
5. Promoter holding & shareholding shifts
Note further changes in promoter stake and any pledge, plus FII/DII activity, in each quarterly shareholding pattern.
6. Quality of earnings
Separate recurring operating profit from one-offs (as in the outsized Q1 FY27 PAT) before drawing conclusions about the run-rate that funds future dividends.
Conclusion
Panama Petrochem’s FY26 final dividend of ₹3 per share is a well-covered, financially safe payout from a fundamentally sound, near-debt-free specialty-oils manufacturer with growing profits (consolidated PAT +13.6%) and healthy returns (ROE ~15.6%, ROCE ~18–19%). On those measures the business is in good shape.
But as a dividend, it is small and shrinking. The “150%” headline is really a ~0.62% yield; the total annual payout has fallen from ₹8 (FY22) to ₹3 (FY26); the FY26 interim was skipped; and operating cash flow dropped ~57% while the company spends on expansion. Read together, the signal is consistent: management is conserving cash for growth, not maximising distributions.
Bottom line for the reader: treat Panama Petrochem as a growth story that pays a token dividend, not as an income stock. If you want yield from this sector, peers like Gulf Oil (~4.8%) offer far more. If you own Panama for its earnings and export-led expansion, the dividend is a small bonus — and the numbers here should help you decide, on your own, which of those you are actually buying.
Frequently Asked Questions
What dividend has Panama Petrochem announced for FY2026?
What is the real dividend yield of Panama Petrochem?
What was the record date for the dividend?
What was the ex-dividend date?
When will the dividend be paid?
Who was eligible to receive this dividend?
How is this dividend taxed?
Is Panama Petrochem’s dividend sustainable?
What is Panama Petrochem’s dividend history?
Why did the dividend fall even though profits rose?
How does the yield compare with peers?
What should investors monitor going forward?
Is Panama Petrochem a good stock for dividend income?
Disclaimer
This article is for informational and educational purposes only and does not constitute investment, financial, legal or tax advice, nor a recommendation to buy, sell or hold any security. ShareBazaar Online is not a SEBI-registered investment adviser. Dividend figures and the record date are from Panama Petrochem Limited’s exchange filings; market prices, financial ratios, peer data and other figures are compiled from third-party sources believed reliable but not independently guaranteed, and may contain errors or become outdated. Share prices are volatile and past performance does not indicate future results. Certain figures are approximate or estimated and are labelled accordingly; some data was “Not Disclosed by Company.” Readers must verify all information against original company disclosures and consult a qualified, registered financial adviser and tax professional before making any investment decision. ShareBazaar Online and its authors accept no liability for any loss arising from the use of this content.